
By Dmitriy Gurkovskiy, Chief Analyst at RoboForex
In March, Gold updated its high at $2,078.80 and then started a correction. Early in a new week March week, the precious metal is trading at $1,977.
Gold is an excellent tool for investors to protect them from the consequences of increasing inflation, which is expected to continue rising for a while longer. It means that the fundamental support factor for Gold will remain in effect. The US inflation is at its 40-year high and there are barely any reasons for the indicator to go down.
The current decline in Gold is probably the result of profit-taking. Gold enthusiasts do not consider the strong USD factor, as they are supported by stable demand for the precious metal.
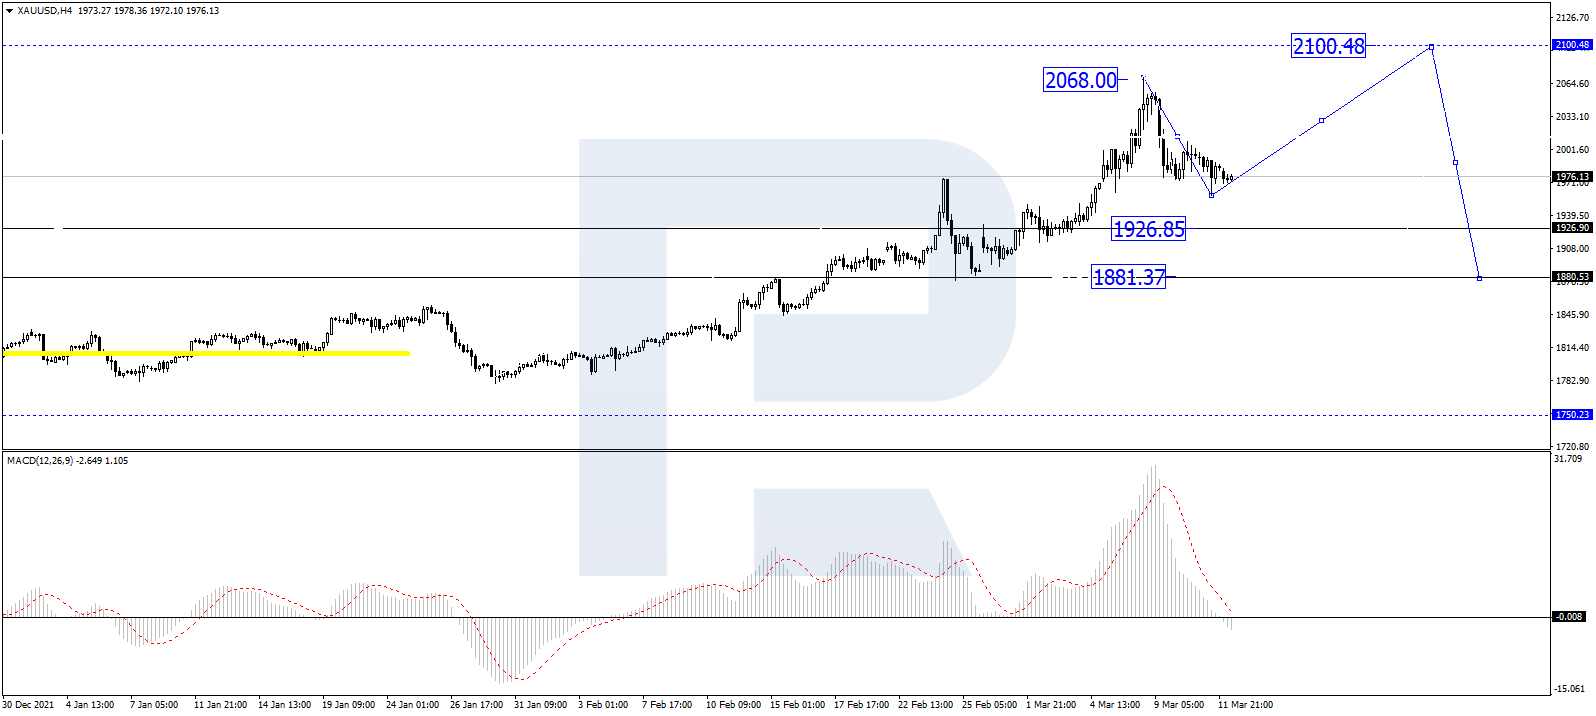
As we can see in the H4 chart, after completing the descending wave at 1958.50 along with the ascending impulse towards 1987.90, XAU/USD is forming a new consolidation range between these two levels. Possibly, the metal may break the range to the upside and grow with the first target at 2015.60. Later, the market may start a new decline to reach 1980.00. On the other hand, if the price breaks the above-mentioned range to the downside, the asset may resume trading downwards towards 1877.50. From the technical point of view, this scenario is confirmed by the Stochastic Oscillator: after breaking 50 to the upside, its signal line is expected to grow towards 80. Otherwise, the indicator may resume falling to reach 20.
Free Reports:
 Get our Weekly Commitment of Traders Reports - See where the biggest traders (Hedge Funds and Commercial Hedgers) are positioned in the futures markets on a weekly basis.
 Download Our Metatrader 4 Indicators – Put Our Free MetaTrader 4 Custom Indicators on your charts when you join our Weekly Newsletter
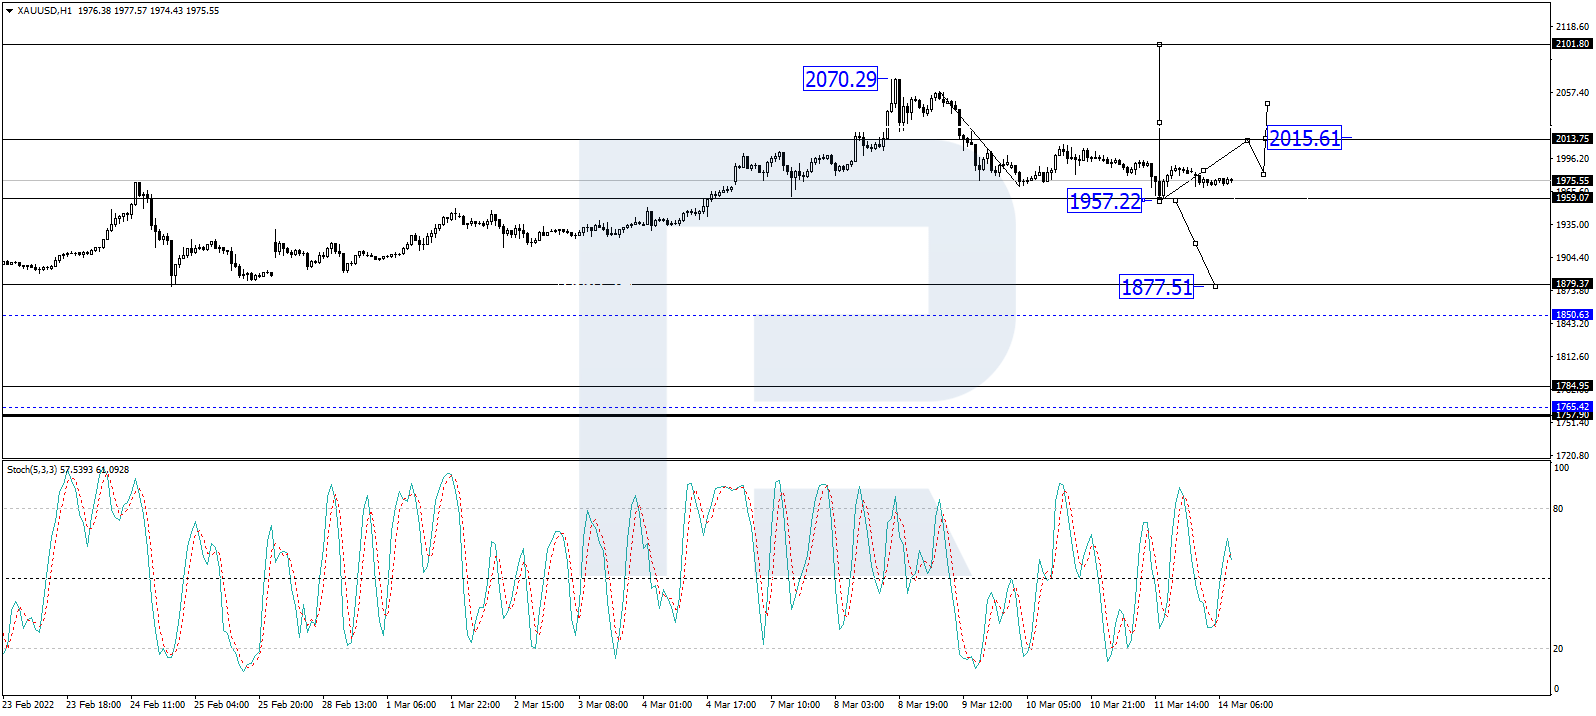
In the H1 chart, Gold has finished the correctional wave at 1958.50; right now, it is consolidating near the lows. Possibly, the metal may form one more ascending wave towards 2015.00 and then start another correction to reach 1982.00, thus forming a new consolidation range between these two levels. If the price breaks this range to the upside, the market may resume growing towards 2100.00 or even reach 2200.00; if to the downside – correct down to 1850.00. From the technical point of view, this scenario is confirmed by MACD Oscillator: its signal is falling to break 0 and may later continue moving downwards to reach new lows. However, if the line rebound from 0, it may grow towards new highs.
Disclaimer
Any forecasts contained herein are based on the author’s particular opinion. This analysis may not be treated as trading advice. RoboForex bears no responsibility for trading results based on trading recommendations and reviews contained herein.

- The US introduces new import tariffs for 60 countries. Brent crude surpasses $100 per barrel Jul 24, 2026
- USD/JPY Breaks Records: Nothing Slows the Yen’s Decline Jul 24, 2026
- Oil prices reached a 6‑week high. The AUD strengthened on the back of a strong labor‑market report Jul 23, 2026
- EUR/USD Recovers as Dollar Weakens Jul 23, 2026
- Bitcoin rose to $66,000. The New Zealand dollar continues to strengthen Jul 22, 2026
- Inflationary pressure is easing in Canada. In New Zealand, on the contrary, inflation is rising Jul 21, 2026
- GBP/USD Falls After Cabinet Changes Jul 21, 2026
- Geopolitical and macroeconomic conditions continue to pressure market sentiment Jul 20, 2026
- USD/JPY Poised to Continue Gains as Expensive Oil and Lack of Support Weigh on Yen Jul 20, 2026
- COT Metals Charts: Weekly Speculator Bets led by Copper & Steel Jul 18, 2026