
By Orbex
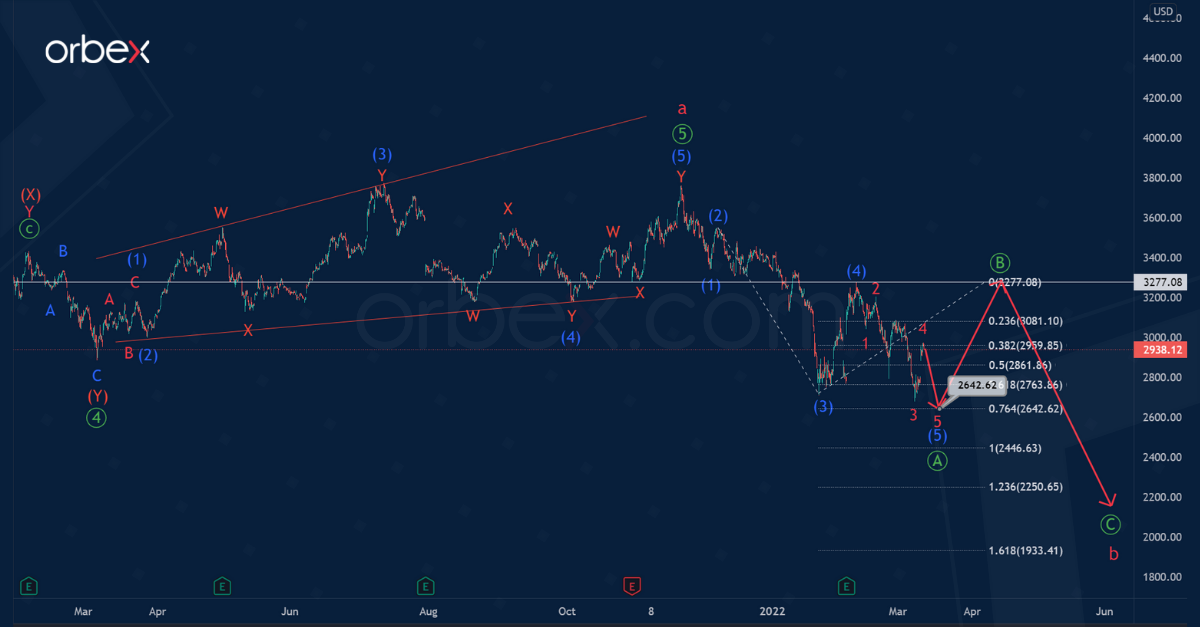
In the long term, the AMZN structure shows a simple zigzag consisting of sub-waves a-b-c of the cycle degree.
The first major wave a is a bullish impulse consisting of primary sub-waves ①-②-③-④-⑤. In the last section of the chart, there is a decrease in the price. This could indicate the beginning of the construction of a bearish correction b. This correction could take the simple form of an Ⓐ-Ⓑ-Ⓒ zigzag.
In the near future, a decline in the final intermediate wave (5) is possible. In turn, this could end the primary impulse wave Ⓐ near 2642.62. At that level, wave (5) will be at 76.4% of the previous impulse (3).
After the completion of the primary impulse wave Ⓐ, the stock price will begin to rise in correction Ⓑ, as shown on the chart.
Free Reports:
 Sign Up for Our Stock Market Newsletter – Get updated on News, Charts & Rankings of Public Companies when you join our Stocks Newsletter
 Get our Weekly Commitment of Traders Reports - See where the biggest traders (Hedge Funds and Commercial Hedgers) are positioned in the futures markets on a weekly basis.
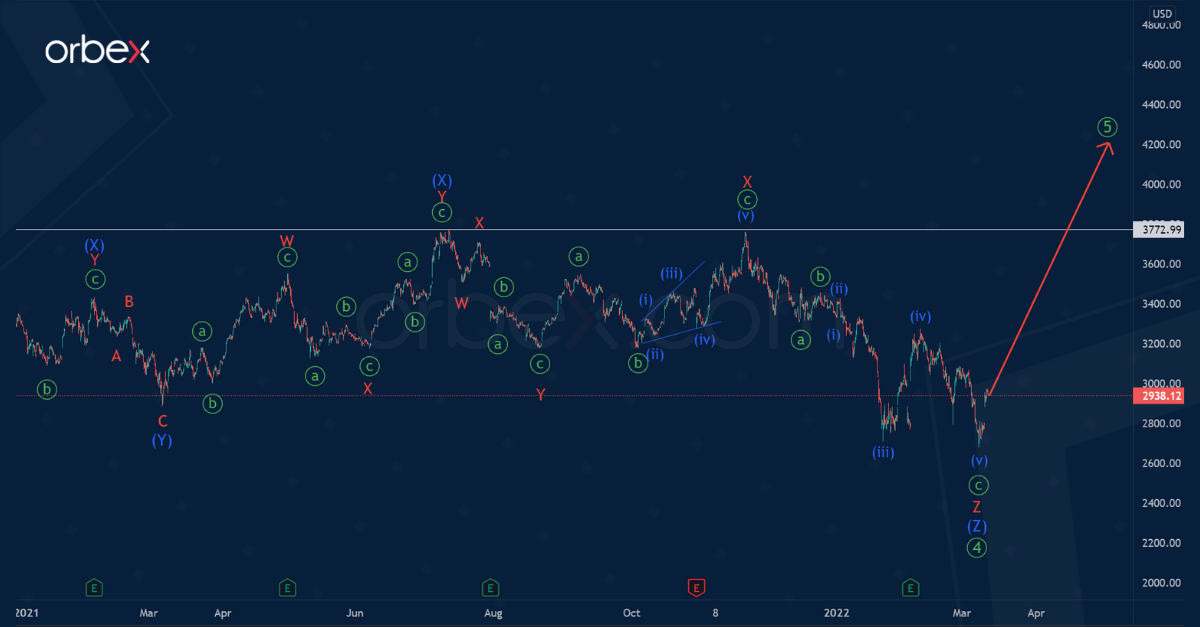
Alternatively, only recently has the primary correction ④ ended.
On the current chart, there is the final part of this correction. It took the form of an intermediate triple zigzag (W)-(X)-(Y)-(X)-(Z).
If our assumption is correct, then the market will start moving up within the final wave ⑤ of the primary degree.
Most likely, prices will rise significantly above the high of 3772.99.
Join our responsible trading community – Open your Orbex account now!
![]() Article by Orbex
Article by Orbex
Orbex is a fully licensed broker that was established in 2011. Founded with a mission to serve its traders responsibly and provides traders with access to the world’s largest and most liquid financial markets. www.orbex.com

- The US introduces new import tariffs for 60 countries. Brent crude surpasses $100 per barrel Jul 24, 2026
- USD/JPY Breaks Records: Nothing Slows the Yen’s Decline Jul 24, 2026
- Oil prices reached a 6‑week high. The AUD strengthened on the back of a strong labor‑market report Jul 23, 2026
- EUR/USD Recovers as Dollar Weakens Jul 23, 2026
- Bitcoin rose to $66,000. The New Zealand dollar continues to strengthen Jul 22, 2026
- Inflationary pressure is easing in Canada. In New Zealand, on the contrary, inflation is rising Jul 21, 2026
- GBP/USD Falls After Cabinet Changes Jul 21, 2026
- Geopolitical and macroeconomic conditions continue to pressure market sentiment Jul 20, 2026
- USD/JPY Poised to Continue Gains as Expensive Oil and Lack of Support Weigh on Yen Jul 20, 2026
- COT Metals Charts: Weekly Speculator Bets led by Copper & Steel Jul 18, 2026