
By InvestMacro | COT | Data Tables | COT Leaders | Downloads | COT Newsletter
Here are the latest charts and statistics for the Commitment of Traders (COT) data published by the Commodities Futures Trading Commission (CFTC).
The latest COT data is updated through Tuesday February 8th 2022 and shows a quick view of how large traders (for-profit speculators and commercial entities) were positioned in the futures markets.
Highlighting the COT energy data is the recent slide in the Heating Oil futures bets. The speculative net position in the #2 Heating Oil NY-Harbor futures has fallen for three out of the past four weeks and for thirteen out of the past seventeen weeks. These decreases have brought the overall net standing for heating oil to just +6,455 contracts, the lowest level since late December. Heating oil contracts have been in positive bullish territory for sixty-seven straight weeks, dating back to October of 2020. The most recent high was a total of +39,137 contracts on October 12th of 2021 but contracts have been on a downtrend since then. The heating oil price, meanwhile, has been on a sharp uptrend (like most energy prices) so there is a divergence at the current moment between the speculators (typically trend followers) and the price direction.
The markets with rising speculator bets this week were Natural Gas (4,921 contracts) and the Bloomberg Commodity Index (2,430 contracts) while WTI Crude Oil (-5,521 contracts), Brent Crude Oil (-7,403 contracts), Heating Oil (-9,228 contracts) and Gasoline (-2,600 contracts) fell.
| Feb-08-2022 | OI | OI-Index | Spec-Net | Spec-Index | Com-Net | COM-Index | Smalls-Net | Smalls-Index |
|---|---|---|---|---|---|---|---|---|
| WTI Crude | 2,170,681 | 46 | 363,383 | 18 | -412,144 | 69 | 48,761 | 84 |
| Gold | 512,842 | 23 | 186,706 | 47 | -211,434 | 53 | 24,728 | 34 |
| Silver | 147,379 | 14 | 19,299 | 42 | -32,571 | 67 | 13,272 | 20 |
| Copper | 201,860 | 28 | 18,855 | 56 | -25,523 | 42 | 6,668 | 64 |
| Palladium | 7,497 | 5 | -1,230 | 14 | 1,035 | 83 | 195 | 56 |
| Platinum | 58,766 | 20 | 11,759 | 19 | -16,638 | 85 | 4,879 | 30 |
| Natural Gas | 1,133,934 | 6 | -115,089 | 44 | 85,151 | 58 | 29,938 | 55 |
| Brent | 208,578 | 46 | -26,323 | 73 | 22,725 | 27 | 3,598 | 58 |
| Heating Oil | 349,618 | 31 | 6,455 | 52 | -32,434 | 37 | 25,979 | 88 |
| Soybeans | 832,618 | 52 | 209,730 | 82 | -176,080 | 24 | -33,650 | 14 |
| Corn | 1,575,318 | 34 | 419,602 | 84 | -382,874 | 17 | -36,728 | 22 |
| Coffee | 273,102 | 39 | 66,867 | 97 | -72,255 | 3 | 5,388 | 26 |
| Sugar | 931,602 | 25 | 79,090 | 53 | -96,963 | 50 | 17,873 | 30 |
| Wheat | 385,172 | 26 | -3,578 | 44 | 7,972 | 49 | -4,394 | 81 |
Free Reports:
 Download Our Metatrader 4 Indicators – Put Our Free MetaTrader 4 Custom Indicators on your charts when you join our Weekly Newsletter
 Get our Weekly Commitment of Traders Reports - See where the biggest traders (Hedge Funds and Commercial Hedgers) are positioned in the futures markets on a weekly basis.
WTI Crude Oil Futures:
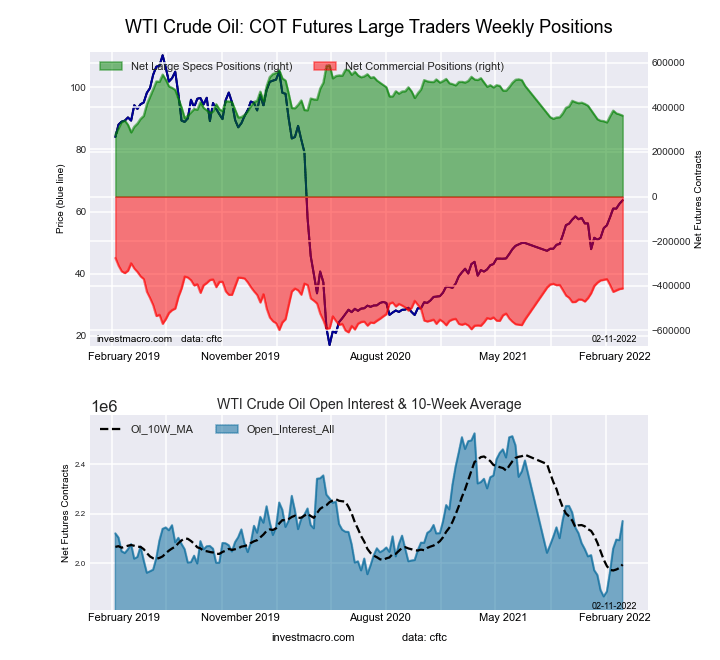 The WTI Crude Oil Futures large speculator standing this week recorded a net position of 363,383 contracts in the data reported through Tuesday. This was a weekly decrease of -5,521 contracts from the previous week which had a total of 368,904 net contracts.
This week’s current strength score (the trader positioning range over the past three years, measured from 0 to 100) shows the speculators are currently Bearish-Extreme with a score of 17.9 percent. The commercials are Bullish with a score of 68.6 percent and the small traders (not shown in chart) are Bullish-Extreme with a score of 83.7 percent.
| WTI Crude Oil Futures Statistics | SPECULATORS | COMMERCIALS | SMALL TRADERS |
| – Percent of Open Interest Longs: | 22.1 | 35.1 | 4.9 |
| – Percent of Open Interest Shorts: | 5.4 | 54.1 | 2.6 |
| – Net Position: | 363,383 | -412,144 | 48,761 |
| – Gross Longs: | 480,560 | 762,286 | 105,794 |
| – Gross Shorts: | 117,177 | 1,174,430 | 57,033 |
| – Long to Short Ratio: | 4.1 to 1 | 0.6 to 1 | 1.9 to 1 |
| NET POSITION TREND: | |||
| – Strength Index Score (3 Year Range Pct): | 17.9 | 68.6 | 83.7 |
| – Strength Index Reading (3 Year Range): | Bearish-Extreme | Bullish | Bullish-Extreme |
| NET POSITION MOVEMENT INDEX: | |||
| – 6-Week Change in Strength Index: | 9.1 | -13.6 | 19.9 |
Brent Crude Oil Futures:
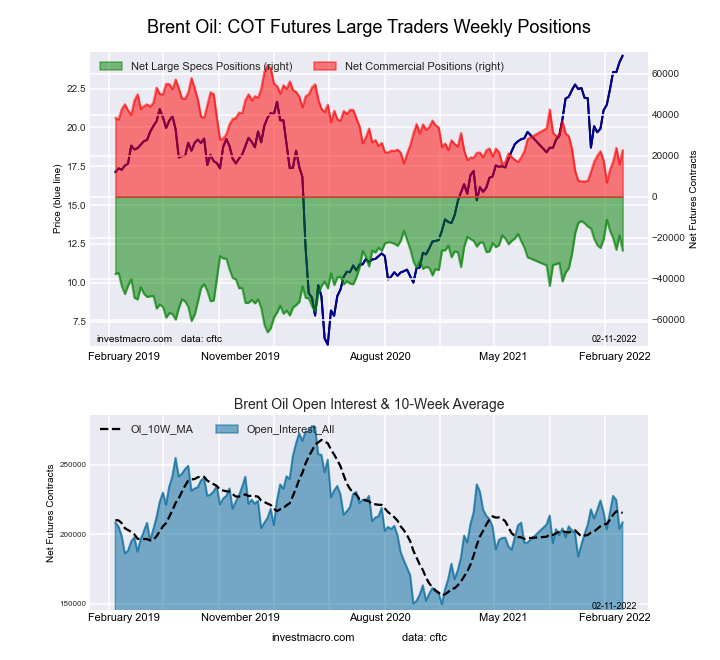 The Brent Crude Oil Futures large speculator standing this week recorded a net position of -26,323 contracts in the data reported through Tuesday. This was a weekly lowering of -7,403 contracts from the previous week which had a total of -18,920 net contracts.
This week’s current strength score (the trader positioning range over the past three years, measured from 0 to 100) shows the speculators are currently Bullish with a score of 72.6 percent. The commercials are Bearish with a score of 27.5 percent and the small traders (not shown in chart) are Bullish with a score of 57.9 percent.
| Brent Crude Oil Futures Statistics | SPECULATORS | COMMERCIALS | SMALL TRADERS |
| – Percent of Open Interest Longs: | 18.6 | 47.8 | 4.4 |
| – Percent of Open Interest Shorts: | 31.2 | 36.9 | 2.7 |
| – Net Position: | -26,323 | 22,725 | 3,598 |
| – Gross Longs: | 38,825 | 99,625 | 9,166 |
| – Gross Shorts: | 65,148 | 76,900 | 5,568 |
| – Long to Short Ratio: | 0.6 to 1 | 1.3 to 1 | 1.6 to 1 |
| NET POSITION TREND: | |||
| – Strength Index Score (3 Year Range Pct): | 72.6 | 27.5 | 57.9 |
| – Strength Index Reading (3 Year Range): | Bullish | Bearish | Bullish |
| NET POSITION MOVEMENT INDEX: | |||
| – 6-Week Change in Strength Index: | -10.2 | 9.0 | 6.4 |
Natural Gas Futures:
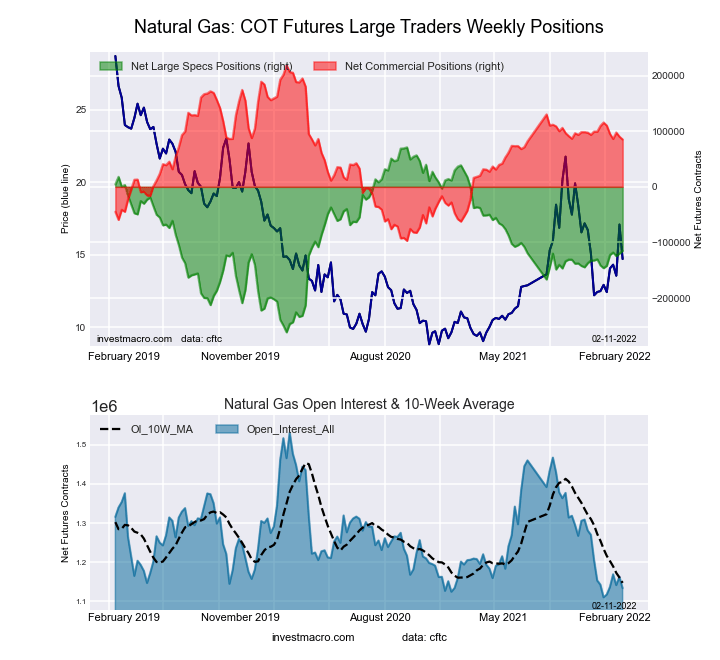 The Natural Gas Futures large speculator standing this week recorded a net position of -115,089 contracts in the data reported through Tuesday. This was a weekly gain of 4,921 contracts from the previous week which had a total of -120,010 net contracts.
This week’s current strength score (the trader positioning range over the past three years, measured from 0 to 100) shows the speculators are currently Bearish with a score of 44.0 percent. The commercials are Bullish with a score of 57.7 percent and the small traders (not shown in chart) are Bullish with a score of 54.8 percent.
| Natural Gas Futures Statistics | SPECULATORS | COMMERCIALS | SMALL TRADERS |
| – Percent of Open Interest Longs: | 21.2 | 41.5 | 5.1 |
| – Percent of Open Interest Shorts: | 31.4 | 33.9 | 2.5 |
| – Net Position: | -115,089 | 85,151 | 29,938 |
| – Gross Longs: | 240,829 | 470,065 | 57,837 |
| – Gross Shorts: | 355,918 | 384,914 | 27,899 |
| – Long to Short Ratio: | 0.7 to 1 | 1.2 to 1 | 2.1 to 1 |
| NET POSITION TREND: | |||
| – Strength Index Score (3 Year Range Pct): | 44.0 | 57.7 | 54.8 |
| – Strength Index Reading (3 Year Range): | Bearish | Bullish | Bullish |
| NET POSITION MOVEMENT INDEX: | |||
| – 6-Week Change in Strength Index: | 9.4 | -9.6 | -1.7 |
Gasoline Blendstock Futures:
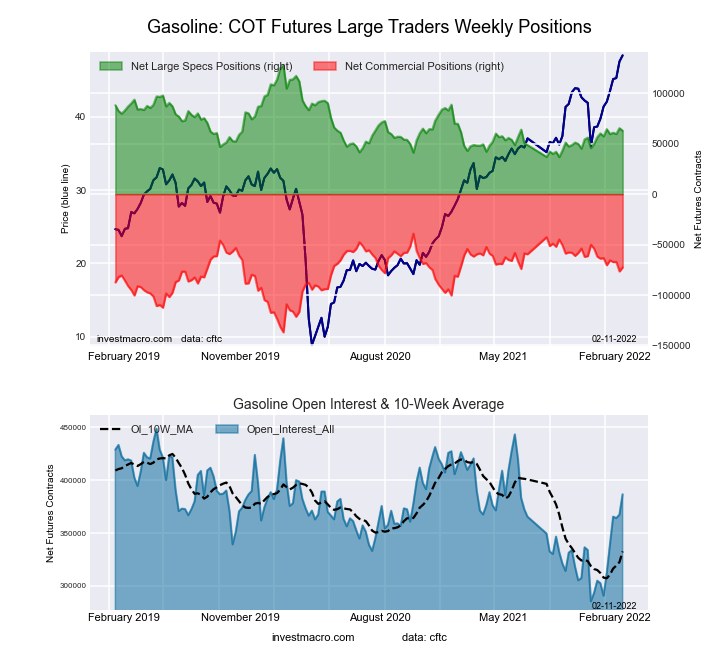 The Gasoline Blendstock Futures large speculator standing this week recorded a net position of 62,752 contracts in the data reported through Tuesday. This was a weekly reduction of -2,600 contracts from the previous week which had a total of 65,352 net contracts.
This week’s current strength score (the trader positioning range over the past three years, measured from 0 to 100) shows the speculators are currently Bearish with a score of 34.0 percent. The commercials are Bullish with a score of 64.4 percent and the small traders (not shown in chart) are Bullish with a score of 70.4 percent.
| Nasdaq Mini Futures Statistics | SPECULATORS | COMMERCIALS | SMALL TRADERS |
| – Percent of Open Interest Longs: | 28.0 | 49.5 | 6.2 |
| – Percent of Open Interest Shorts: | 11.8 | 68.3 | 3.7 |
| – Net Position: | 62,752 | -72,595 | 9,843 |
| – Gross Longs: | 108,363 | 191,576 | 24,008 |
| – Gross Shorts: | 45,611 | 264,171 | 14,165 |
| – Long to Short Ratio: | 2.4 to 1 | 0.7 to 1 | 1.7 to 1 |
| NET POSITION TREND: | |||
| – Strength Index Score (3 Year Range Pct): | 34.0 | 64.4 | 70.4 |
| – Strength Index Reading (3 Year Range): | Bearish | Bullish | Bullish |
| NET POSITION MOVEMENT INDEX: | |||
| – 6-Week Change in Strength Index: | 5.6 | -9.3 | 22.4 |
#2 Heating Oil NY-Harbor Futures:
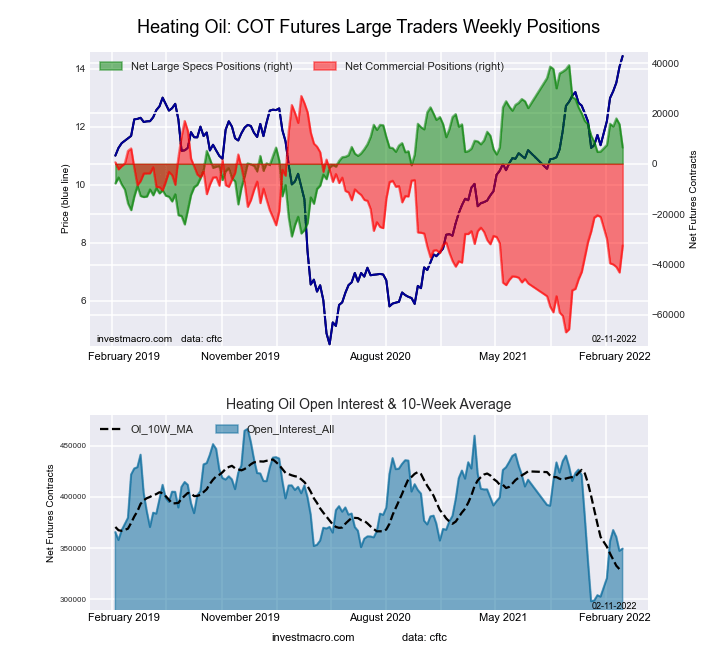 The #2 Heating Oil NY-Harbor Futures large speculator standing this week recorded a net position of 6,455 contracts in the data reported through Tuesday. This was a weekly decrease of -9,228 contracts from the previous week which had a total of 15,683 net contracts.
This week’s current strength score (the trader positioning range over the past three years, measured from 0 to 100) shows the speculators are currently Bullish with a score of 51.9 percent. The commercials are Bearish with a score of 36.7 percent and the small traders (not shown in chart) are Bullish-Extreme with a score of 88.4 percent.
| Heating Oil Futures Statistics | SPECULATORS | COMMERCIALS | SMALL TRADERS |
| – Percent of Open Interest Longs: | 17.0 | 50.8 | 14.4 |
| – Percent of Open Interest Shorts: | 15.1 | 60.1 | 6.9 |
| – Net Position: | 6,455 | -32,434 | 25,979 |
| – Gross Longs: | 59,340 | 177,626 | 50,210 |
| – Gross Shorts: | 52,885 | 210,060 | 24,231 |
| – Long to Short Ratio: | 1.1 to 1 | 0.8 to 1 | 2.1 to 1 |
| NET POSITION TREND: | |||
| – Strength Index Score (3 Year Range Pct): | 51.9 | 36.7 | 88.4 |
| – Strength Index Reading (3 Year Range): | Bullish | Bearish | Bullish-Extreme |
| NET POSITION MOVEMENT INDEX: | |||
| – 6-Week Change in Strength Index: | 4.2 | -10.3 | 23.6 |
Bloomberg Commodity Index Futures:
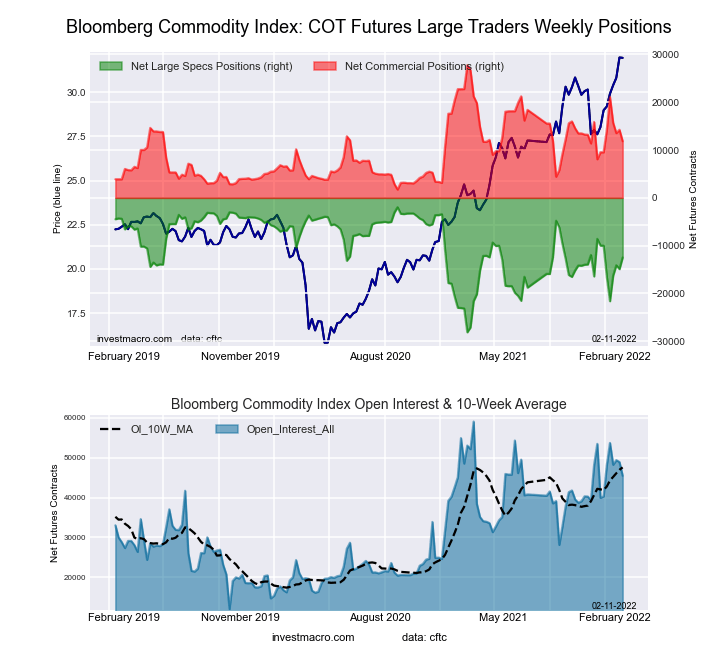 The Bloomberg Commodity Index Futures large speculator standing this week recorded a net position of -12,468 contracts in the data reported through Tuesday. This was a weekly advance of 2,430 contracts from the previous week which had a total of -14,898 net contracts.
This week’s current strength score (the trader positioning range over the past three years, measured from 0 to 100) shows the speculators are currently Bullish with a score of 59.8 percent. The commercials are Bearish with a score of 38.9 percent and the small traders (not shown in chart) are Bearish with a score of 41.6 percent.
| Bloomberg Index Futures Statistics | SPECULATORS | COMMERCIALS | SMALL TRADERS |
| – Percent of Open Interest Longs: | 68.4 | 27.4 | 1.5 |
| – Percent of Open Interest Shorts: | 95.8 | 1.4 | 0.1 |
| – Net Position: | -12,468 | 11,845 | 623 |
| – Gross Longs: | 31,105 | 12,468 | 670 |
| – Gross Shorts: | 43,573 | 623 | 47 |
| – Long to Short Ratio: | 0.7 to 1 | 20.0 to 1 | 14.3 to 1 |
| NET POSITION TREND: | |||
| – Strength Index Score (3 Year Range Pct): | 59.8 | 38.9 | 41.6 |
| – Strength Index Reading (3 Year Range): | Bullish | Bearish | Bearish |
| NET POSITION MOVEMENT INDEX: | |||
| – 6-Week Change in Strength Index: | -9.5 | 8.9 | 5.9 |
Article By InvestMacro – Receive our weekly COT Reports by Email
*COT Report: The COT data, released weekly to the public each Friday, is updated through the most recent Tuesday (data is 3 days old) and shows a quick view of how large speculators or non-commercials (for-profit traders) were positioned in the futures markets.
The CFTC categorizes trader positions according to commercial hedgers (traders who use futures contracts for hedging as part of the business), non-commercials (large traders who speculate to realize trading profits) and nonreportable traders (usually small traders/speculators) as well as their open interest (contracts open in the market at time of reporting).See CFTC criteria here.

- Oil prices jumped 4% amid a new wave of escalation between the US and Iran Jul 13, 2026
- EUR/USD: US Inflation Will Determine Everything Jul 13, 2026
- COT Metals Charts: Weekly Speculator Bets see small gains for Silver & Gold Jul 12, 2026
- COT Bonds Charts: Speculator Bets led by SOFR 3-Months & 2-Year Bonds Jul 12, 2026
- COT Energy Charts: Weekly Speculator Changes led by Brent Oil Jul 12, 2026
- COT Soft Commodities Charts: Weekly Speculator Changes led by Sugar, Corn & Soybeans Jul 12, 2026
- The US and European stock indices are rising again amid renewed investor interest in the AI industry. Jul 10, 2026
- USD/JPY Falls as Yen Recovers Weekly Losses Jul 10, 2026
- Crude oil prices surged sharply by 7% in reaction to the rapid escalation of the conflict in the Middle East Jul 9, 2026
- Middle East Tensions Weigh on Gold Jul 9, 2026