
Article By RoboForex.com
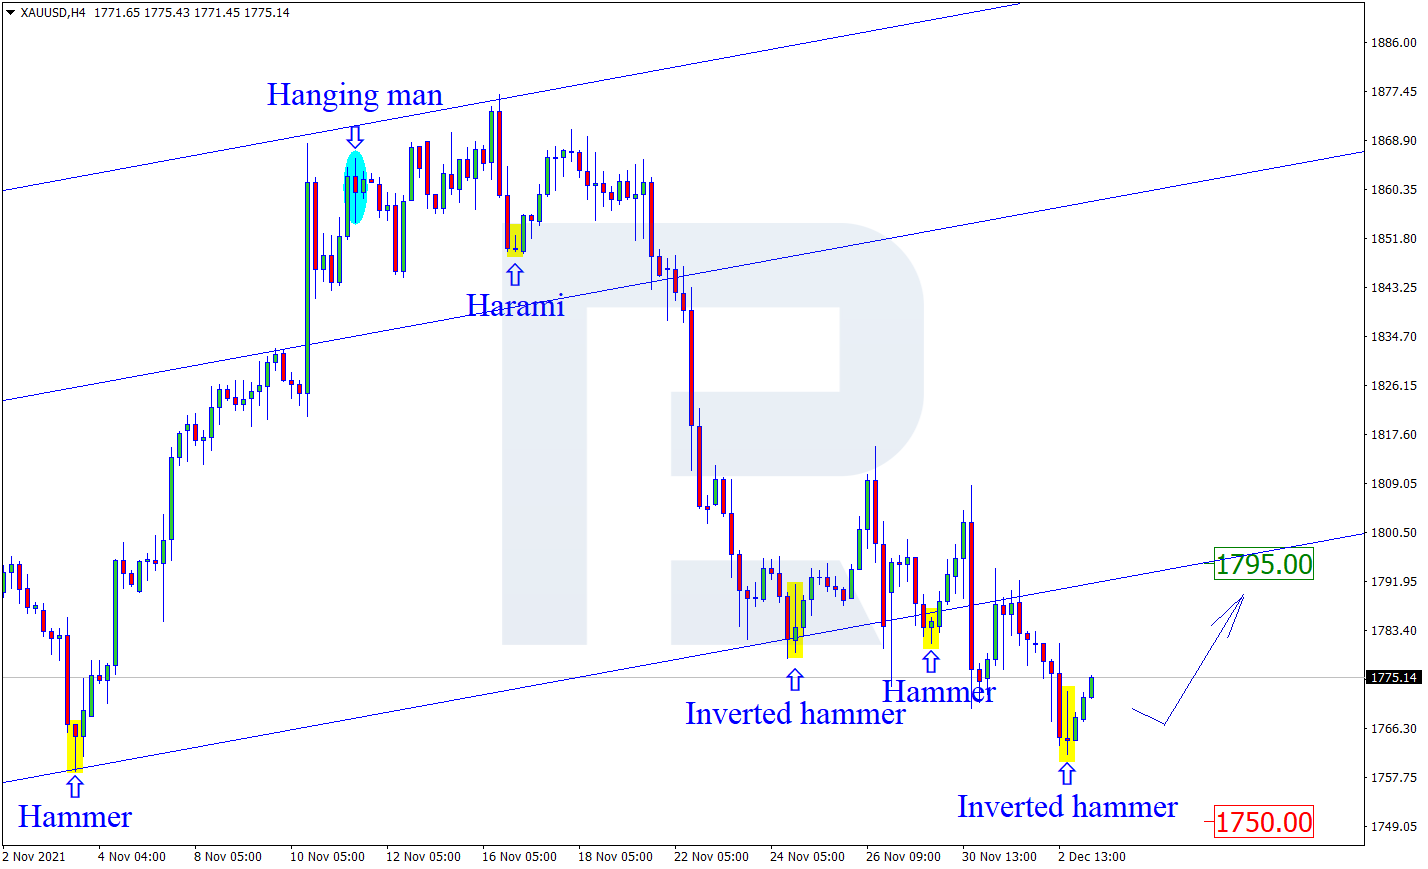
XAUUSD, “Gold vs US Dollar”
As we can see in the H4 chart, the asset is correcting. After forming an Inverted Hammer reversal pattern not far from the support level, XAUUSD may reverse and form a new rising impulse. In this case, the upside target may be the resistance area at 1795.00. At the same time, an opposite scenario implies that the price may fall towards 1750.00 first and then resume trading upwards.

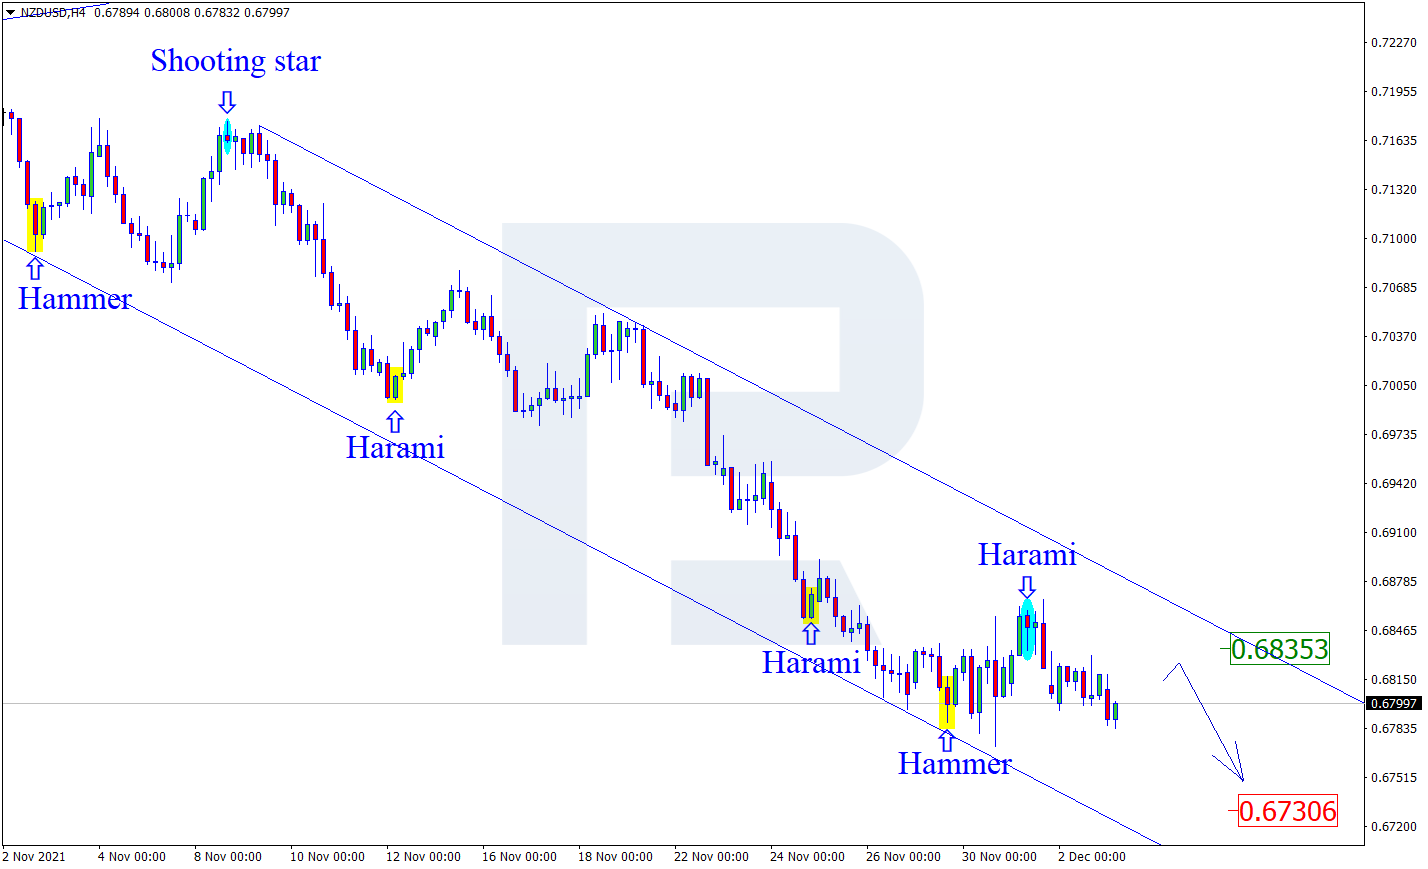
NZDUSD, “New Zealand vs US Dollar”
As we can see in the H4 chart, NZDUSD continues trading sideways; it has formed several reversal patterns, such as Harami. At the moment, the asset is reversing in the form of a new decline towards the next support area. In this case, the downside target may be at 0.6730. After that, the asset may break this level and continue moving downwards. However, an alternative scenario implies that the price may correct to reach 0.6835 before resuming its decline.
Free Reports:
 Get our Weekly Commitment of Traders Reports - See where the biggest traders (Hedge Funds and Commercial Hedgers) are positioned in the futures markets on a weekly basis.
 Download Our Metatrader 4 Indicators – Put Our Free MetaTrader 4 Custom Indicators on your charts when you join our Weekly Newsletter
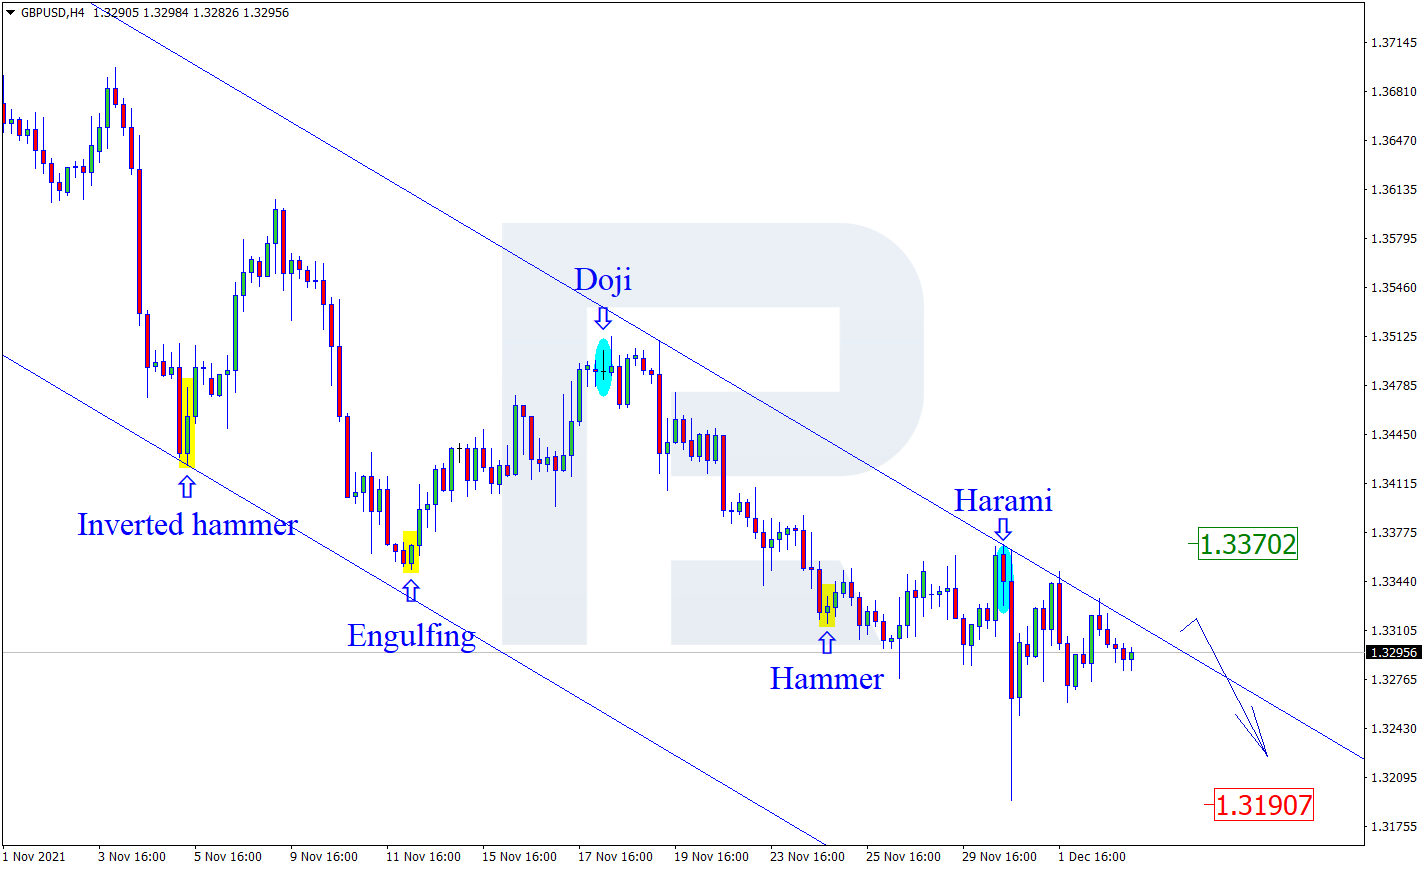
GBPUSD, “Great Britain Pound vs US Dollar”
As we can see in the H4 chart, GBPUSD continues trading sideways not far from the support area, where it has formed several reversal patterns, for example, Harami. At the moment, the pair may reverse and start a new descending impulse. In this case, the downside target may be at 1.3190. After testing the next support area, the market may break it and continue trading downwards. Still, there might be an alternative scenario, according to which the asset may correct to reach 1.3370 before resuming its descending tendency.
Article By RoboForex.com
Attention!
Forecasts presented in this section only reflect the author’s private opinion and should not be considered as guidance for trading. RoboForex LP bears no responsibility for trading results based on trading recommendations described in these analytical reviews.

- Oil prices jumped 4% amid a new wave of escalation between the US and Iran Jul 13, 2026
- EUR/USD: US Inflation Will Determine Everything Jul 13, 2026
- COT Metals Charts: Weekly Speculator Bets see small gains for Silver & Gold Jul 12, 2026
- COT Bonds Charts: Speculator Bets led by SOFR 3-Months & 2-Year Bonds Jul 12, 2026
- COT Energy Charts: Weekly Speculator Changes led by Brent Oil Jul 12, 2026
- COT Soft Commodities Charts: Weekly Speculator Changes led by Sugar, Corn & Soybeans Jul 12, 2026
- The US and European stock indices are rising again amid renewed investor interest in the AI industry. Jul 10, 2026
- USD/JPY Falls as Yen Recovers Weekly Losses Jul 10, 2026
- Crude oil prices surged sharply by 7% in reaction to the rapid escalation of the conflict in the Middle East Jul 9, 2026
- Middle East Tensions Weigh on Gold Jul 9, 2026