Article By RoboForex.com
GBPUSD, “Great Britain Pound vs US Dollar”
As we can see in the H4 chart, after failing to test the long-term 38.2% fibo at 1.3166, the asset is forming a new pullback to the upside. However, it doesn’t mean that the descending tendency is over. Convergence on MACD is another signal in favour of the ascending correction. A breakout of the local low at 1.3194 will lead to a further downtrend towards the long-term target. The key resistance is at 1.3834.


The H1 chart shows a more detailed structure of the current growth towards 23.6% fibo at 1.3345. After a slight pullback, the correctional uptrend may continue to reach 38.2% and 50.0% fibo at 1.3438 and 1.3514 respectively.


Free Reports:
 Download Our Metatrader 4 Indicators – Put Our Free MetaTrader 4 Custom Indicators on your charts when you join our Weekly Newsletter
 Get our Weekly Commitment of Traders Reports - See where the biggest traders (Hedge Funds and Commercial Hedgers) are positioned in the futures markets on a weekly basis.
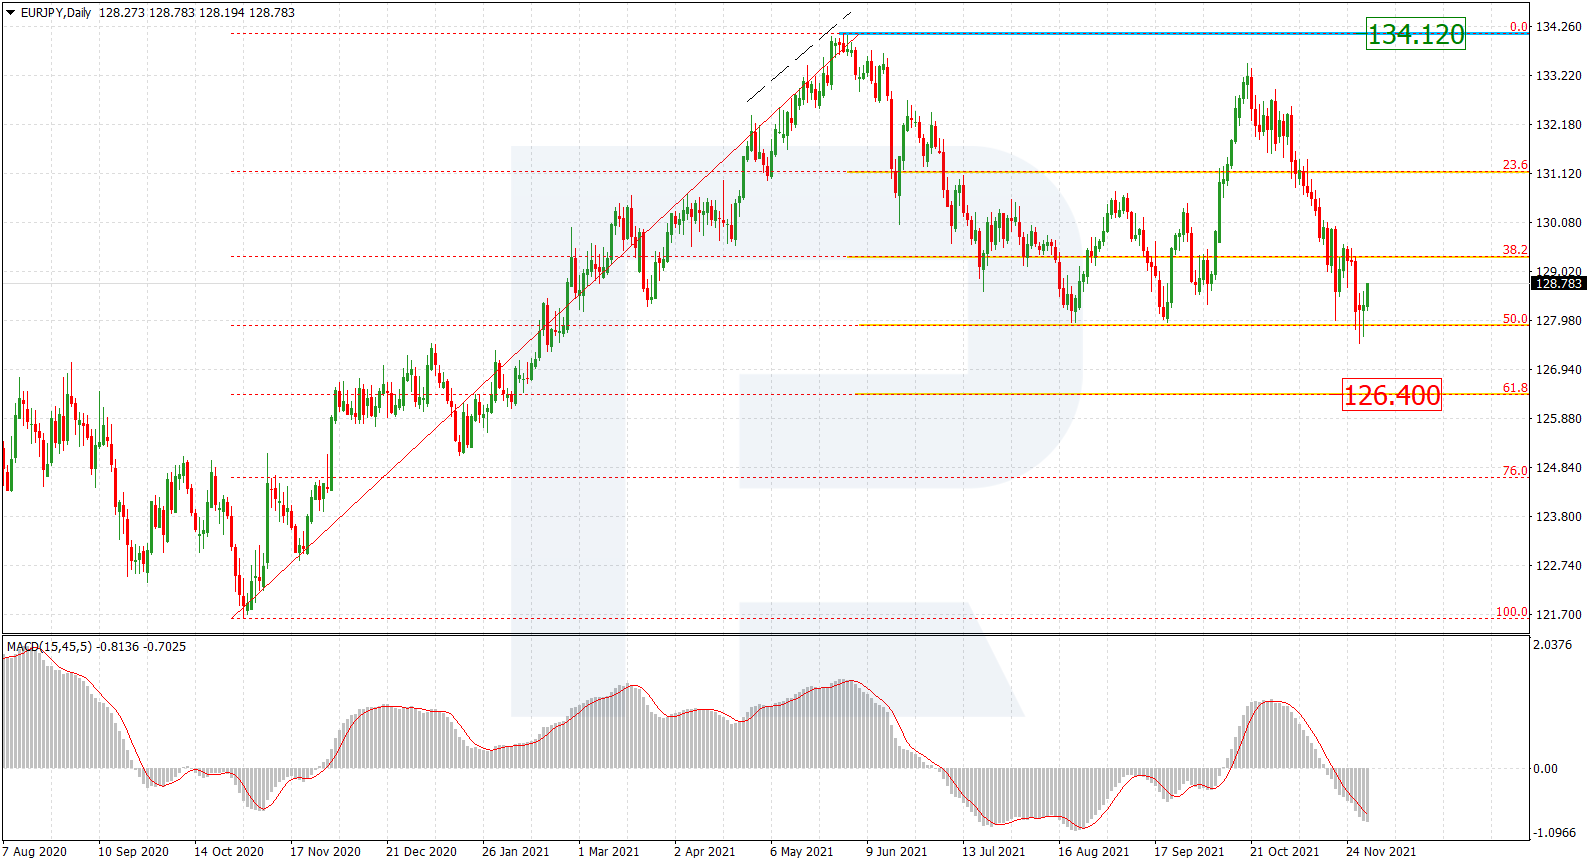
EURJPY, “Euro vs. Japanese Yen”
The daily chart shows that after falling and reaching 50.0% fibo, EURJPY is correcting upwards. After the pullback is over, the asset may continue falling towards 61.8% fibo at 126.40. Later, the market may start a new uptrend to reach the high at 134.12.


As we can see in the H4 chart, after testing and breaking the mid-term 50.0% fibo, EURJPY is correcting upwards; right now, it is approaching 23.6% fibo at 128.90 and may later continue towards 38.2% and 50.0% fibo at 129.78 and 130.48 respectively. The support is the low at 127.49.

Article By RoboForex.com
Attention!
Forecasts presented in this section only reflect the author’s private opinion and should not be considered as guidance for trading. RoboForex LP bears no responsibility for trading results based on trading recommendations described in these analytical reviews.

- COT Metals Charts: Speculator Bets led lower by Gold, Copper & Silver Apr 5, 2025
- COT Bonds Charts: Speculator Bets led by SOFR 1-Month & US Treasury Bonds Apr 5, 2025
- COT Soft Commodities Charts: Speculator Bets led by Soybean Oil, Cotton & Soybeans Apr 5, 2025
- COT Stock Market Charts: Speculator Bets led by S&P500 & Nasdaq Apr 5, 2025
- Today, investors focus on the Non-Farm Payrolls labor market report Apr 4, 2025
- USD/JPY collapses to a 6-month low: safe-haven assets in demand Apr 4, 2025
- GBP/USD Hits 21-Week High: The Pound Outperforms Its Peers Apr 3, 2025
- Most of the tariffs imposed by the Trump administration take effect today Apr 2, 2025
- EUR/USD Declines as Markets Await Signals of a Renewed Trade War Apr 2, 2025
- “Liberation Day”: How markets might react to Trump’s April 2nd tariff announcement? Apr 2, 2025
