
By Dmitriy Gurkovskiy, Chief Analyst at RoboForex
On Monday, 13 December, the major currency pair is trading at 1.1300.
Last Friday’s statistics on the US Consumer Price Index were not surprising, although a bit unusual. The indicator skyrocketed to 6.8% y/y in November. On MoM, inflation was 0.8% against the expected reading of 0.7%.
Based on the latest inflation reports, among other things, the US Fed may announce its decision to speed up the closure of its QE programme by at least fifty per cent. In this case, the programme may be щук as early as March 2022 and the Fed may start discussing the rate hike in May.
Investors believe that the regulator may raise the rate by 50 basis points next year.
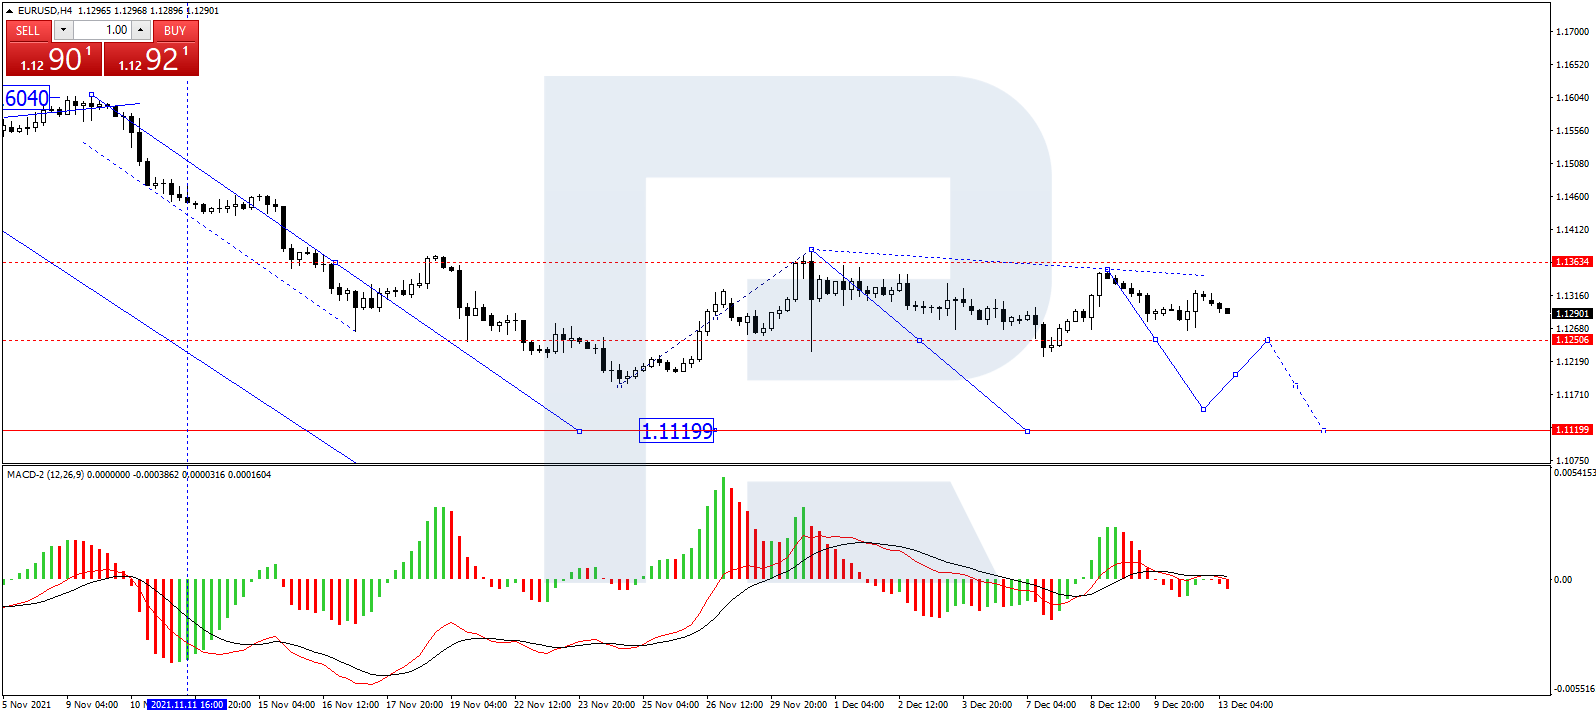
In the H4 chart, EUR/USD is trading downwards to reach 1.1120 and may later consolidate there. If the price breaks the range to the upside, the market may start a new correction with the target at 1.1363. From the technical point of view, this scenario is confirmed by MACD Oscillator: its signal line is moving below 0 and may later continue falling towards new lows.
Free Reports:
 Get our Weekly Commitment of Traders Reports - See where the biggest traders (Hedge Funds and Commercial Hedgers) are positioned in the futures markets on a weekly basis.
 Download Our Metatrader 4 Indicators – Put Our Free MetaTrader 4 Custom Indicators on your charts when you join our Weekly Newsletter
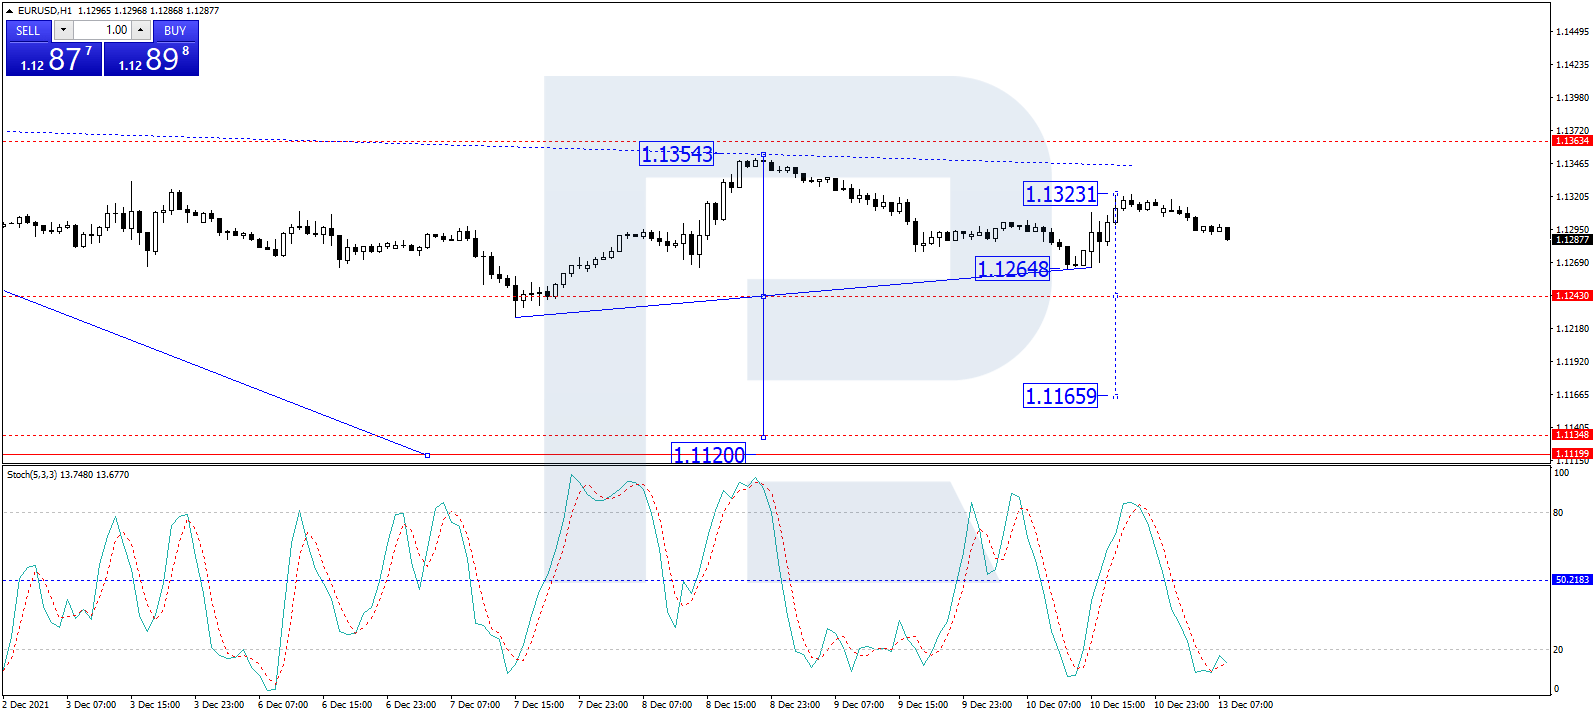
As we can see in the H1 chart, EUR/USD is forming another descending structure to break 1.1243 and may later continue falling with the short-term target at 1.1166. After that, the instrument may correct to return to 1.1243 and then resume falling towards 1.1100. From the technical point of view, this idea is confirmed by the Stochastic Oscillator: its signal line is moving below 20, thus implying further decline towards new lows.
Disclaimer
Any forecasts contained herein are based on the author’s particular opinion. This analysis may not be treated as trading advice. RoboForex bears no responsibility for trading results based on trading recommendations and reviews contained herein.

- The US indices sell off amid renewed US-Iran clashes. Oil jumps by 7% Jul 30, 2026
- USD/JPY Temporary in Equilibrium: Multiple Factors in Focus Jul 30, 2026
- GBP/USD at Month’s Lows: The Outlook Remains Weak Jul 29, 2026
- Crude oil falls below $80 per barrel. Australia sees inflation slowdown Jul 29, 2026
- The US Tech sector hit by sell‑off. Oil prices decline on renewed negotiations Jul 28, 2026
- Gold Declines, Focus on Fed and Falling Oil Prices Jul 28, 2026
- This week will be one of the most crowded for central‑bank meetings Jul 27, 2026
- EUR/USD Ahead of a Key Week: Holding Near Lows Jul 27, 2026
- COT Metals Charts: Weekly Speculator Changes led by Copper Jul 26, 2026
- COT Bonds Charts: Speculator Bets led by SOFR 3-Months & 5-Year Bonds Jul 26, 2026
