
Article By RoboForex.com
USDCAD, “US Dollar vs Canadian Dollar”
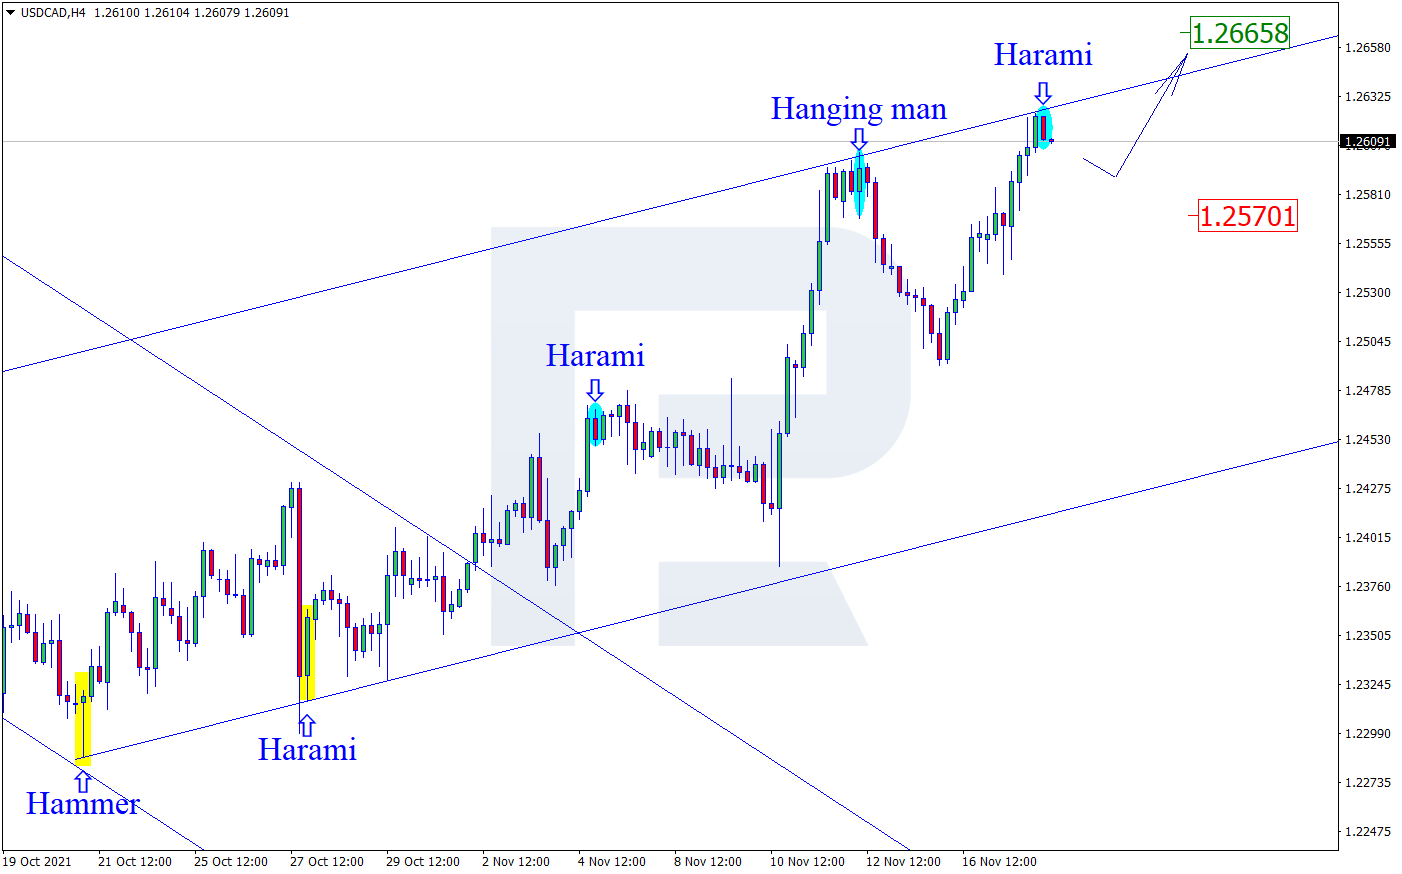
НAs we can see in the H4 chart, after forming several reversal patterns, including Harami, close to the resistance level, USDCAD is reversing in the form of a new pullback. In this case, the downside correctional target may be the support area at 1.2570. However, an alternative scenario implies that the asset may continue growing to reach 1.2665 without correcting towards the support area.

AUDUSD, “Australian Dollar vs US Dollar”
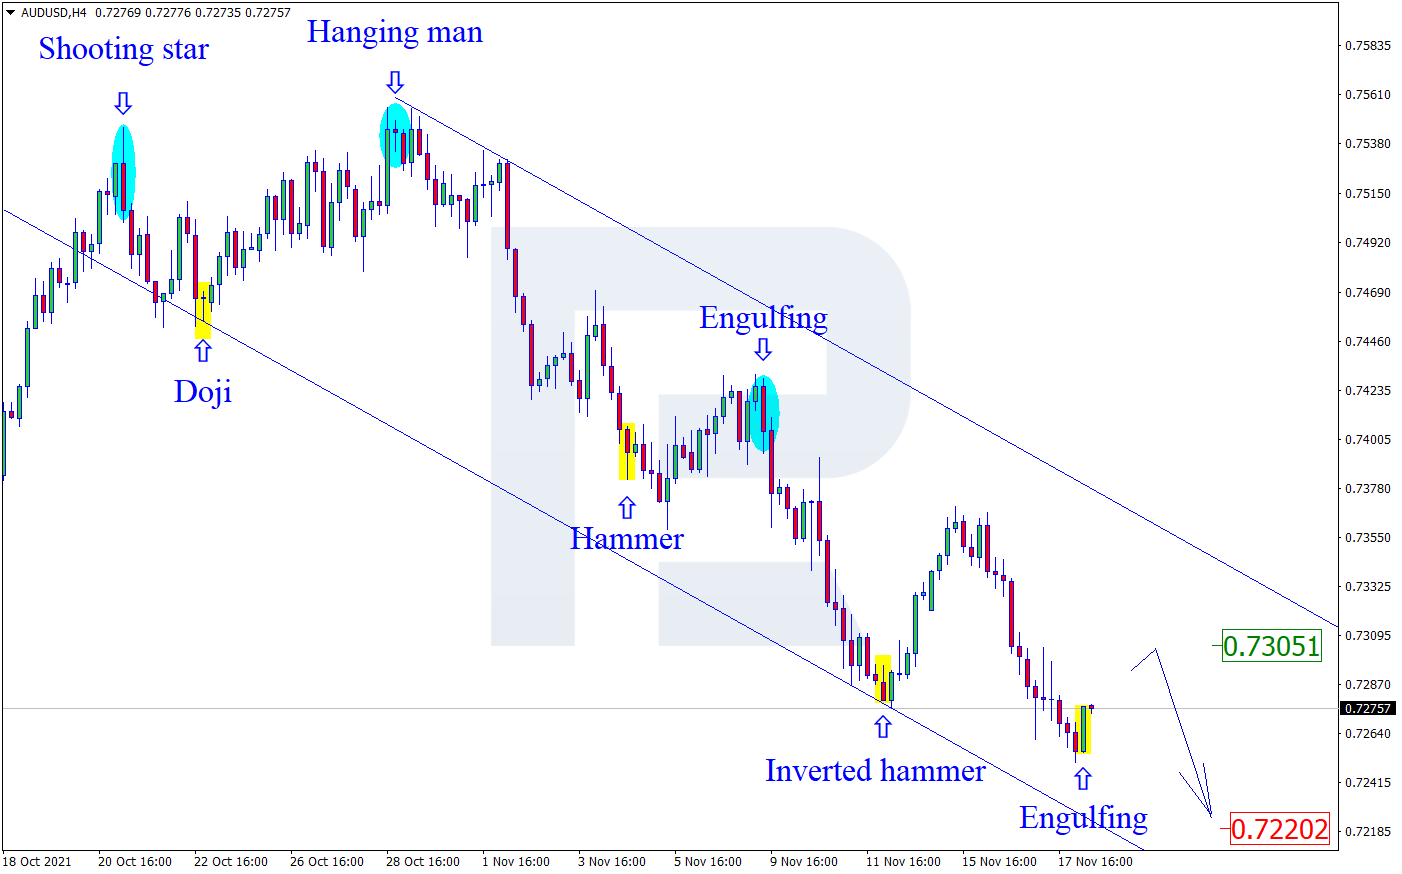
As we can see in the H4 chart, AUDUSD has formed several reversal patterns, such as Engulfing, near the support level. At the moment, the asset may reverse in the form of a new correctional impulse. In this case, the upside correctional target may be the resistance area at 0.7305. At the same time, an opposite scenario implies that the price may continue falling to reach 0.7220 without testing the resistance area.
Free Reports:
 Get our Weekly Commitment of Traders Reports - See where the biggest traders (Hedge Funds and Commercial Hedgers) are positioned in the futures markets on a weekly basis.
 Sign Up for Our Stock Market Newsletter – Get updated on News, Charts & Rankings of Public Companies when you join our Stocks Newsletter
USDCHF, “US Dollar vs Swiss Franc”
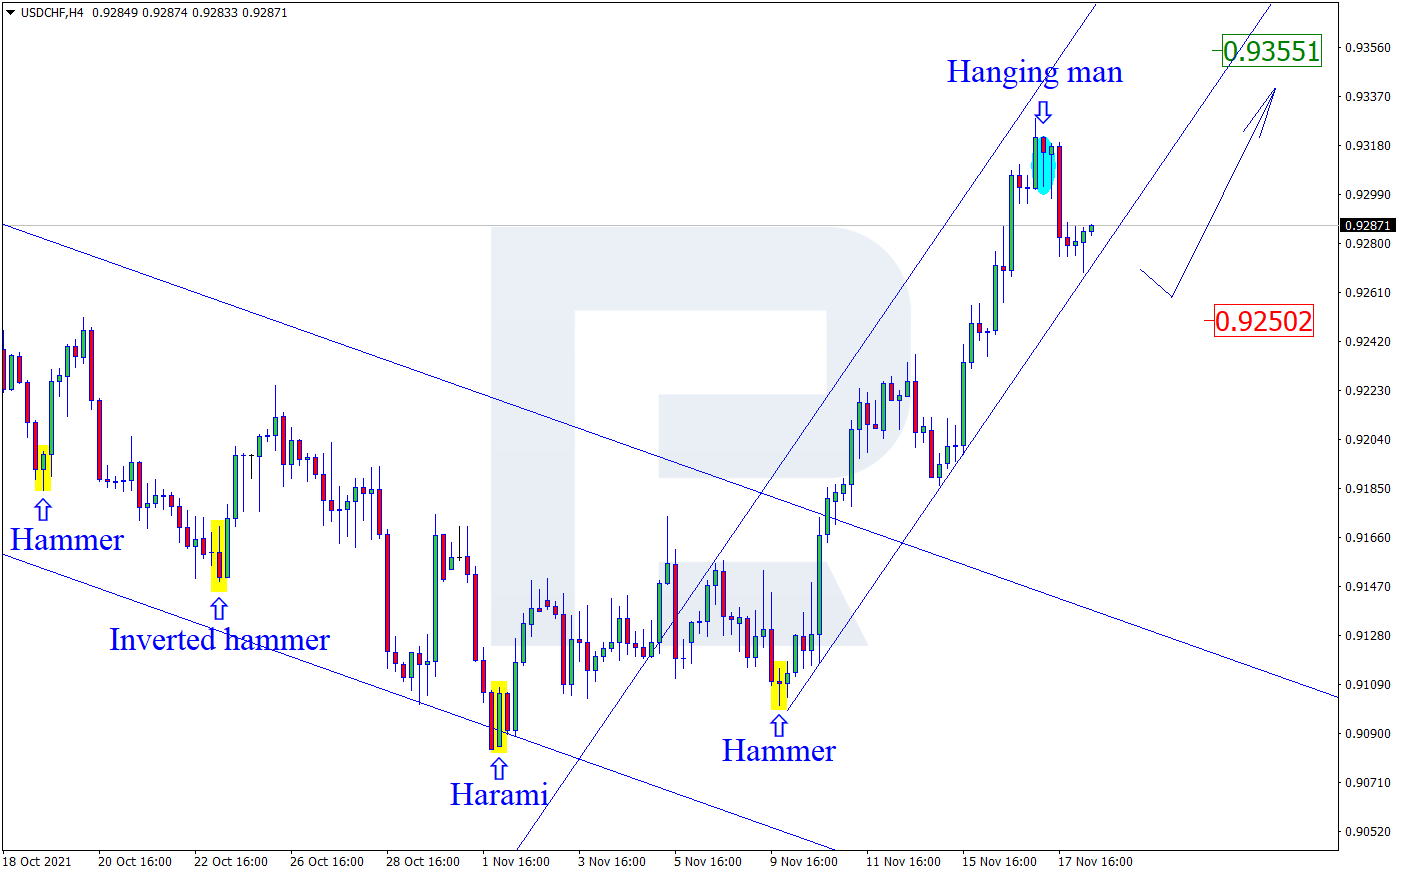
As we can see in the H4 chart, after testing the resistance area, the pair has formed several reversal patterns, for example, Hanging Man. At the moment, USDCHF is reversing in the form of a new correctional wave towards the support level. In this case, the downside target may be at 0.9250. Still, there might be an alternative scenario, according to which the asset may continue growing to reach 0.9355 without testing the support level.
Article By RoboForex.com
Attention!
Forecasts presented in this section only reflect the author’s private opinion and should not be considered as guidance for trading. RoboForex LP bears no responsibility for trading results based on trading recommendations described in these analytical reviews.

- The Central Bank of Mexico kept its interest rate unchanged. Iran plans to introduce strict bans for US and Israeli vessels in the Strait of Hormuz Aug 7, 2026
- USD/JPY Holds Firm: Yen Loses Some Support Aug 7, 2026
- Australian trade balance returned to positive territory Aug 6, 2026
- Results in Line for Most Reporting Companies Aug 5, 2026
- Stock indices continue to break records. Oil is falling amid intensified diplomatic dialogue between the US and Iran Aug 5, 2026
- USD/JPY Holds Steady After Intervention: Outlook Remains Uncertain Aug 5, 2026
- EUR/USD: Busy Week Ahead Aug 3, 2026
- Positive sentiment in the AI sector supported stock indices. Oil prices remain volatile Aug 3, 2026
- The Tech‑heavy NASDAQ Index jumped by more than 3.3%. The offshore yuan is trading at its highest level since 2023 Jul 31, 2026
- USD/JPY After Volatility: Multiple Events in One Day Jul 31, 2026
