
By InvestMacro.com COT Home | Data Tables | Data Downloads | Newsletter
Here are the latest charts and statistics for the Commitment of Traders (COT) data published by the Commodities Futures Trading Commission (CFTC).
The latest COT data is updated through Tuesday September 28th 2021 and shows a quick view of how large traders (for-profit speculators and commercial entities) were positioned in the futures markets.
Highlighting this week’s speculator positioning is a new 3-year high net bullish position in Cotton. Speculators have added to their Cotton bullish bets to highest level since June 12th of 2018 when specs had a total bullish net position of +122,946 contracts. The strength index score for Cotton is also at a 100 percent score, indicating the highest level of bullish spec interest over the past three-year range.
COTTON Futures:
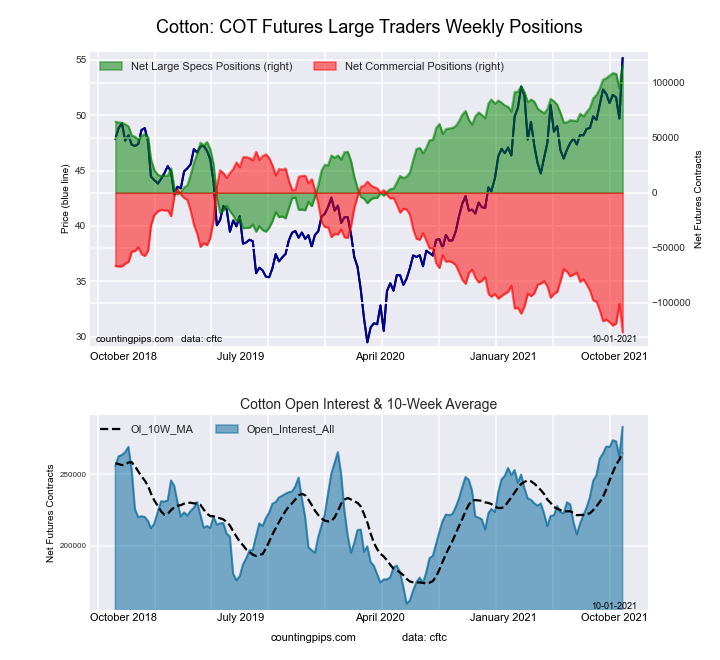 The COTTON large speculator standing this week recorded a net position of 116,132 contracts in the data reported through Tuesday. This was a weekly boost of 21,107 contracts from the previous week which had a total of 95,025 net contracts.
This week’s current strength score (the trader positioning range over the past three years, measured from 0 to 100) shows the speculators are currently Bullish-Extreme with a score of 100.0 percent. The commercials are Bearish-Extreme with a score of 0.0 percent and the small traders (not shown in chart) are Bullish-Extreme with a score of 81.8 percent.
Free Reports:
 Download Our Metatrader 4 Indicators – Put Our Free MetaTrader 4 Custom Indicators on your charts when you join our Weekly Newsletter
 Get our Weekly Commitment of Traders Reports - See where the biggest traders (Hedge Funds and Commercial Hedgers) are positioned in the futures markets on a weekly basis.
| COTTON Futures Statistics | SPECULATORS | COMMERCIALS | SMALL TRADERS |
| – Percent of Open Interest Longs: | 45.3 | 33.8 | 7.2 |
| – Percent of Open Interest Shorts: | 4.4 | 78.6 | 3.4 |
| – Net Position: | 116,132 | -127,066 | 10,934 |
| – Gross Longs: | 128,487 | 95,758 | 20,525 |
| – Gross Shorts: | 12,355 | 222,824 | 9,591 |
| – Long to Short Ratio: | 10.4 to 1 | 0.4 to 1 | 2.1 to 1 |
| NET POSITION TREND: | |||
| – COT Index Score (3 Year Range Pct): | 100.0 | 0.0 | 81.8 |
| – COT Index Reading (3 Year Range): | Bullish-Extreme | Bearish-Extreme | Bullish-Extreme |
| NET POSITION MOVEMENT INDEX: | |||
| – 6-Week Change in Strength Index: | 8.6 | -6.2 | -18.2 |
CORN Futures:
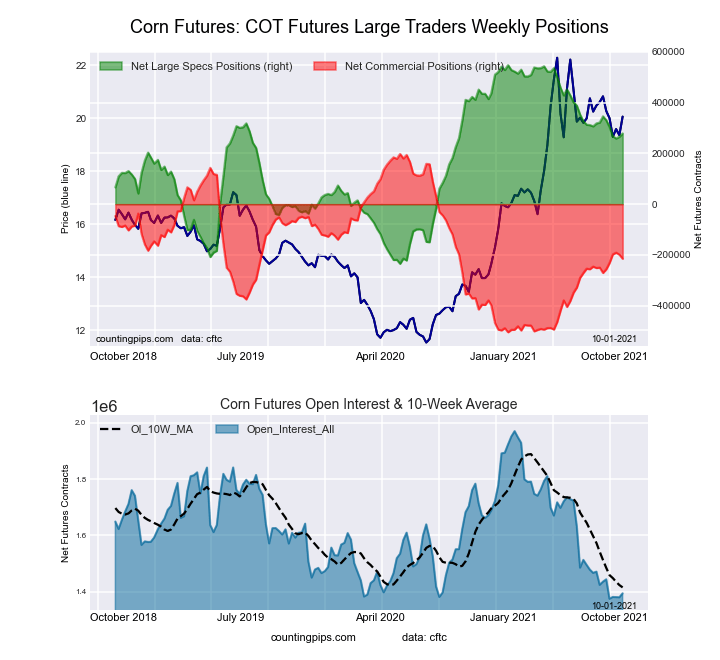 The CORN large speculator standing this week recorded a net position of 278,546 contracts in the data reported through Tuesday. This was a weekly rise of 13,045 contracts from the previous week which had a total of 265,501 net contracts.
This week’s current strength score (the trader positioning range over the past three years, measured from 0 to 100) shows the speculators are currently Bullish with a score of 65.6 percent. The commercials are Bearish with a score of 41.3 percent and the small traders (not shown in chart) are Bearish-Extreme with a score of 6.5 percent.
| CORN Futures Statistics | SPECULATORS | COMMERCIALS | SMALL TRADERS |
| – Percent of Open Interest Longs: | 27.7 | 49.4 | 8.6 |
| – Percent of Open Interest Shorts: | 7.7 | 64.9 | 13.2 |
| – Net Position: | 278,546 | -215,090 | -63,456 |
| – Gross Longs: | 386,177 | 688,955 | 120,051 |
| – Gross Shorts: | 107,631 | 904,045 | 183,507 |
| – Long to Short Ratio: | 3.6 to 1 | 0.8 to 1 | 0.7 to 1 |
| NET POSITION TREND: | |||
| – COT Index Score (3 Year Range Pct): | 65.6 | 41.3 | 6.5 |
| – COT Index Reading (3 Year Range): | Bullish | Bearish | Bearish-Extreme |
| NET POSITION MOVEMENT INDEX: | |||
| – 6-Week Change in Strength Index: | -8.6 | 8.0 | 6.5 |
SUGAR Futures:
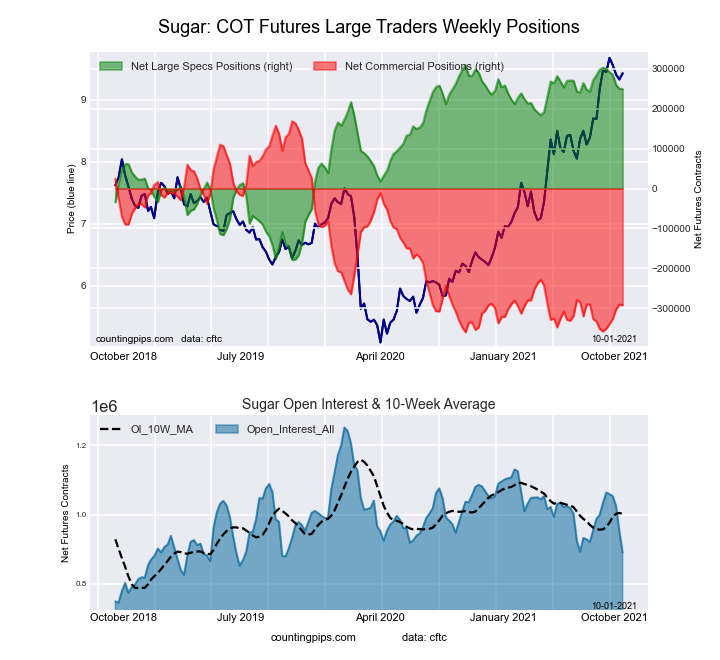 The SUGAR large speculator standing this week recorded a net position of 248,915 contracts in the data reported through Tuesday. This was a weekly decrease of -552 contracts from the previous week which had a total of 249,467 net contracts.
This week’s current strength score (the trader positioning range over the past three years, measured from 0 to 100) shows the speculators are currently Bullish-Extreme with a score of 87.8 percent. The commercials are Bearish-Extreme with a score of 12.9 percent and the small traders (not shown in chart) are Bullish with a score of 60.8 percent.
| SUGAR Futures Statistics | SPECULATORS | COMMERCIALS | SMALL TRADERS |
| – Percent of Open Interest Longs: | 33.4 | 43.0 | 9.5 |
| – Percent of Open Interest Shorts: | 5.4 | 75.8 | 4.7 |
| – Net Position: | 248,915 | -291,724 | 42,809 |
| – Gross Longs: | 297,099 | 382,907 | 84,947 |
| – Gross Shorts: | 48,184 | 674,631 | 42,138 |
| – Long to Short Ratio: | 6.2 to 1 | 0.6 to 1 | 2.0 to 1 |
| NET POSITION TREND: | |||
| – COT Index Score (3 Year Range Pct): | 87.8 | 12.9 | 60.8 |
| – COT Index Reading (3 Year Range): | Bullish-Extreme | Bearish-Extreme | Bullish |
| NET POSITION MOVEMENT INDEX: | |||
| – 6-Week Change in Strength Index: | -11.0 | 12.4 | -15.2 |
COFFEE Futures:
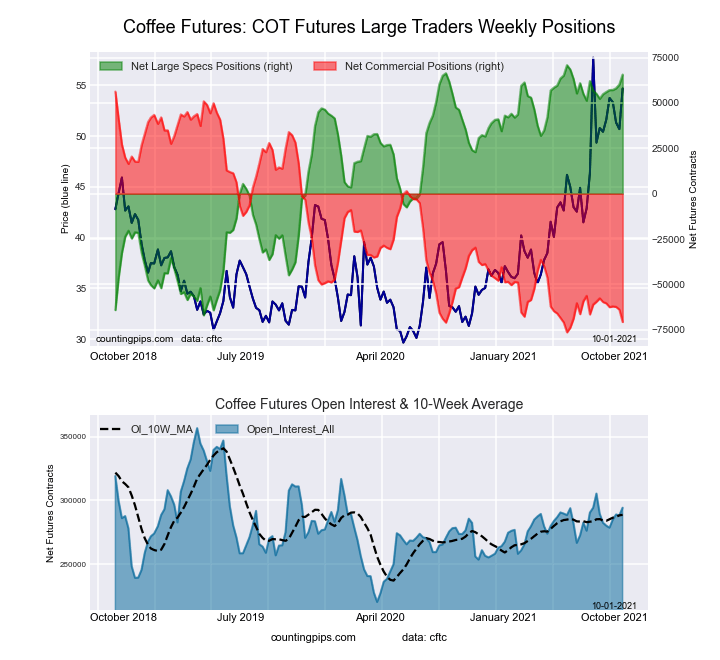 The COFFEE large speculator standing this week recorded a net position of 65,575 contracts in the data reported through Tuesday. This was a weekly advance of 5,457 contracts from the previous week which had a total of 60,118 net contracts.
This week’s current strength score (the trader positioning range over the past three years, measured from 0 to 100) shows the speculators are currently Bullish-Extreme with a score of 96.2 percent. The commercials are Bearish-Extreme with a score of 4.3 percent and the small traders (not shown in chart) are Bearish with a score of 23.5 percent.
| COFFEE Futures Statistics | SPECULATORS | COMMERCIALS | SMALL TRADERS |
| – Percent of Open Interest Longs: | 28.0 | 41.8 | 3.9 |
| – Percent of Open Interest Shorts: | 5.7 | 65.9 | 2.2 |
| – Net Position: | 65,575 | -70,663 | 5,088 |
| – Gross Longs: | 82,278 | 123,137 | 11,533 |
| – Gross Shorts: | 16,703 | 193,800 | 6,445 |
| – Long to Short Ratio: | 4.9 to 1 | 0.6 to 1 | 1.8 to 1 |
| NET POSITION TREND: | |||
| – COT Index Score (3 Year Range Pct): | 96.2 | 4.3 | 23.5 |
| – COT Index Reading (3 Year Range): | Bullish-Extreme | Bearish-Extreme | Bearish |
| NET POSITION MOVEMENT INDEX: | |||
| – 6-Week Change in Strength Index: | 7.8 | -8.3 | 1.7 |
SOYBEANS Futures:
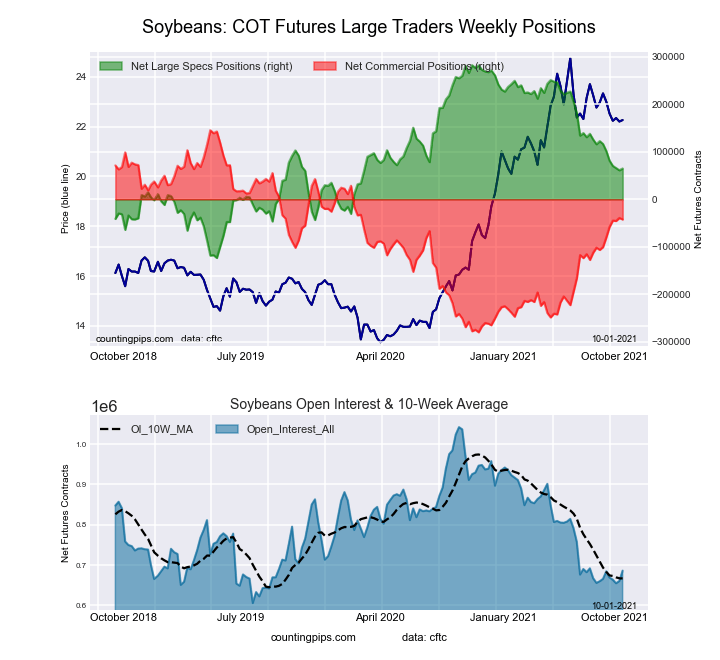 The SOYBEANS large speculator standing this week recorded a net position of 64,720 contracts in the data reported through Tuesday. This was a weekly lift of 3,666 contracts from the previous week which had a total of 61,054 net contracts.
This week’s current strength score (the trader positioning range over the past three years, measured from 0 to 100) shows the speculators are currently Bearish with a score of 46.4 percent. The commercials are Bullish with a score of 55.8 percent and the small traders (not shown in chart) are Bearish with a score of 35.0 percent.
| SOYBEANS Futures Statistics | SPECULATORS | COMMERCIALS | SMALL TRADERS |
| – Percent of Open Interest Longs: | 20.6 | 56.9 | 7.1 |
| – Percent of Open Interest Shorts: | 11.1 | 63.1 | 10.4 |
| – Net Position: | 64,720 | -42,564 | -22,156 |
| – Gross Longs: | 141,105 | 390,372 | 49,015 |
| – Gross Shorts: | 76,385 | 432,936 | 71,171 |
| – Long to Short Ratio: | 1.8 to 1 | 0.9 to 1 | 0.7 to 1 |
| NET POSITION TREND: | |||
| – COT Index Score (3 Year Range Pct): | 46.4 | 55.8 | 35.0 |
| – COT Index Reading (3 Year Range): | Bearish | Bullish | Bearish |
| NET POSITION MOVEMENT INDEX: | |||
| – 6-Week Change in Strength Index: | -12.7 | 13.7 | -10.5 |
SOYBEAN MEAL Futures:
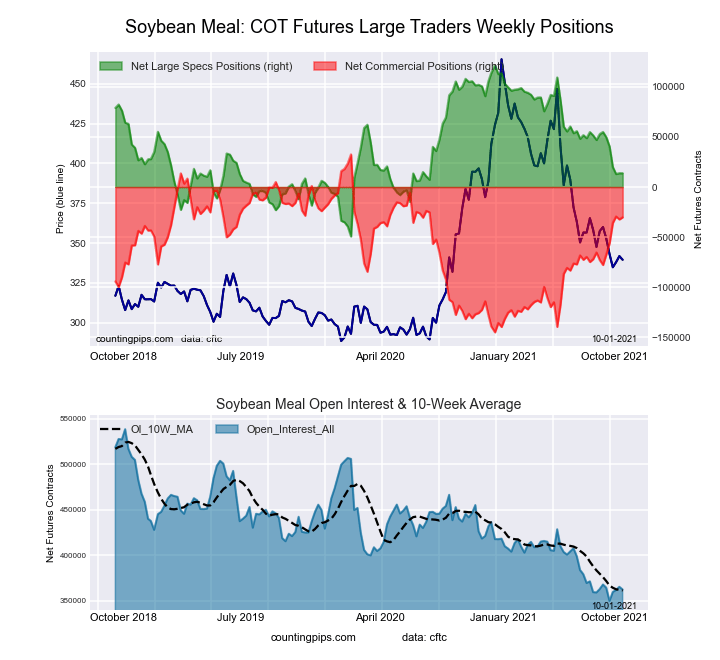 The SOYBEAN MEAL large speculator standing this week recorded a net position of 13,799 contracts in the data reported through Tuesday. This was a weekly reduction of -11 contracts from the previous week which had a total of 13,810 net contracts.
This week’s current strength score (the trader positioning range over the past three years, measured from 0 to 100) shows the speculators are currently Bearish with a score of 36.9 percent. The commercials are Bullish with a score of 64.6 percent and the small traders (not shown in chart) are Bearish with a score of 36.7 percent.
| SOYBEAN MEAL Futures Statistics | SPECULATORS | COMMERCIALS | SMALL TRADERS |
| – Percent of Open Interest Longs: | 21.5 | 49.1 | 12.2 |
| – Percent of Open Interest Shorts: | 17.7 | 57.4 | 7.6 |
| – Net Position: | 13,799 | -30,286 | 16,487 |
| – Gross Longs: | 77,998 | 177,632 | 44,078 |
| – Gross Shorts: | 64,199 | 207,918 | 27,591 |
| – Long to Short Ratio: | 1.2 to 1 | 0.9 to 1 | 1.6 to 1 |
| NET POSITION TREND: | |||
| – COT Index Score (3 Year Range Pct): | 36.9 | 64.6 | 36.7 |
| – COT Index Reading (3 Year Range): | Bearish | Bullish | Bearish |
| NET POSITION MOVEMENT INDEX: | |||
| – 6-Week Change in Strength Index: | -24.1 | 26.8 | -25.5 |
LIVE CATTLE Futures:
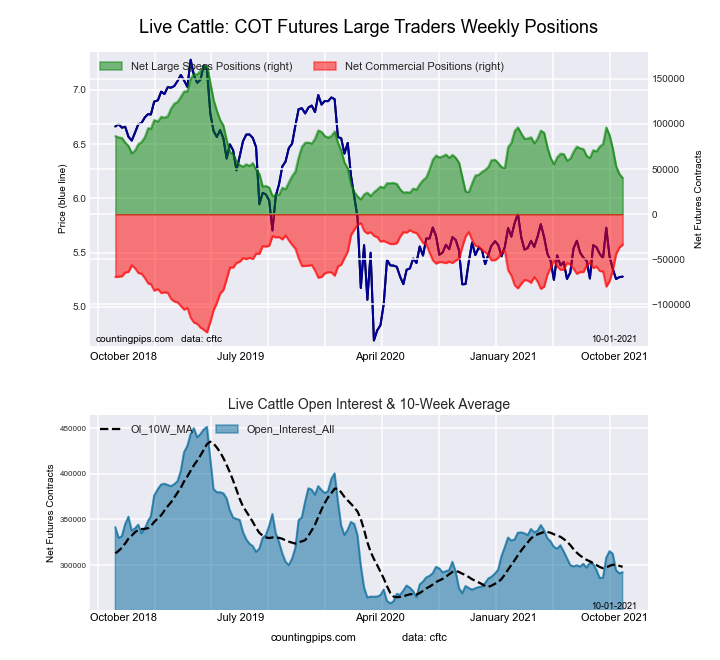 The LIVE CATTLE large speculator standing this week recorded a net position of 40,163 contracts in the data reported through Tuesday. This was a weekly decline of -4,393 contracts from the previous week which had a total of 44,556 net contracts.
This week’s current strength score (the trader positioning range over the past three years, measured from 0 to 100) shows the speculators are currently Bearish-Extreme with a score of 16.0 percent. The commercials are Bullish-Extreme with a score of 80.2 percent and the small traders (not shown in chart) are Bullish with a score of 71.5 percent.
| LIVE CATTLE Futures Statistics | SPECULATORS | COMMERCIALS | SMALL TRADERS |
| – Percent of Open Interest Longs: | 31.7 | 43.5 | 10.6 |
| – Percent of Open Interest Shorts: | 17.9 | 55.1 | 12.8 |
| – Net Position: | 40,163 | -33,747 | -6,416 |
| – Gross Longs: | 92,493 | 127,134 | 31,023 |
| – Gross Shorts: | 52,330 | 160,881 | 37,439 |
| – Long to Short Ratio: | 1.8 to 1 | 0.8 to 1 | 0.8 to 1 |
| NET POSITION TREND: | |||
| – COT Index Score (3 Year Range Pct): | 16.0 | 80.2 | 71.5 |
| – COT Index Reading (3 Year Range): | Bearish-Extreme | Bullish-Extreme | Bullish |
| NET POSITION MOVEMENT INDEX: | |||
| – 6-Week Change in Strength Index: | -25.3 | 24.6 | 19.3 |
LEAN HOGS Futures:
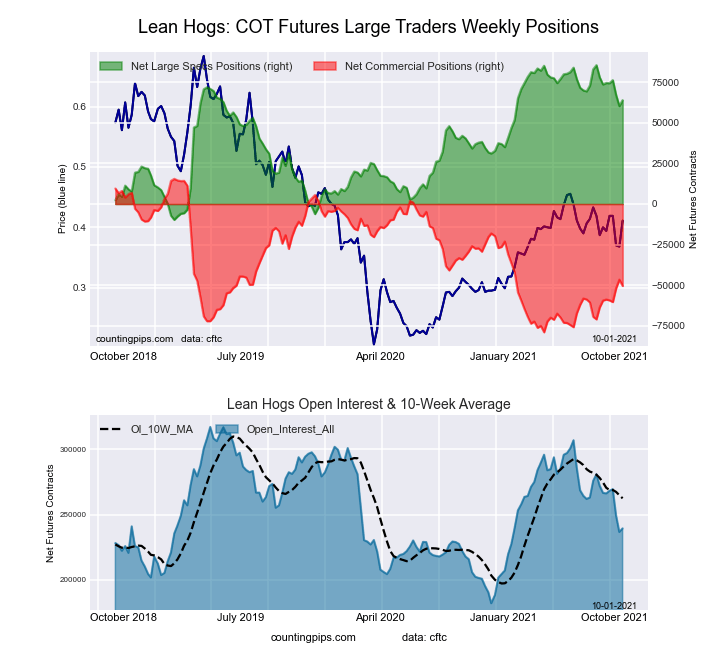 The LEAN HOGS large speculator standing this week recorded a net position of 64,023 contracts in the data reported through Tuesday. This was a weekly increase of 3,660 contracts from the previous week which had a total of 60,363 net contracts.
This week’s current strength score (the trader positioning range over the past three years, measured from 0 to 100) shows the speculators are currently Bullish with a score of 77.4 percent. The commercials are Bearish with a score of 30.2 percent and the small traders (not shown in chart) are Bearish-Extreme with a score of 14.0 percent.
| LEAN HOGS Futures Statistics | SPECULATORS | COMMERCIALS | SMALL TRADERS |
| – Percent of Open Interest Longs: | 42.4 | 32.1 | 7.8 |
| – Percent of Open Interest Shorts: | 15.6 | 53.2 | 13.4 |
| – Net Position: | 64,023 | -50,557 | -13,466 |
| – Gross Longs: | 101,460 | 76,873 | 18,690 |
| – Gross Shorts: | 37,437 | 127,430 | 32,156 |
| – Long to Short Ratio: | 2.7 to 1 | 0.6 to 1 | 0.6 to 1 |
| NET POSITION TREND: | |||
| – COT Index Score (3 Year Range Pct): | 77.4 | 30.2 | 14.0 |
| – COT Index Reading (3 Year Range): | Bullish | Bearish | Bearish-Extreme |
| NET POSITION MOVEMENT INDEX: | |||
| – 6-Week Change in Strength Index: | -10.2 | 9.5 | 3.2 |
COCOA Futures:
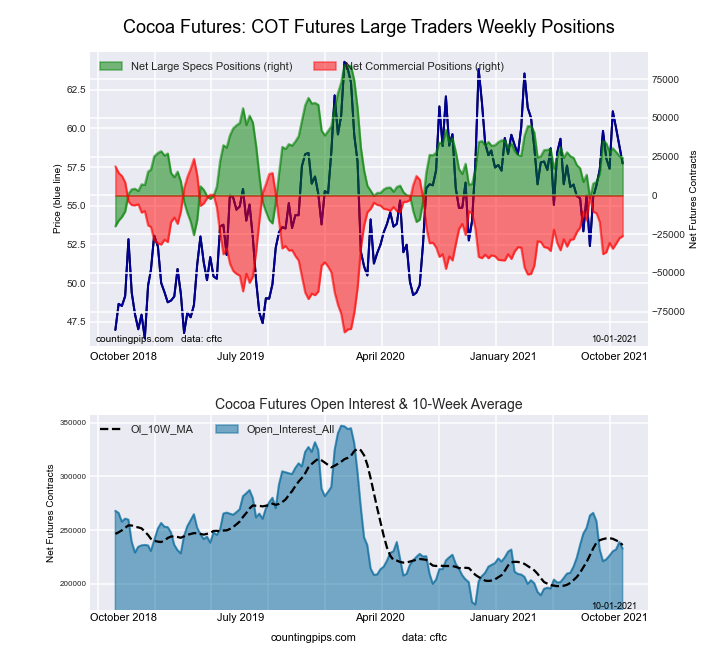 The COCOA large speculator standing this week recorded a net position of 24,276 contracts in the data reported through Tuesday. This was a weekly decline of -1,163 contracts from the previous week which had a total of 25,439 net contracts.
This week’s current strength score (the trader positioning range over the past three years, measured from 0 to 100) shows the speculators are currently Bearish with a score of 45.5 percent. The commercials are Bullish with a score of 55.5 percent and the small traders (not shown in chart) are Bearish with a score of 30.3 percent.
| COCOA Futures Statistics | SPECULATORS | COMMERCIALS | SMALL TRADERS |
| – Percent of Open Interest Longs: | 28.4 | 53.6 | 4.2 |
| – Percent of Open Interest Shorts: | 17.9 | 64.9 | 3.4 |
| – Net Position: | 24,276 | -26,194 | 1,918 |
| – Gross Longs: | 65,973 | 124,722 | 9,712 |
| – Gross Shorts: | 41,697 | 150,916 | 7,794 |
| – Long to Short Ratio: | 1.6 to 1 | 0.8 to 1 | 1.2 to 1 |
| NET POSITION TREND: | |||
| – COT Index Score (3 Year Range Pct): | 45.5 | 55.5 | 30.3 |
| – COT Index Reading (3 Year Range): | Bearish | Bullish | Bearish |
| NET POSITION MOVEMENT INDEX: | |||
| – 6-Week Change in Strength Index: | -10.0 | 10.4 | -8.0 |
WHEAT Futures:
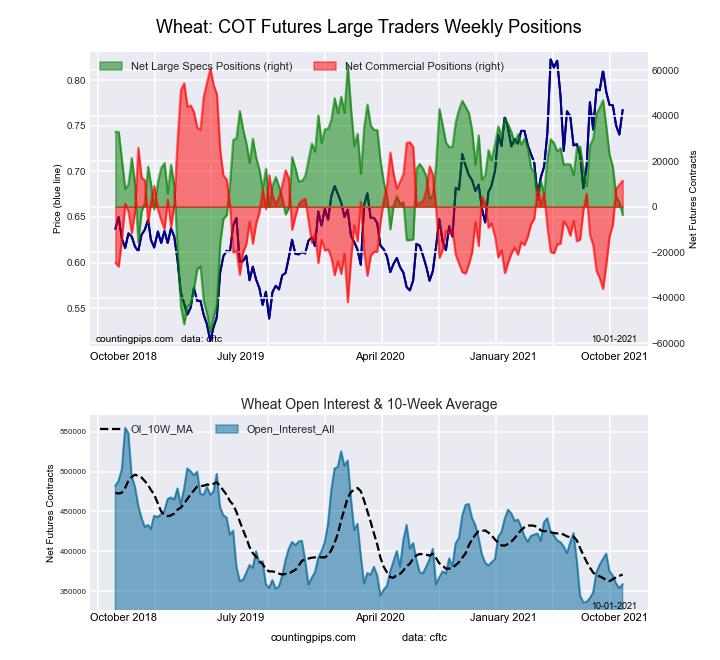 The WHEAT large speculator standing this week recorded a net position of -3,645 contracts in the data reported through Tuesday. This was a weekly decrease of -5,487 contracts from the previous week which had a total of 1,842 net contracts.
This week’s current strength score (the trader positioning range over the past three years, measured from 0 to 100) shows the speculators are currently Bearish with a score of 43.9 percent. The commercials are Bullish with a score of 52.0 percent and the small traders (not shown in chart) are Bullish with a score of 64.1 percent.
| WHEAT Futures Statistics | SPECULATORS | COMMERCIALS | SMALL TRADERS |
| – Percent of Open Interest Longs: | 23.7 | 44.1 | 8.4 |
| – Percent of Open Interest Shorts: | 24.7 | 40.9 | 10.6 |
| – Net Position: | -3,645 | 11,488 | -7,843 |
| – Gross Longs: | 84,860 | 158,150 | 30,206 |
| – Gross Shorts: | 88,505 | 146,662 | 38,049 |
| – Long to Short Ratio: | 1.0 to 1 | 1.1 to 1 | 0.8 to 1 |
| NET POSITION TREND: | |||
| – COT Index Score (3 Year Range Pct): | 43.9 | 52.0 | 64.1 |
| – COT Index Reading (3 Year Range): | Bearish | Bullish | Bullish |
| NET POSITION MOVEMENT INDEX: | |||
| – 6-Week Change in Strength Index: | -43.0 | 46.3 | 13.7 |
Article By InvestMacro.com – Receive our weekly COT Reports by Email
*COT Report: The COT data, released weekly to the public each Friday, is updated through the most recent Tuesday (data is 3 days old) and shows a quick view of how large speculators or non-commercials (for-profit traders) were positioned in the futures markets. Open interest indicates the number of currently open (at time of data collection) contracts still in the markets.
The CFTC categorizes trader positions according to commercial hedgers (traders who use futures contracts for hedging as part of the business), non-commercials (large traders who speculate to realize trading profits) and nonreportable traders (usually small traders/speculators).
Find CFTC criteria here: (http://www.cftc.gov/MarketReports/CommitmentsofTraders/ExplanatoryNotes/index.htm).

- COT Metals Charts: Weekly Speculator Bets led by Copper & Steel Jul 18, 2026
- COT Bonds Charts: Weekly Speculator Bets led by 2-Year, SOFR 3M & 5-Year Bonds Jul 18, 2026
- COT Energy Charts: Weekly Speculator Bets led by Brent Oil & Heating Oil Jul 18, 2026
- COT Soft Commodities Charts: Weekly Speculator Bets led by Wheat, Corn & Soybean Meal Jul 18, 2026
- The Bank of Canada kept its interest rate unchanged. Platinum prices reached a three‑week high Jul 16, 2026
- Stock indices rose after the release of US inflation data. China’s GDP slowed sharply Jul 15, 2026
- GBP/USD Awaits Political News: What Will Happen Next Jul 15, 2026
- USD/JPY Holds at Highs: Pressure Lingers on Yen Jul 14, 2026
- Oil prices jumped 4% amid a new wave of escalation between the US and Iran Jul 13, 2026
- EUR/USD: US Inflation Will Determine Everything Jul 13, 2026