By InvestMacro.com COT Home | Data Tables | Data Downloads | Newsletter
Here are the latest charts and statistics for the Commitment of Traders (COT) data published by the Commodities Futures Trading Commission (CFTC).
The latest COT data is updated through Tuesday October 26th 2021 and shows a quick view of how large traders (for-profit speculators and commercial entities) were positioned in the futures markets. All the currencies are in direct relation to the US dollar where, for example, a bet for the euro is a bet that the euro will rise versus the dollar while a bet against the euro will be a bet that the euro will decline versus the dollar.
Highlighting this week’s COT Currency data is the speculator’s British pound sterling bullish bets which have ascended to their highest level since July. Speculator net positions increased for a third consecutive week (total of +34,971 contracts) this week and jumped by over +13,000 contracts for a second straight week.
Net positioning had been bearish over the preceding thirteen weeks, falling by a total of -79,176 contracts over that period and declining for nine out of those thirteen weeks. Speculator bearish bets hit a 58-week bearish low-point on September 7th before turning sharply higher (+29,314 contracts) the next week on September 14th.
The recent increases in speculator sentiment has pushed the GBP net contracts to over a three-month high, dating back to July 6th when net positions totaled 21,903 contracts.
Free Reports:
 Sign Up for Our Stock Market Newsletter – Get updated on News, Charts & Rankings of Public Companies when you join our Stocks Newsletter
 Get our Weekly Commitment of Traders Reports - See where the biggest traders (Hedge Funds and Commercial Hedgers) are positioned in the futures markets on a weekly basis.
Oct-26-2021 | OI | OI-Index | Spec-Net | Spec-Index | Com-Net | COM-Index | Smalls-Net | Smalls-Index |
|---|---|---|---|---|---|---|---|---|
| EUR | 680,374 | 76 | -11,256 | 32 | -16,255 | 71 | 27,511 | 24 |
| JPY | 265,254 | 99 | -107,036 | 2 | 128,546 | 100 | -21,510 | 6 |
| MXN | 162,542 | 30 | -43,289 | 0 | 40,166 | 100 | 3,123 | 56 |
| AUD | 160,011 | 52 | -75,246 | 14 | 76,399 | 76 | -1,153 | 50 |
| CAD | 159,475 | 37 | 3,320 | 58 | -26,629 | 35 | 23,309 | 82 |
| GBP | 156,495 | 11 | 14,953 | 85 | -13,660 | 22 | -1,293 | 53 |
| USD Index | 58,993 | 87 | 34,457 | 85 | -41,942 | 5 | 7,485 | 98 |
| CHF | 54,305 | 34 | -19,379 | 36 | 32,362 | 67 | -12,983 | 25 |
| RUB | 53,374 | 59 | 21,462 | 64 | -23,728 | 31 | 2,266 | 96 |
| BRL | 46,073 | 55 | -942 | 67 | 463 | 34 | 479 | 73 |
| NZD | 43,061 | 30 | 8,906 | 86 | -11,474 | 13 | 2,568 | 81 |
| Bitcoin | 16,671 | 100 | -4,412 | 0 | 583 | 0 | 3,829 | 100 |
US Dollar Index Futures:
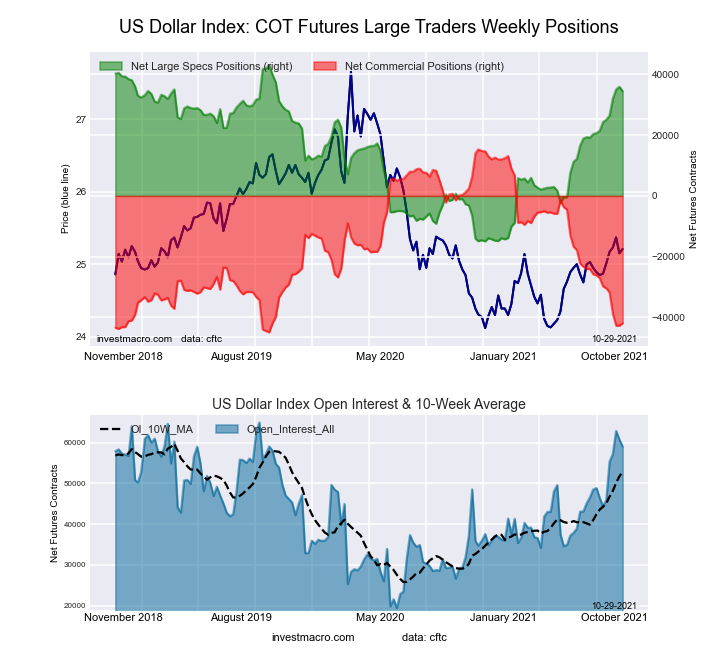 The US Dollar Index large speculator standing this week totaled a net position of 34,457 contracts in the data reported through Tuesday. This was a weekly decline of -1,477 contracts from the previous week which had a total of 35,934 net contracts.
This week’s current strength score (the trader positioning range over the past three years, measured from 0 to 100) shows the speculators are currently Bullish-Extreme with a score of 85.2 percent. The commercials are Bearish-Extreme with a score of 4.9 percent and the small traders (not shown in chart) are Bullish-Extreme with a score of 98.4 percent.
| US DOLLAR INDEX Statistics | SPECULATORS | COMMERCIALS | SMALL TRADERS |
| – Percent of Open Interest Longs: | 76.6 | 3.7 | 15.6 |
| – Percent of Open Interest Shorts: | 18.2 | 74.8 | 2.9 |
| – Net Position: | 34,457 | -41,942 | 7,485 |
| – Gross Longs: | 45,189 | 2,157 | 9,212 |
| – Gross Shorts: | 10,732 | 44,099 | 1,727 |
| – Long to Short Ratio: | 4.2 to 1 | 0.0 to 1 | 5.3 to 1 |
| NET POSITION TREND: | |||
| – COT Index Score (3 Year Range Pct): | 85.2 | 4.9 | 98.4 |
| – COT Index Reading (3 Year Range): | Bullish-Extreme | Bearish-Extreme | Bullish-Extreme |
| NET POSITION MOVEMENT INDEX: | |||
| – 6-Week Change in Strength Index: | 17.6 | -20.2 | 21.7 |
Euro Currency Futures:
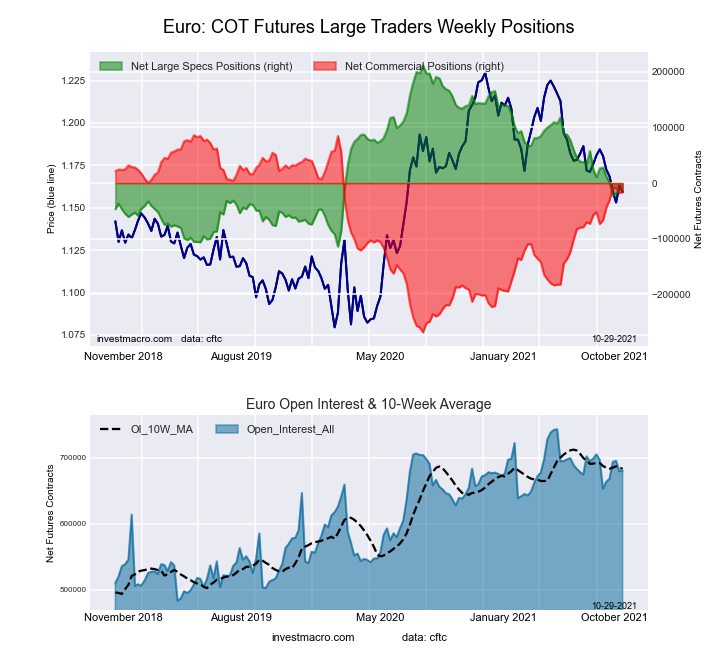 The Euro Currency large speculator standing this week totaled a net position of -11,256 contracts in the data reported through Tuesday. This was a weekly increase of 851 contracts from the previous week which had a total of -12,107 net contracts.
This week’s current strength score (the trader positioning range over the past three years, measured from 0 to 100) shows the speculators are currently Bearish with a score of 31.5 percent. The commercials are Bullish with a score of 71.1 percent and the small traders (not shown in chart) are Bearish with a score of 23.5 percent.
| EURO Currency Statistics | SPECULATORS | COMMERCIALS | SMALL TRADERS |
| – Percent of Open Interest Longs: | 28.9 | 57.0 | 12.7 |
| – Percent of Open Interest Shorts: | 30.6 | 59.4 | 8.7 |
| – Net Position: | -11,256 | -16,255 | 27,511 |
| – Gross Longs: | 196,880 | 387,905 | 86,683 |
| – Gross Shorts: | 208,136 | 404,160 | 59,172 |
| – Long to Short Ratio: | 0.9 to 1 | 1.0 to 1 | 1.5 to 1 |
| NET POSITION TREND: | |||
| – COT Index Score (3 Year Range Pct): | 31.5 | 71.1 | 23.5 |
| – COT Index Reading (3 Year Range): | Bearish | Bullish | Bearish |
| NET POSITION MOVEMENT INDEX: | |||
| – 6-Week Change in Strength Index: | -12.0 | 14.1 | -17.3 |
British Pound Sterling Futures:
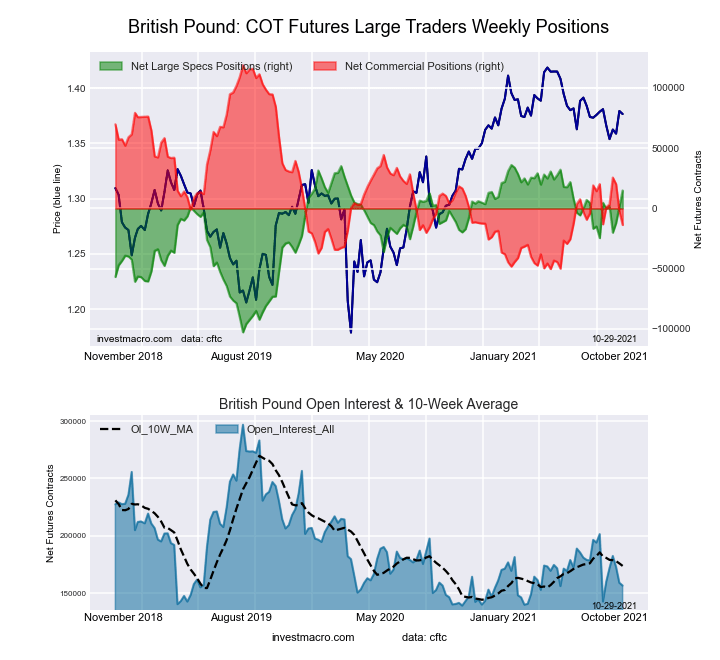 The British Pound Sterling large speculator standing this week totaled a net position of 14,953 contracts in the data reported through Tuesday. This was a weekly gain of 13,338 contracts from the previous week which had a total of 1,615 net contracts.
This week’s current strength score (the trader positioning range over the past three years, measured from 0 to 100) shows the speculators are currently Bullish-Extreme with a score of 84.8 percent. The commercials are Bearish with a score of 21.6 percent and the small traders (not shown in chart) are Bullish with a score of 53.0 percent.
| BRITISH POUND Statistics | SPECULATORS | COMMERCIALS | SMALL TRADERS |
| – Percent of Open Interest Longs: | 33.2 | 47.7 | 17.5 |
| – Percent of Open Interest Shorts: | 23.6 | 56.5 | 18.4 |
| – Net Position: | 14,953 | -13,660 | -1,293 |
| – Gross Longs: | 51,912 | 74,688 | 27,446 |
| – Gross Shorts: | 36,959 | 88,348 | 28,739 |
| – Long to Short Ratio: | 1.4 to 1 | 0.8 to 1 | 1.0 to 1 |
| NET POSITION TREND: | |||
| – COT Index Score (3 Year Range Pct): | 84.8 | 21.6 | 53.0 |
| – COT Index Reading (3 Year Range): | Bullish-Extreme | Bearish | Bullish |
| NET POSITION MOVEMENT INDEX: | |||
| – 6-Week Change in Strength Index: | 7.3 | -0.3 | -19.9 |
Japanese Yen Futures:
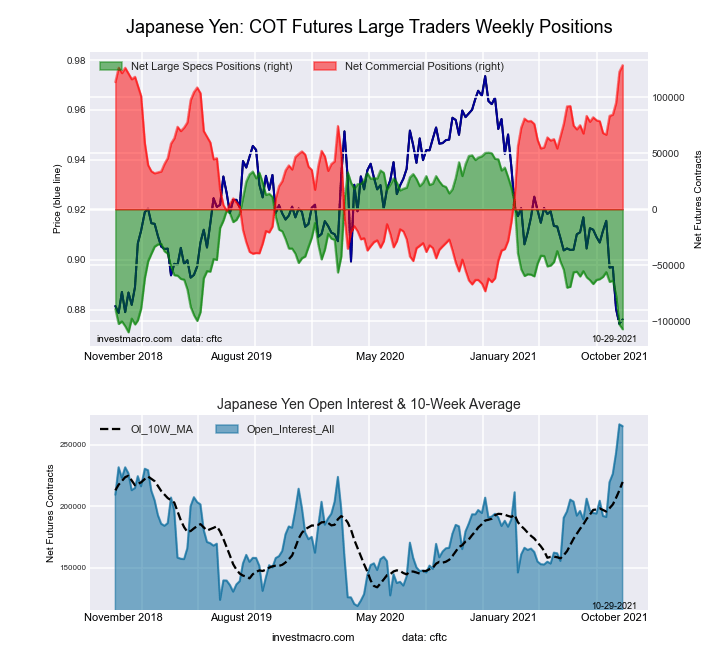 The Japanese Yen large speculator standing this week totaled a net position of -107,036 contracts in the data reported through Tuesday. This was a weekly decline of -4,302 contracts from the previous week which had a total of -102,734 net contracts.
This week’s current strength score (the trader positioning range over the past three years, measured from 0 to 100) shows the speculators are currently Bearish-Extreme with a score of 1.7 percent. The commercials are Bullish-Extreme with a score of 100.0 percent and the small traders (not shown in chart) are Bearish-Extreme with a score of 5.9 percent.
| JAPANESE YEN Statistics | SPECULATORS | COMMERCIALS | SMALL TRADERS |
| – Percent of Open Interest Longs: | 11.9 | 80.0 | 7.3 |
| – Percent of Open Interest Shorts: | 52.2 | 31.6 | 15.4 |
| – Net Position: | -107,036 | 128,546 | -21,510 |
| – Gross Longs: | 31,487 | 212,303 | 19,254 |
| – Gross Shorts: | 138,523 | 83,757 | 40,764 |
| – Long to Short Ratio: | 0.2 to 1 | 2.5 to 1 | 0.5 to 1 |
| NET POSITION TREND: | |||
| – COT Index Score (3 Year Range Pct): | 1.7 | 100.0 | 5.9 |
| – COT Index Reading (3 Year Range): | Bearish-Extreme | Bullish-Extreme | Bearish-Extreme |
| NET POSITION MOVEMENT INDEX: | |||
| – 6-Week Change in Strength Index: | -29.2 | 30.0 | -29.1 |
Swiss Franc Futures:
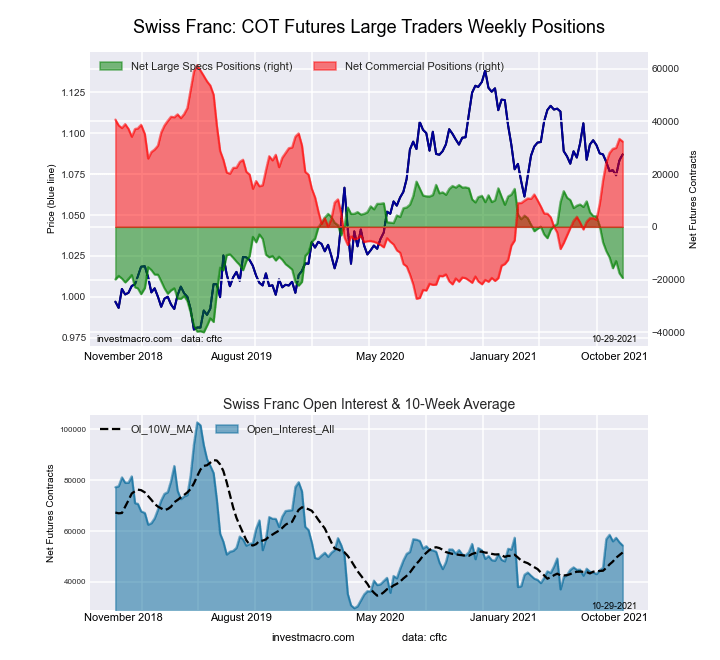 The Swiss Franc large speculator standing this week totaled a net position of -19,379 contracts in the data reported through Tuesday. This was a weekly fall of -1,795 contracts from the previous week which had a total of -17,584 net contracts.
This week’s current strength score (the trader positioning range over the past three years, measured from 0 to 100) shows the speculators are currently Bearish with a score of 36.1 percent. The commercials are Bullish with a score of 67.3 percent and the small traders (not shown in chart) are Bearish with a score of 25.2 percent.
| SWISS FRANC Statistics | SPECULATORS | COMMERCIALS | SMALL TRADERS |
| – Percent of Open Interest Longs: | 2.3 | 79.8 | 17.2 |
| – Percent of Open Interest Shorts: | 38.0 | 20.2 | 41.1 |
| – Net Position: | -19,379 | 32,362 | -12,983 |
| – Gross Longs: | 1,246 | 43,355 | 9,360 |
| – Gross Shorts: | 20,625 | 10,993 | 22,343 |
| – Long to Short Ratio: | 0.1 to 1 | 3.9 to 1 | 0.4 to 1 |
| NET POSITION TREND: | |||
| – COT Index Score (3 Year Range Pct): | 36.1 | 67.3 | 25.2 |
| – COT Index Reading (3 Year Range): | Bearish | Bullish | Bearish |
| NET POSITION MOVEMENT INDEX: | |||
| – 6-Week Change in Strength Index: | -23.6 | 16.7 | -3.8 |
Canadian Dollar Futures:
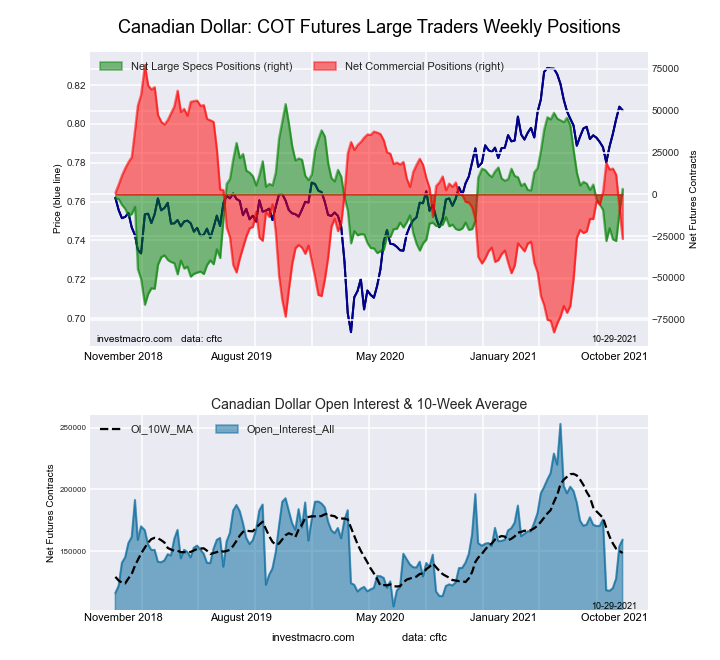 The Canadian Dollar large speculator standing this week totaled a net position of 3,320 contracts in the data reported through Tuesday. This was a weekly boost of 14,244 contracts from the previous week which had a total of -10,924 net contracts.
This week’s current strength score (the trader positioning range over the past three years, measured from 0 to 100) shows the speculators are currently Bullish with a score of 57.8 percent. The commercials are Bearish with a score of 35.0 percent and the small traders (not shown in chart) are Bullish-Extreme with a score of 82.0 percent.
| CANADIAN DOLLAR Statistics | SPECULATORS | COMMERCIALS | SMALL TRADERS |
| – Percent of Open Interest Longs: | 28.8 | 43.8 | 26.4 |
| – Percent of Open Interest Shorts: | 26.7 | 60.5 | 11.8 |
| – Net Position: | 3,320 | -26,629 | 23,309 |
| – Gross Longs: | 45,977 | 69,913 | 42,129 |
| – Gross Shorts: | 42,657 | 96,542 | 18,820 |
| – Long to Short Ratio: | 1.1 to 1 | 0.7 to 1 | 2.2 to 1 |
| NET POSITION TREND: | |||
| – COT Index Score (3 Year Range Pct): | 57.8 | 35.0 | 82.0 |
| – COT Index Reading (3 Year Range): | Bullish | Bearish | Bullish-Extreme |
| NET POSITION MOVEMENT INDEX: | |||
| – 6-Week Change in Strength Index: | 10.5 | -17.6 | 23.3 |
Australian Dollar Futures:
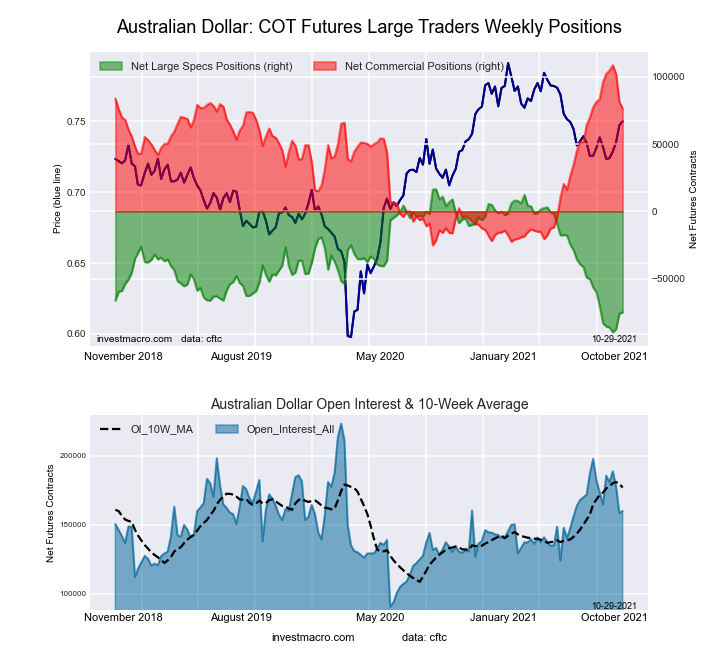 The Australian Dollar large speculator standing this week totaled a net position of -75,246 contracts in the data reported through Tuesday. This was a weekly increase of 812 contracts from the previous week which had a total of -76,058 net contracts.
This week’s current strength score (the trader positioning range over the past three years, measured from 0 to 100) shows the speculators are currently Bearish-Extreme with a score of 13.9 percent. The commercials are Bullish with a score of 75.9 percent and the small traders (not shown in chart) are Bearish with a score of 49.6 percent.
| AUSTRALIAN DOLLAR Statistics | SPECULATORS | COMMERCIALS | SMALL TRADERS |
| – Percent of Open Interest Longs: | 10.9 | 73.5 | 14.0 |
| – Percent of Open Interest Shorts: | 57.9 | 25.8 | 14.7 |
| – Net Position: | -75,246 | 76,399 | -1,153 |
| – Gross Longs: | 17,448 | 117,662 | 22,432 |
| – Gross Shorts: | 92,694 | 41,263 | 23,585 |
| – Long to Short Ratio: | 0.2 to 1 | 2.9 to 1 | 1.0 to 1 |
| NET POSITION TREND: | |||
| – COT Index Score (3 Year Range Pct): | 13.9 | 75.9 | 49.6 |
| – COT Index Reading (3 Year Range): | Bearish-Extreme | Bullish | Bearish |
| NET POSITION MOVEMENT INDEX: | |||
| – 6-Week Change in Strength Index: | 7.7 | -14.7 | 28.0 |
New Zealand Dollar Futures:
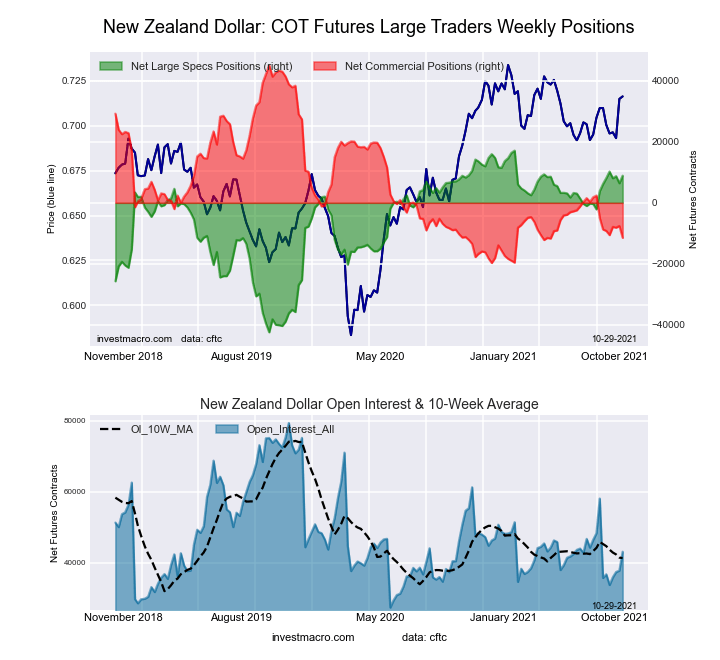 The New Zealand Dollar large speculator standing this week totaled a net position of 8,906 contracts in the data reported through Tuesday. This was a weekly rise of 2,466 contracts from the previous week which had a total of 6,440 net contracts.
This week’s current strength score (the trader positioning range over the past three years, measured from 0 to 100) shows the speculators are currently Bullish-Extreme with a score of 86.2 percent. The commercials are Bearish-Extreme with a score of 12.7 percent and the small traders (not shown in chart) are Bullish-Extreme with a score of 81.2 percent.
| NEW ZEALAND DOLLAR Statistics | SPECULATORS | COMMERCIALS | SMALL TRADERS |
| – Percent of Open Interest Longs: | 56.9 | 26.3 | 13.5 |
| – Percent of Open Interest Shorts: | 36.2 | 52.9 | 7.5 |
| – Net Position: | 8,906 | -11,474 | 2,568 |
| – Gross Longs: | 24,490 | 11,307 | 5,819 |
| – Gross Shorts: | 15,584 | 22,781 | 3,251 |
| – Long to Short Ratio: | 1.6 to 1 | 0.5 to 1 | 1.8 to 1 |
| NET POSITION TREND: | |||
| – COT Index Score (3 Year Range Pct): | 86.2 | 12.7 | 81.2 |
| – COT Index Reading (3 Year Range): | Bullish-Extreme | Bearish-Extreme | Bullish-Extreme |
| NET POSITION MOVEMENT INDEX: | |||
| – 6-Week Change in Strength Index: | 4.5 | -4.2 | 0.2 |
Mexican Peso Futures:
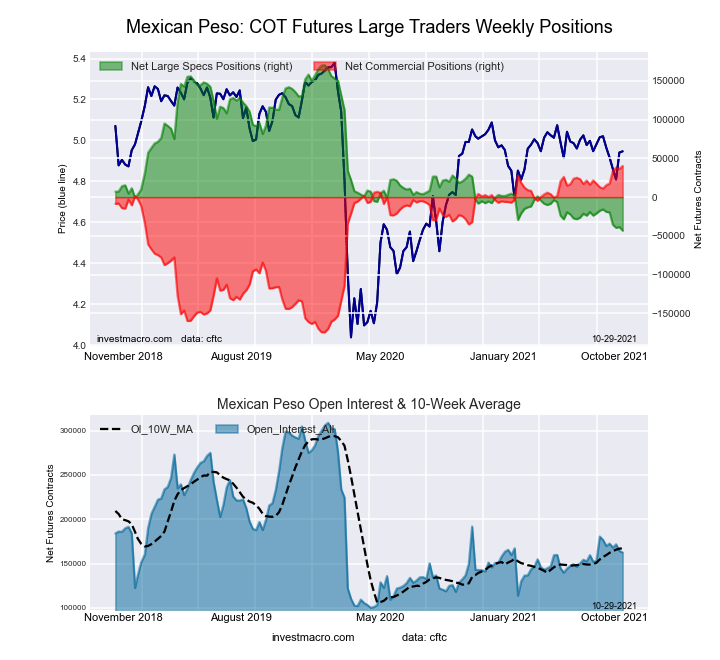 The Mexican Peso large speculator standing this week totaled a net position of -43,289 contracts in the data reported through Tuesday. This was a weekly reduction of -4,718 contracts from the previous week which had a total of -38,571 net contracts.
This week’s current strength score (the trader positioning range over the past three years, measured from 0 to 100) shows the speculators are currently Bearish-Extreme with a score of 0.0 percent. The commercials are Bullish-Extreme with a score of 100.0 percent and the small traders (not shown in chart) are Bullish with a score of 56.3 percent.
| MEXICAN PESO Statistics | SPECULATORS | COMMERCIALS | SMALL TRADERS |
| – Percent of Open Interest Longs: | 39.2 | 55.9 | 4.2 |
| – Percent of Open Interest Shorts: | 65.8 | 31.2 | 2.2 |
| – Net Position: | -43,289 | 40,166 | 3,123 |
| – Gross Longs: | 63,677 | 90,904 | 6,749 |
| – Gross Shorts: | 106,966 | 50,738 | 3,626 |
| – Long to Short Ratio: | 0.6 to 1 | 1.8 to 1 | 1.9 to 1 |
| NET POSITION TREND: | |||
| – COT Index Score (3 Year Range Pct): | 0.0 | 100.0 | 56.3 |
| – COT Index Reading (3 Year Range): | Bearish-Extreme | Bullish-Extreme | Bullish |
| NET POSITION MOVEMENT INDEX: | |||
| – 6-Week Change in Strength Index: | -12.8 | 13.5 | -7.0 |
Brazilian Real Futures:
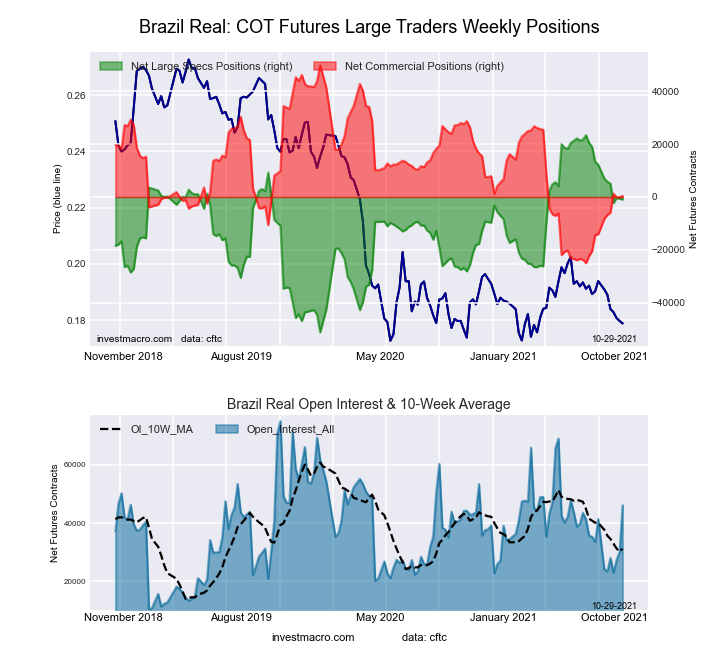 The Brazilian Real large speculator standing this week totaled a net position of -942 contracts in the data reported through Tuesday. This was a weekly reduction of -284 contracts from the previous week which had a total of -658 net contracts.
This week’s current strength score (the trader positioning range over the past three years, measured from 0 to 100) shows the speculators are currently Bullish with a score of 67.4 percent. The commercials are Bearish with a score of 34.0 percent and the small traders (not shown in chart) are Bullish with a score of 72.6 percent.
| BRAZIL REAL Statistics | SPECULATORS | COMMERCIALS | SMALL TRADERS |
| – Percent of Open Interest Longs: | 44.1 | 45.9 | 7.6 |
| – Percent of Open Interest Shorts: | 46.2 | 44.9 | 6.5 |
| – Net Position: | -942 | 463 | 479 |
| – Gross Longs: | 20,337 | 21,128 | 3,486 |
| – Gross Shorts: | 21,279 | 20,665 | 3,007 |
| – Long to Short Ratio: | 1.0 to 1 | 1.0 to 1 | 1.2 to 1 |
| NET POSITION TREND: | |||
| – COT Index Score (3 Year Range Pct): | 67.4 | 34.0 | 72.6 |
| – COT Index Reading (3 Year Range): | Bullish | Bearish | Bullish |
| NET POSITION MOVEMENT INDEX: | |||
| – 6-Week Change in Strength Index: | -10.6 | 11.7 | -10.6 |
Russian Ruble Futures:
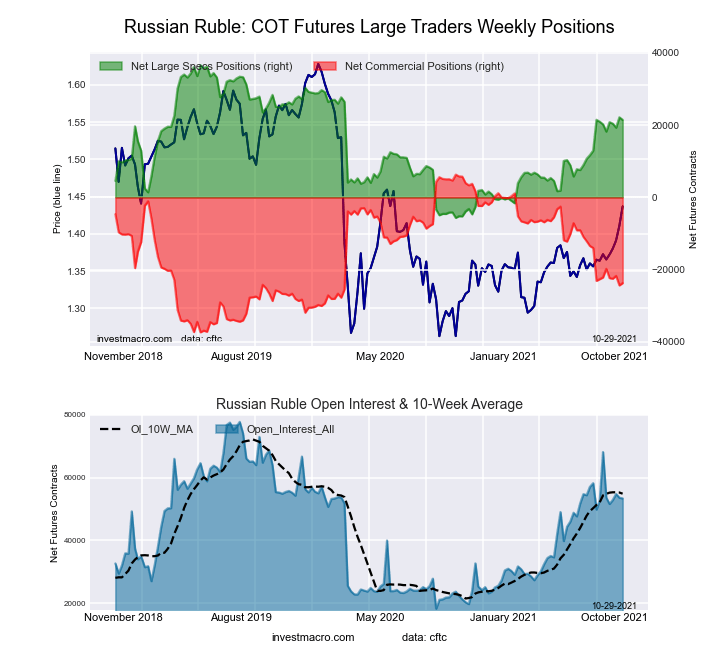 The Russian Ruble large speculator standing this week totaled a net position of 21,462 contracts in the data reported through Tuesday. This was a weekly reduction of -709 contracts from the previous week which had a total of 22,171 net contracts.
This week’s current strength score (the trader positioning range over the past three years, measured from 0 to 100) shows the speculators are currently Bullish with a score of 64.2 percent. The commercials are Bearish with a score of 31.2 percent and the small traders (not shown in chart) are Bullish-Extreme with a score of 96.1 percent.
| RUSSIAN RUBLE Statistics | SPECULATORS | COMMERCIALS | SMALL TRADERS |
| – Percent of Open Interest Longs: | 57.5 | 36.5 | 6.0 |
| – Percent of Open Interest Shorts: | 17.3 | 80.9 | 1.8 |
| – Net Position: | 21,462 | -23,728 | 2,266 |
| – Gross Longs: | 30,708 | 19,461 | 3,205 |
| – Gross Shorts: | 9,246 | 43,189 | 939 |
| – Long to Short Ratio: | 3.3 to 1 | 0.5 to 1 | 3.4 to 1 |
| NET POSITION TREND: | |||
| – COT Index Score (3 Year Range Pct): | 64.2 | 31.2 | 96.1 |
| – COT Index Reading (3 Year Range): | Bullish | Bearish | Bullish-Extreme |
| NET POSITION MOVEMENT INDEX: | |||
| – 6-Week Change in Strength Index: | 2.9 | -3.6 | 9.2 |
Bitcoin Futures:
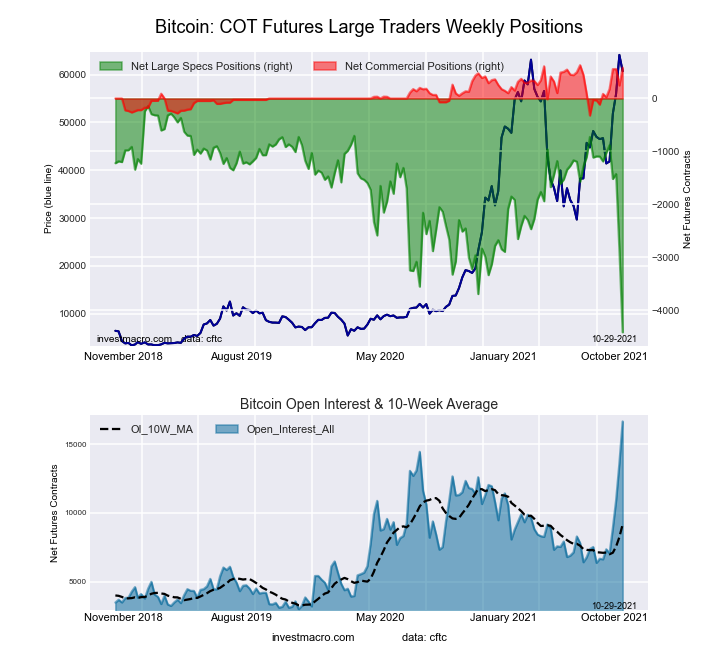 The Bitcoin large speculator standing this week totaled a net position of -4,412 contracts in the data reported through Tuesday. This was a weekly fall of -1,566 contracts from the previous week which had a total of -2,846 net contracts.
This week’s current strength score (the trader positioning range over the past three years, measured from 0 to 100) shows the speculators are currently Bearish-Extreme with a score of 0.0 percent. The commercials are Bullish-Extreme with a score of 95.3 percent and the small traders (not shown in chart) are Bullish-Extreme with a score of 100.0 percent.
| BITCOIN Statistics | SPECULATORS | COMMERCIALS | SMALL TRADERS |
| – Percent of Open Interest Longs: | 42.7 | 5.8 | 28.9 |
| – Percent of Open Interest Shorts: | 69.2 | 2.3 | 5.9 |
| – Net Position: | -4,412 | 583 | 3,829 |
| – Gross Longs: | 7,121 | 972 | 4,810 |
| – Gross Shorts: | 11,533 | 389 | 981 |
| – Long to Short Ratio: | 0.6 to 1 | 2.5 to 1 | 4.9 to 1 |
| NET POSITION TREND: | |||
| – COT Index Score (3 Year Range Pct): | 0.0 | 95.3 | 100.0 |
| – COT Index Reading (3 Year Range): | Bearish-Extreme | Bullish-Extreme | Bullish-Extreme |
| NET POSITION MOVEMENT INDEX: | |||
| – 6-Week Change in Strength Index: | -75.5 | 52.4 | 77.6 |
Article By InvestMacro.com – Receive our weekly COT Reports by Email
*COT Report: The COT data, released weekly to the public each Friday, is updated through the most recent Tuesday (data is 3 days old) and shows a quick view of how large speculators or non-commercials (for-profit traders) were positioned in the futures markets.
The CFTC categorizes trader positions according to commercial hedgers (traders who use futures contracts for hedging as part of the business), non-commercials (large traders who speculate to realize trading profits) and nonreportable traders (usually small traders/speculators).
Find CFTC criteria here: (http://www.cftc.gov/MarketReports/CommitmentsofTraders/ExplanatoryNotes/index.htm).

- COT Metals Charts: Speculator Bets led lower by Gold, Copper & Silver Apr 5, 2025
- COT Bonds Charts: Speculator Bets led by SOFR 1-Month & US Treasury Bonds Apr 5, 2025
- COT Soft Commodities Charts: Speculator Bets led by Soybean Oil, Cotton & Soybeans Apr 5, 2025
- COT Stock Market Charts: Speculator Bets led by S&P500 & Nasdaq Apr 5, 2025
- Today, investors focus on the Non-Farm Payrolls labor market report Apr 4, 2025
- USD/JPY collapses to a 6-month low: safe-haven assets in demand Apr 4, 2025
- GBP/USD Hits 21-Week High: The Pound Outperforms Its Peers Apr 3, 2025
- Most of the tariffs imposed by the Trump administration take effect today Apr 2, 2025
- EUR/USD Declines as Markets Await Signals of a Renewed Trade War Apr 2, 2025
- “Liberation Day”: How markets might react to Trump’s April 2nd tariff announcement? Apr 2, 2025
