
By Orbex
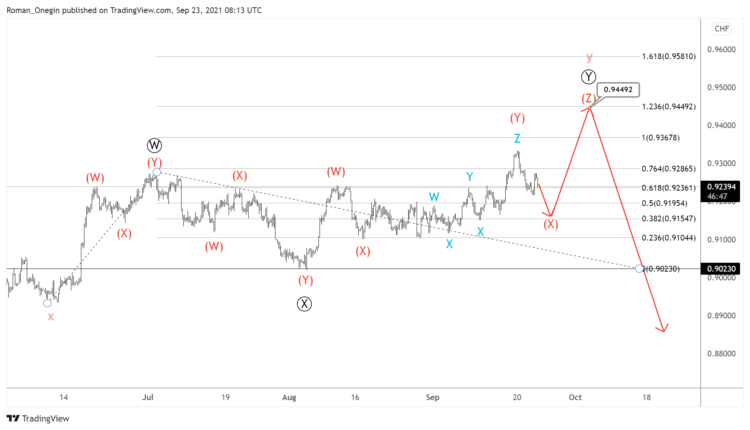
The formation of the USDCHF pair suggests the development of a cycle wave y, which hints at a double zigzag Ⓦ-Ⓧ-Ⓨ of the primary degree. Let’s pay attention to the last primary wave Ⓨ, which is under development.
Wave Ⓨ has a complex internal structure and will most likely take the form of a triple combination (W)-(X)-(Y)-(X)-(Z). Actionary waves (W) and (Y) and the intervening wave (X) could have already ended. Therefore, the development of intermediate waves (X) and (Z) is possible in the future.
The end of wave y will be near 0.944. At that level, the primary wave Ⓨ will be at 123.6% of wave Ⓦ.

Free Reports:
 Sign Up for Our Stock Market Newsletter – Get updated on News, Charts & Rankings of Public Companies when you join our Stocks Newsletter
 Get our Weekly Commitment of Traders Reports - See where the biggest traders (Hedge Funds and Commercial Hedgers) are positioned in the futures markets on a weekly basis.
According to an alternative scenario, the formation of the cycle wave y has come to an end. It took the form of a primary double zigzag.
If this assumption is correct, then at the moment we are in the initial part of a new bearish wave.
We can expect that in the upcoming trading weeks the market will move in a downward direction within the intermediate impulse, as shown on the chart below the low of 0.901. This was marked by the primary intervening wave Ⓧ.
With the strengthening of the bears, the market could decline faster than usual.
![]() Article by Orbex
Article by Orbex
Orbex is a fully licensed broker that was established in 2011. Founded with a mission to serve its traders responsibly and provides traders with access to the world’s largest and most liquid financial markets. www.orbex.com

- COT Metals Charts: Weekly Speculator Bets led by Copper & Steel Jul 18, 2026
- COT Bonds Charts: Weekly Speculator Bets led by 2-Year, SOFR 3M & 5-Year Bonds Jul 18, 2026
- COT Energy Charts: Weekly Speculator Bets led by Brent Oil & Heating Oil Jul 18, 2026
- COT Soft Commodities Charts: Weekly Speculator Bets led by Wheat, Corn & Soybean Meal Jul 18, 2026
- The Bank of Canada kept its interest rate unchanged. Platinum prices reached a three‑week high Jul 16, 2026
- Stock indices rose after the release of US inflation data. China’s GDP slowed sharply Jul 15, 2026
- GBP/USD Awaits Political News: What Will Happen Next Jul 15, 2026
- USD/JPY Holds at Highs: Pressure Lingers on Yen Jul 14, 2026
- Oil prices jumped 4% amid a new wave of escalation between the US and Iran Jul 13, 2026
- EUR/USD: US Inflation Will Determine Everything Jul 13, 2026