
Article By RoboForex.com
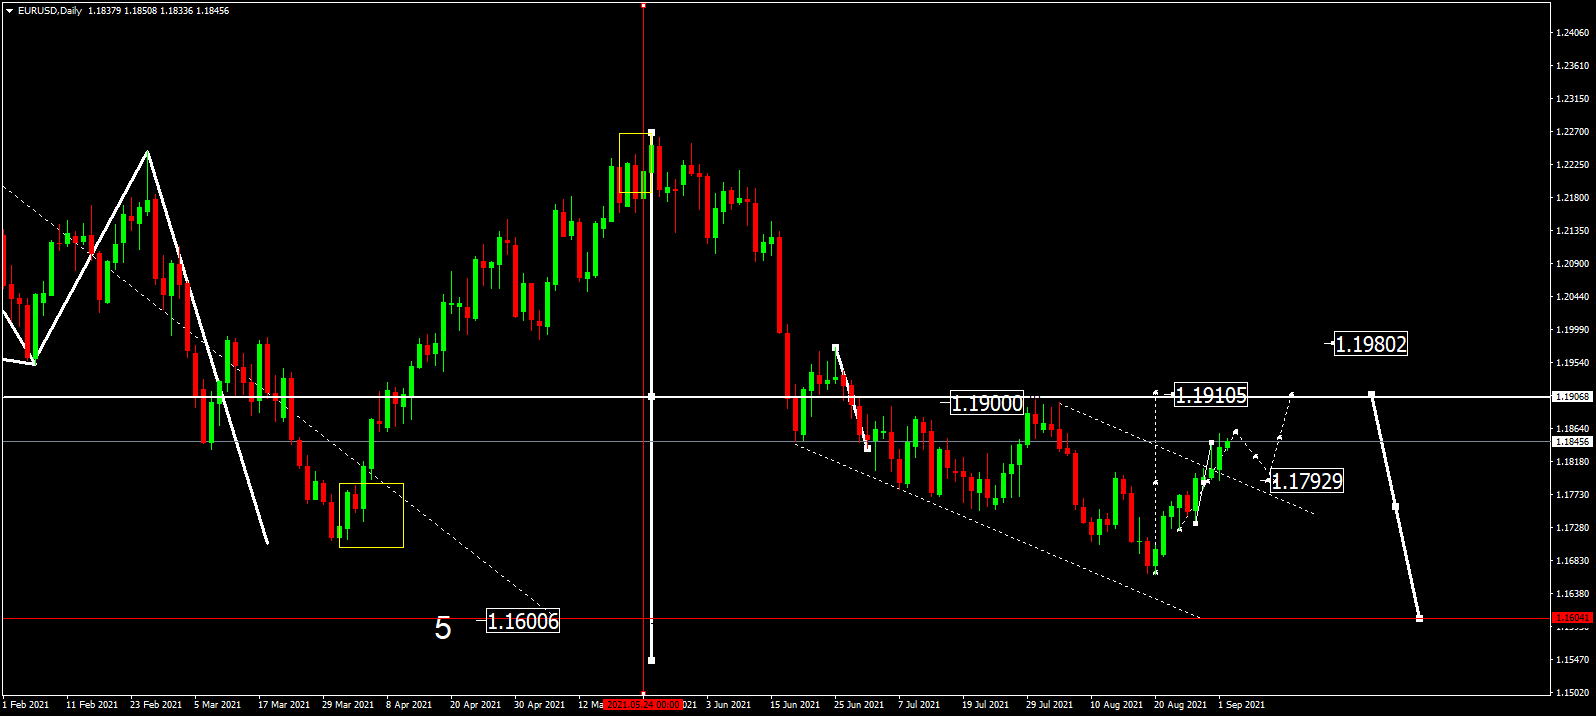
EURUSD, “Euro vs US Dollar”
As we can see in the daily chart, EURUSD is expected to update the high at 1.1860 and then start a new correction towards 1.1793. After that, the instrument may form one more ascending wave to reach 1.1910 and then start another correction to return to 1.1793. In fact, the asset is expected to form a new consolidation range around 1.1793.

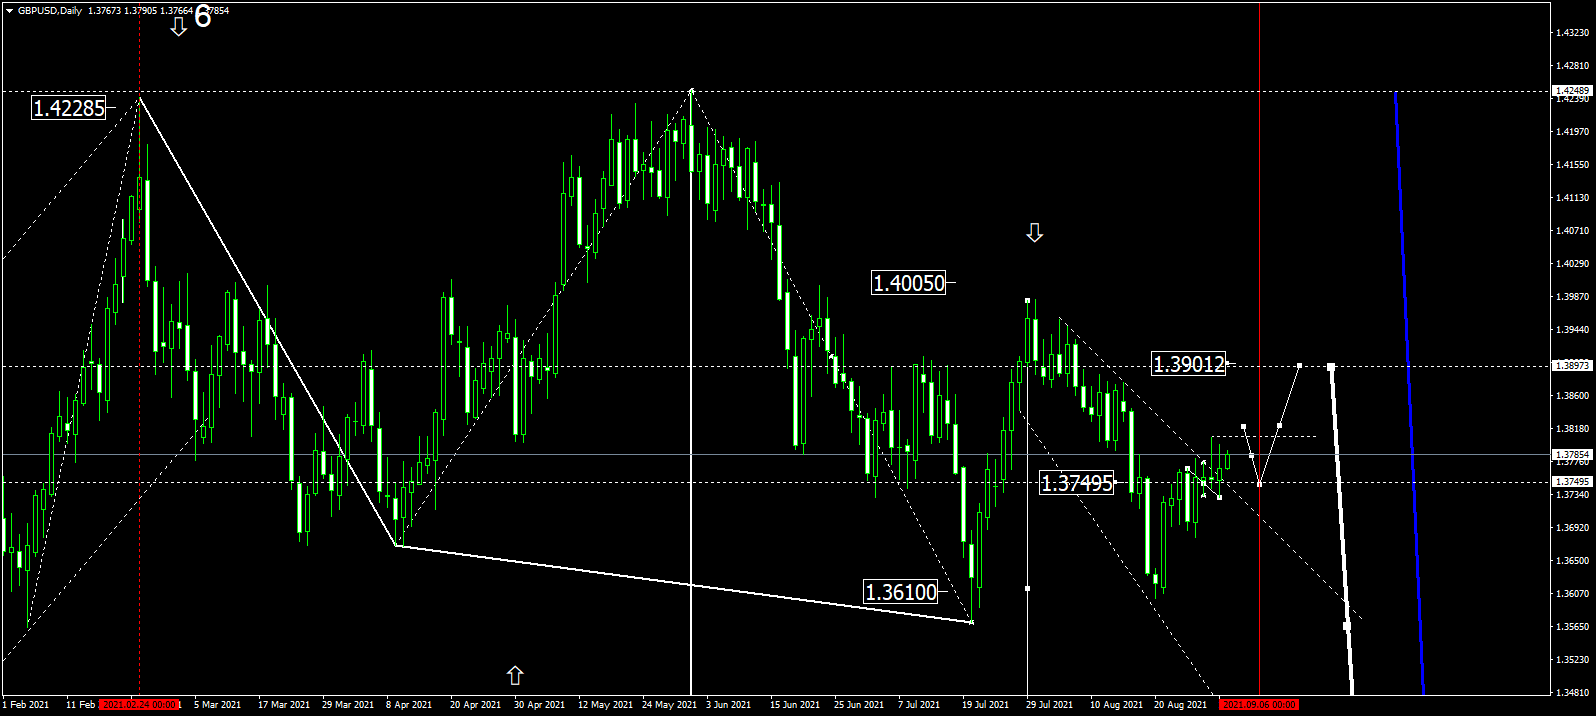
GBPUSD, “Great Britain Pound vs US Dollar”
In the daily chart, after breaking 1.3750 to the upside, GBPUSD is consolidating around this level and may expand this range up to 1.3820. After that, the instrument may fall to test 1.3750 from above and then start another growth towards 1.3900. Later, the market may form a new descending structure to return to 1.3750.
Free Reports:
 Sign Up for Our Stock Market Newsletter – Get updated on News, Charts & Rankings of Public Companies when you join our Stocks Newsletter
 Get our Weekly Commitment of Traders Reports - See where the biggest traders (Hedge Funds and Commercial Hedgers) are positioned in the futures markets on a weekly basis.
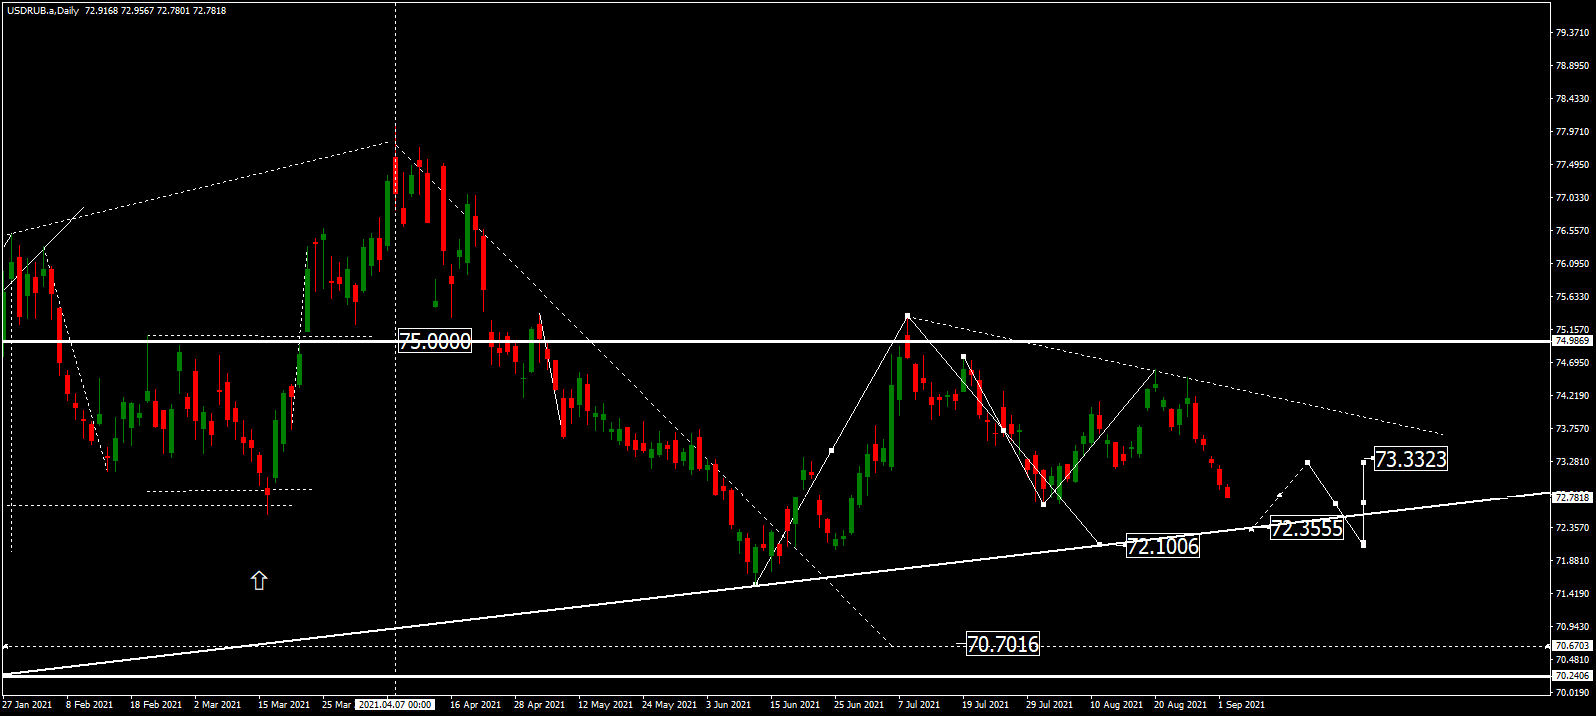
USDRUB, “US Dollar vs Russian Ruble”
As we can see in the daily chart, USDRUB is still forming the fifth descending wave towards 72.10. This month, the asset may fall to reach 72.35 and then start a new correction to test 73.33 from below. Later, the market may resume falling to reach 72.10 and then form one more ascending wave with the target at 73.50.
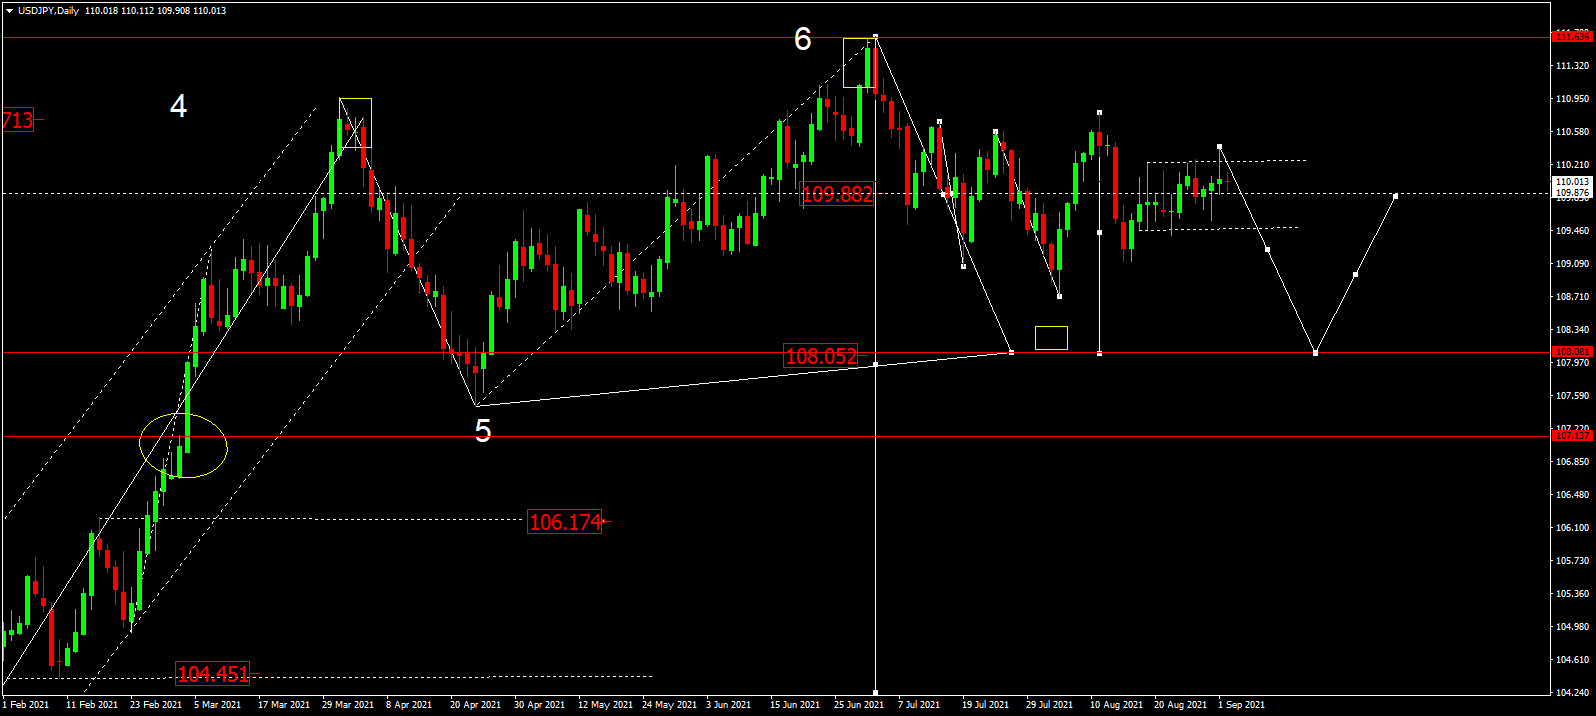
USDJPY, “US Dollar vs Japanese Yen”
In the daily chart, USDJPY is forming the first descending wave towards 108.05; right now, it is consolidating around 110.00. The main scenario implies that the price may expand the range down to the first target at 108.05. After that, the instrument may correct to test 110.00 from below and then start a new decline with the target at 106.20.
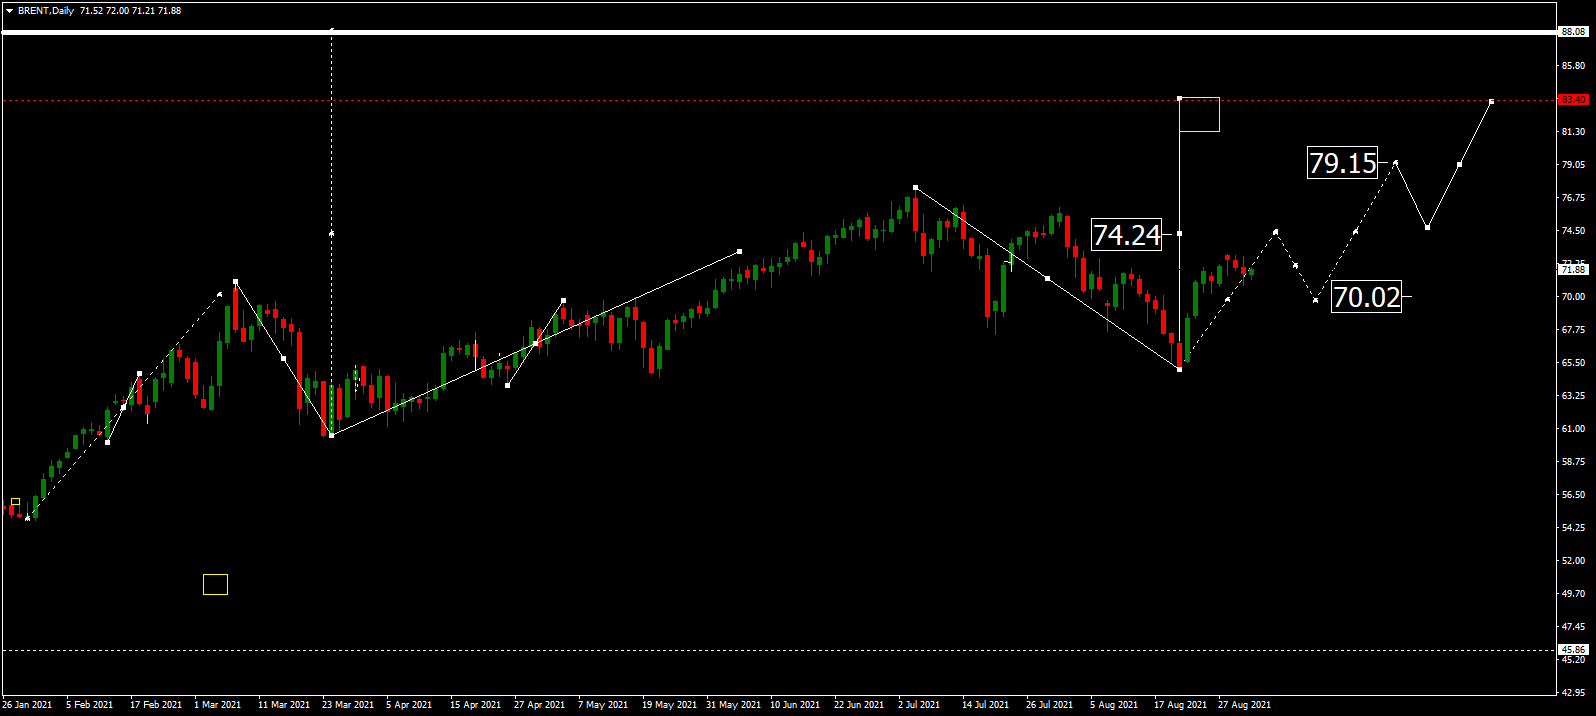
BRENT
As we can see in the daily chart, after finishing the correction at 65.05, Brent is trading upwards to reach 76.00 and may later start a new correction towards 70.20. After that, the instrument may form one more ascending structure with the short-term target at 79.15. In fact, the asset is expected to move within the uptrend with the first target at 83.50.
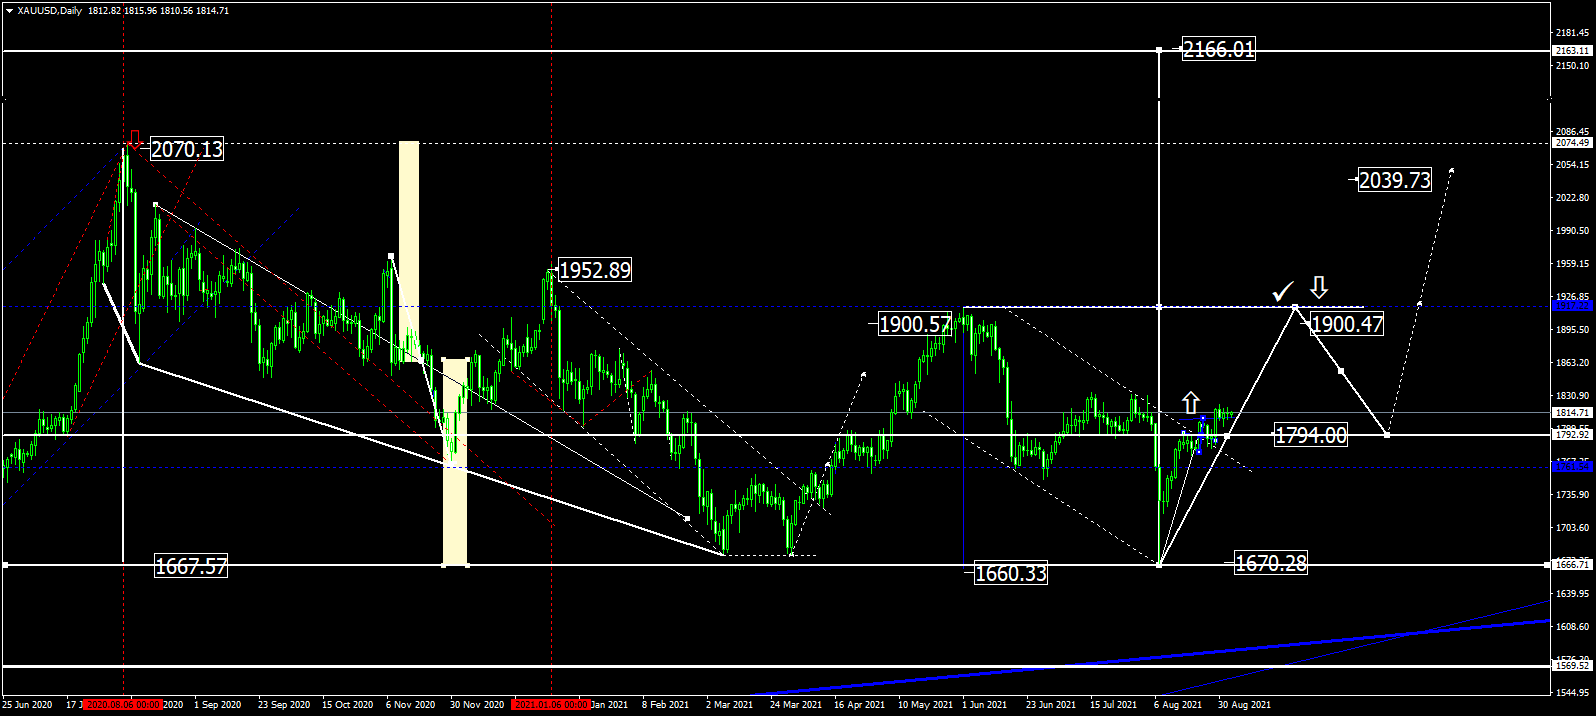
XAUUSD, “Gold vs US Dollar”
In the daily chart, after breaking 1794.00 and then forming a new consolidation range around this level, Gold has broken it to the upside as well and may continue trading upwards to reach 1900.00. After that, the instrument may return to 1794.00 to test it from above and then resume growing. The next upside target will be clear after the asset breaks 1900.00.
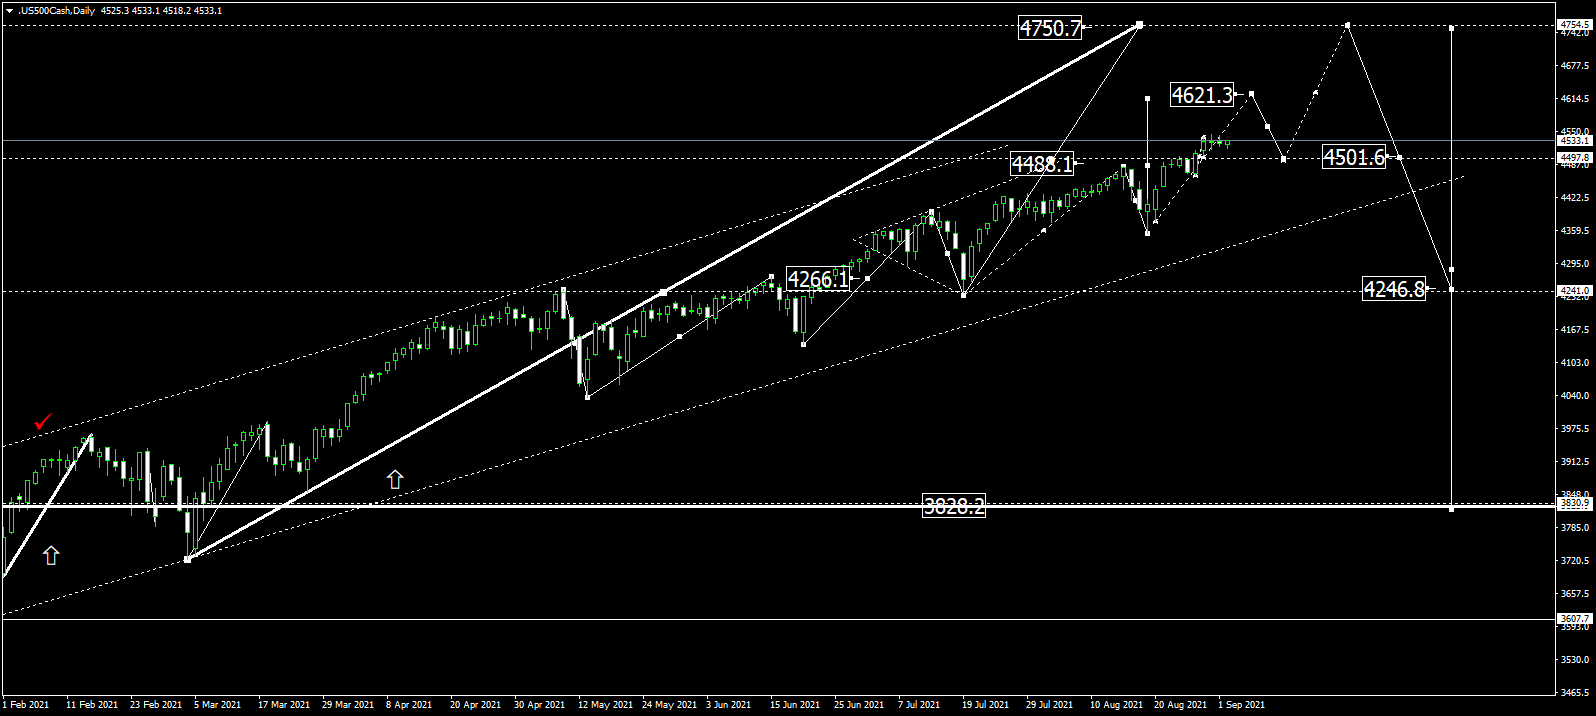
S&P 500
In the daily chart, after completing another ascending structure at 4500.0, the S&P index is consolidating around this level. Possibly, the asset may break the range to the upside and reach 4620.0 and then start a new correction towards 4500.0. Later, the market may start another growth with the target at 4750.0. However, all rising movements should be considered as an alternative scenario as the index may start plummeting at any moment. In this case, the downside target will be at 4000.0.
Article By RoboForex.com
Attention!
Forecasts presented in this section only reflect the author’s private opinion and should not be considered as guidance for trading. RoboForex LP bears no responsibility for trading results based on trading recommendations described in these analytical reviews.

- COT Metals Charts: Weekly Speculator Bets led by Copper & Steel Jul 18, 2026
- COT Bonds Charts: Weekly Speculator Bets led by 2-Year, SOFR 3M & 5-Year Bonds Jul 18, 2026
- COT Energy Charts: Weekly Speculator Bets led by Brent Oil & Heating Oil Jul 18, 2026
- COT Soft Commodities Charts: Weekly Speculator Bets led by Wheat, Corn & Soybean Meal Jul 18, 2026
- The Bank of Canada kept its interest rate unchanged. Platinum prices reached a three‑week high Jul 16, 2026
- Stock indices rose after the release of US inflation data. China’s GDP slowed sharply Jul 15, 2026
- GBP/USD Awaits Political News: What Will Happen Next Jul 15, 2026
- USD/JPY Holds at Highs: Pressure Lingers on Yen Jul 14, 2026
- Oil prices jumped 4% amid a new wave of escalation between the US and Iran Jul 13, 2026
- EUR/USD: US Inflation Will Determine Everything Jul 13, 2026