
Article By RoboForex.com
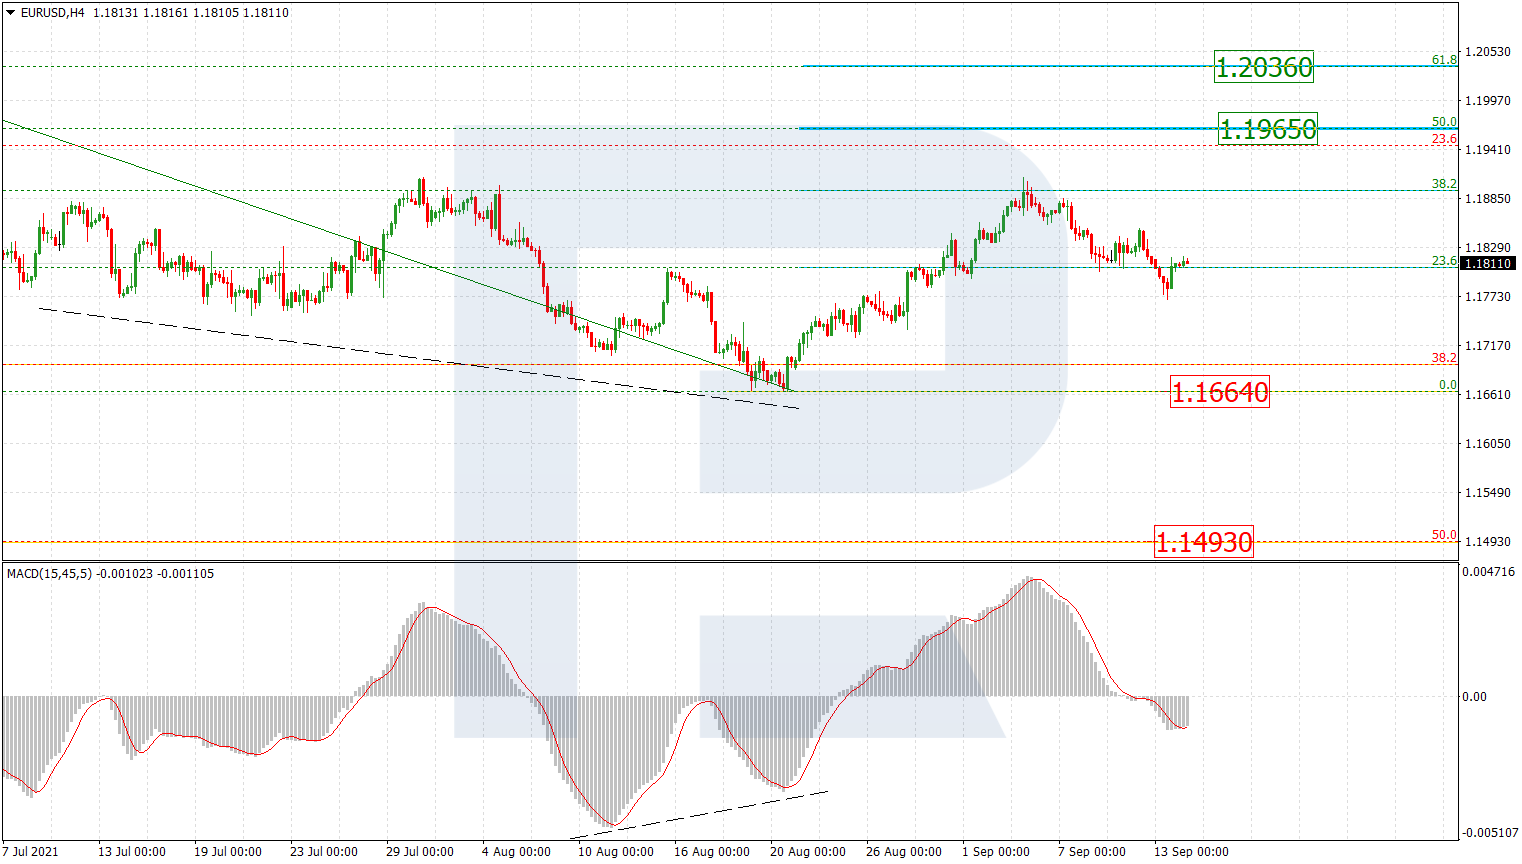
EURUSD, “Euro vs US Dollar”
As we can see in the H4 chart, after completing the correctional uptrend at 38.2% fibo, the asset is moving downwards. Such a situation may imply a possible descending wave to break the low at 1.1664 and then reach the long-term 50.0% fibo at 1.1493. However, this scenario should be considered as an alternative one. The main trading idea suggests that EURUSD may complete this decline and start another growth to reach 50.0% and 61.8% fibo at 1.1965 and 1.2036 respectively.

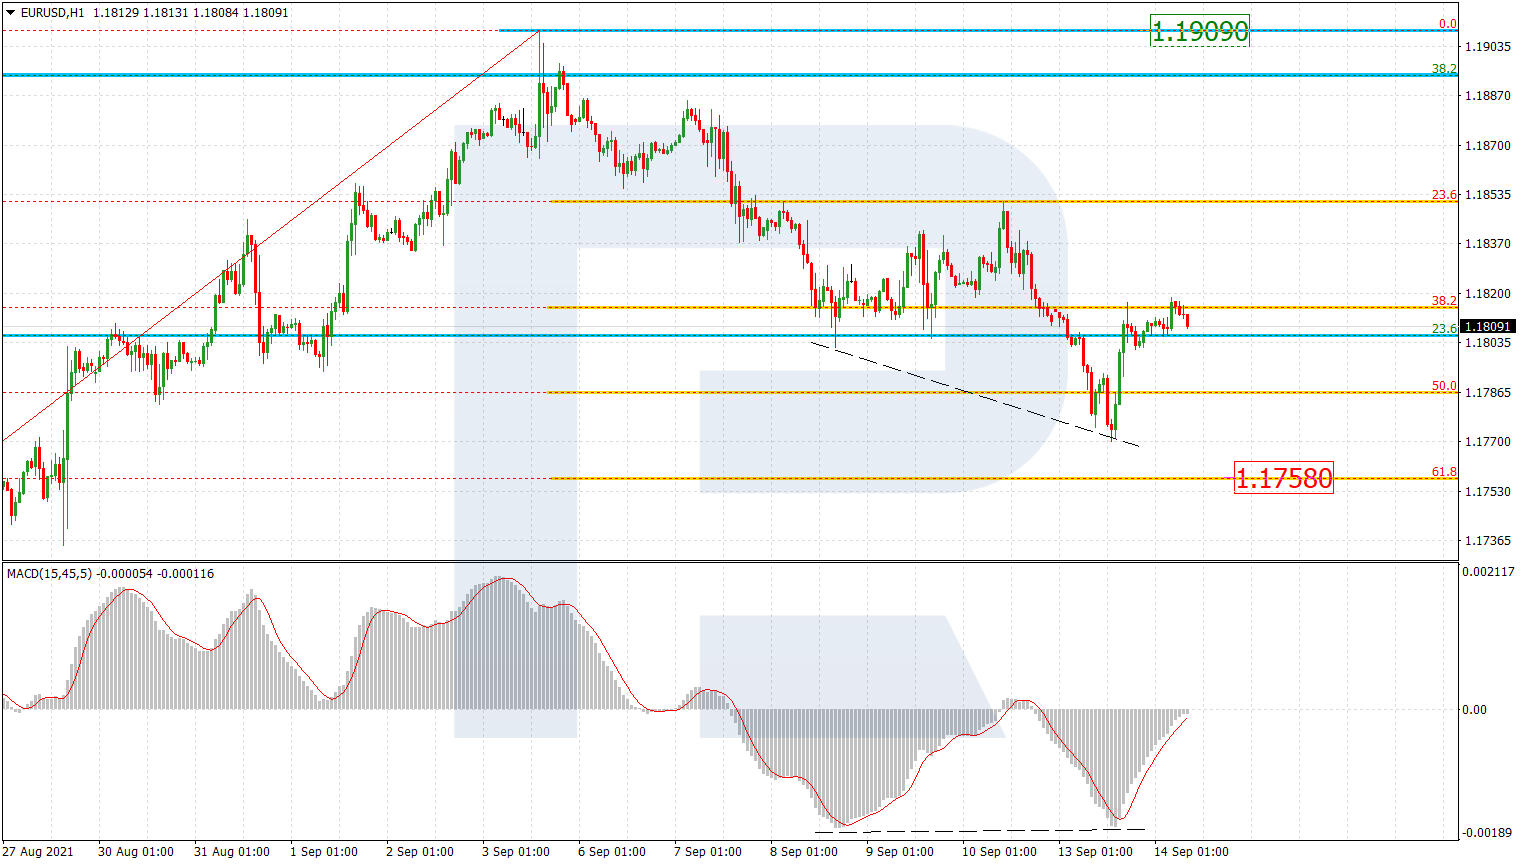
The H1 chart shows the descending correction, which, after reaching 50.0% fibo, was followed by a new pullback forced by convergence on MACD. The pullback may be over soon and the asset is highly likely to start another descending impulse towards 61.8% fibo at 1.1758. Only after that, we can expect a new wave to the upside to reach the high at 1.1909.
Free Reports:
 Sign Up for Our Stock Market Newsletter – Get updated on News, Charts & Rankings of Public Companies when you join our Stocks Newsletter
 Get our Weekly Commitment of Traders Reports - See where the biggest traders (Hedge Funds and Commercial Hedgers) are positioned in the futures markets on a weekly basis.
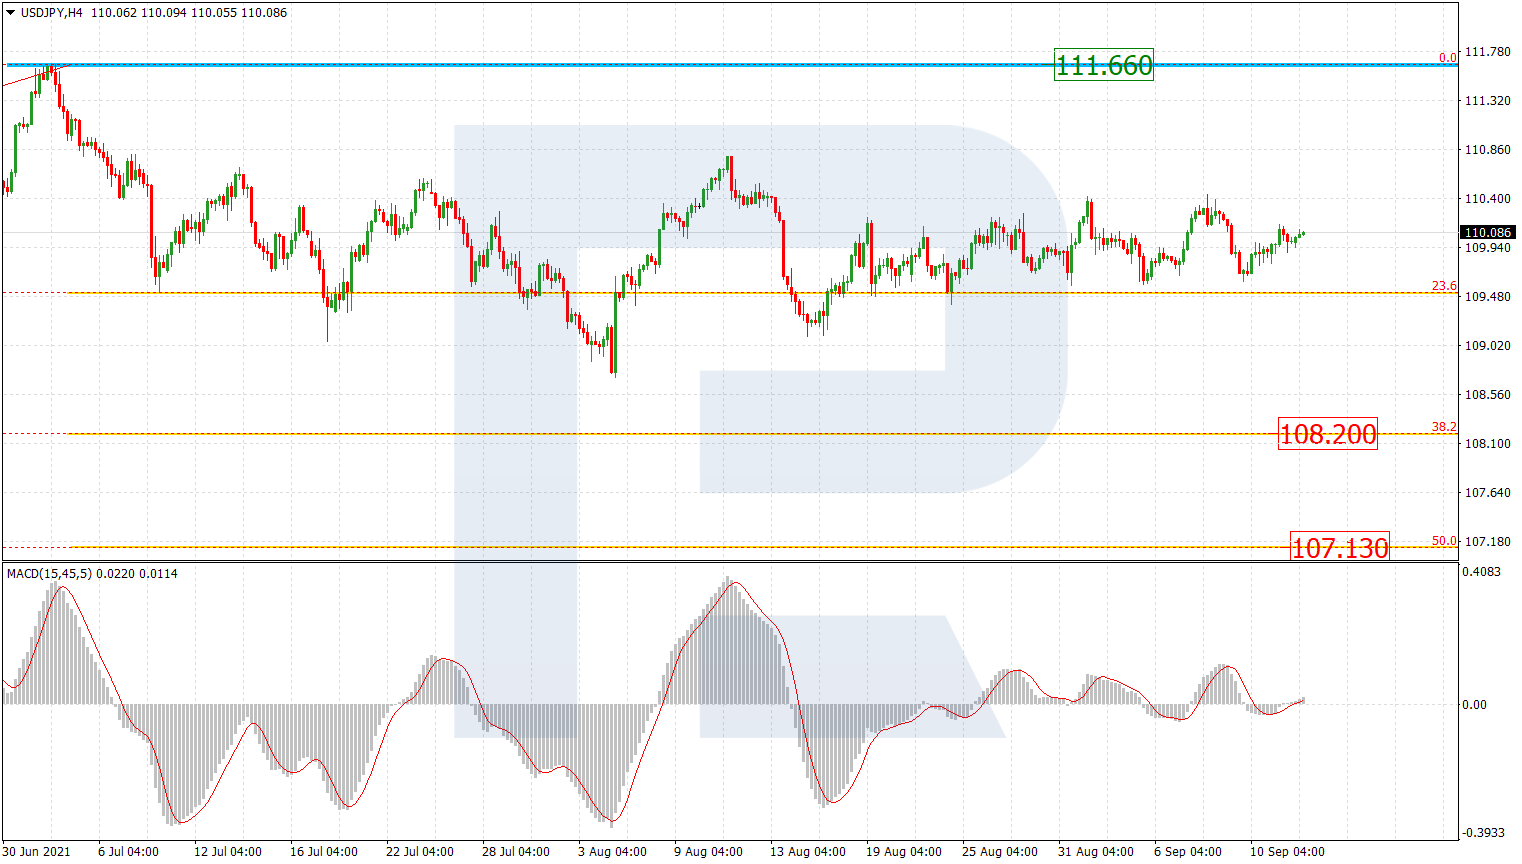
USDJPY, “US Dollar vs. Japanese Yen”
As we can see in the H4 chart, the situation hasn’t changed much. The asset is still consolidating above 23.6% fibo. Expectations remain the same – the pair may break this range to the downside and start a new wave to the downside towards 38.2% and 50.0% fibo at 108.20 and 107.13 respectively. The resistance is still the high at 111.66.
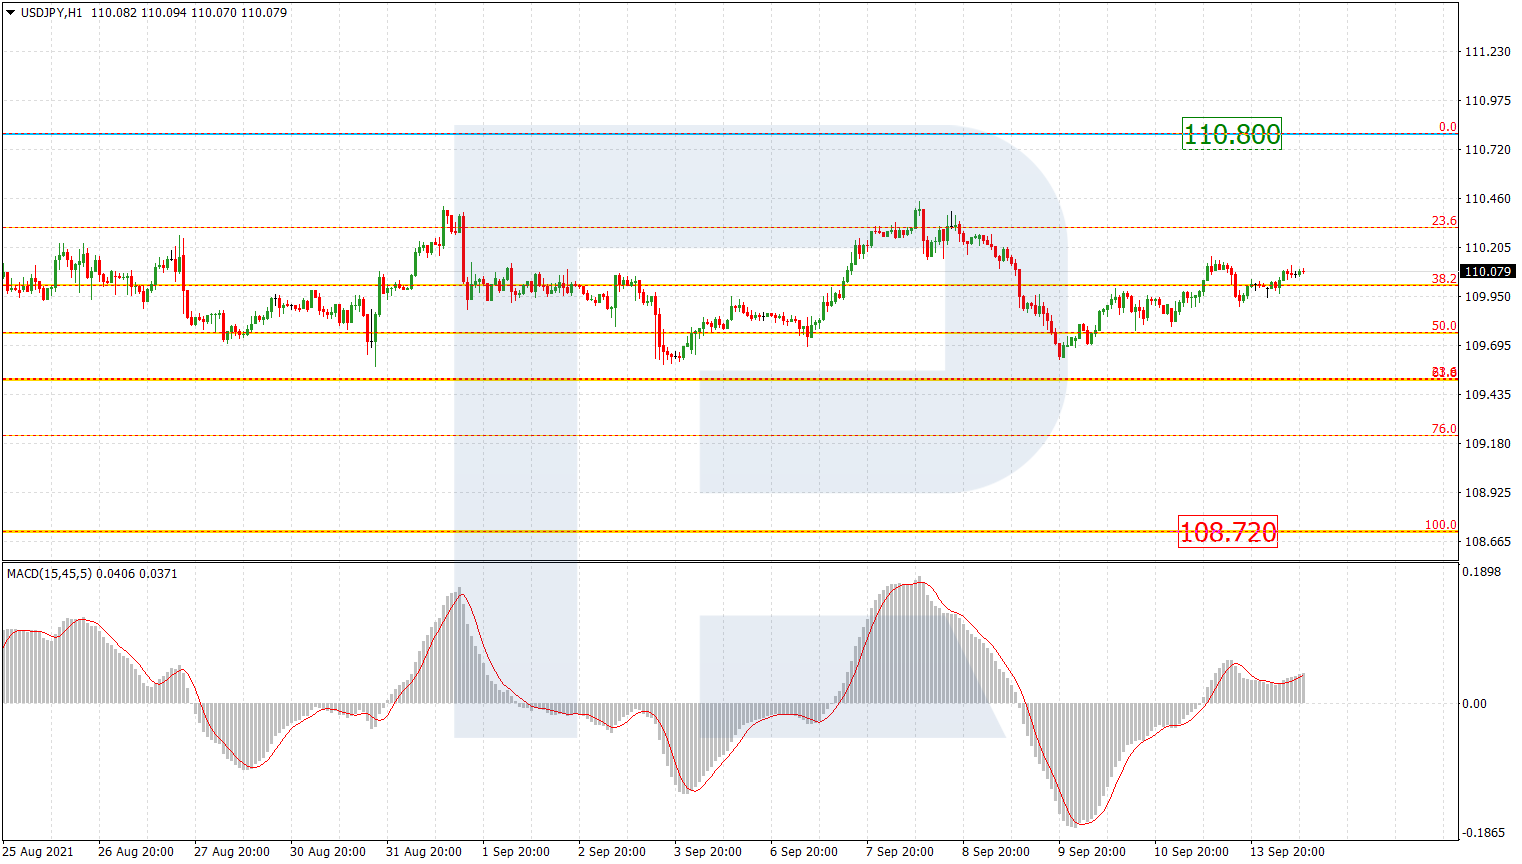
The H1 chart shows that the price is stuck between 110.80 and 108.72. On a smaller scale – between 23.6% and 61.8% fibo. The main scenario implies that the pair may grow towards 110.80, rebound from it, and resume trading downwards.
Article By RoboForex.com
Attention!
Forecasts presented in this section only reflect the author’s private opinion and should not be considered as guidance for trading. RoboForex LP bears no responsibility for trading results based on trading recommendations described in these analytical reviews.

- COT Metals Charts: Weekly Speculator Bets led by Copper & Steel Jul 18, 2026
- COT Bonds Charts: Weekly Speculator Bets led by 2-Year, SOFR 3M & 5-Year Bonds Jul 18, 2026
- COT Energy Charts: Weekly Speculator Bets led by Brent Oil & Heating Oil Jul 18, 2026
- COT Soft Commodities Charts: Weekly Speculator Bets led by Wheat, Corn & Soybean Meal Jul 18, 2026
- The Bank of Canada kept its interest rate unchanged. Platinum prices reached a three‑week high Jul 16, 2026
- Stock indices rose after the release of US inflation data. China’s GDP slowed sharply Jul 15, 2026
- GBP/USD Awaits Political News: What Will Happen Next Jul 15, 2026
- USD/JPY Holds at Highs: Pressure Lingers on Yen Jul 14, 2026
- Oil prices jumped 4% amid a new wave of escalation between the US and Iran Jul 13, 2026
- EUR/USD: US Inflation Will Determine Everything Jul 13, 2026