
By InvestMacro.com COT Home | Data Tables | Data Downloads | Newsletter
Here are the latest charts and statistics for the Commitment of Traders (COT) data published by the Commodities Futures Trading Commission (CFTC).
The latest COT data is updated through Tuesday September 21 2021 and shows a quick view of how large traders (for-profit speculators and commercial entities) were positioned in the futures markets.
CORN Futures:
 The CORN large speculator standing this week totaled a net position of 265,501 contracts in the data reported through Tuesday. This was a weekly gain of 6,867 contracts from the previous week which had a total of 258,634 net contracts.
This week’s current strength score (the trader positioning range over the past three years, measured from 0 to 100) shows the speculators are currently Bullish with a score of 63.9 percent. The commercials are Bearish with a score of 43.6 percent and the small traders (not shown in chart) are Bearish-Extreme with a score of 4.8 percent.
| CORN Futures Statistics | SPECULATORS | COMMERCIALS | SMALL TRADERS |
| – Percent of Open Interest Longs: | 26.7 | 50.2 | 8.5 |
| – Percent of Open Interest Shorts: | 7.5 | 64.6 | 13.3 |
| – Net Position: | 265,501 | -199,014 | -66,487 |
| – Gross Longs: | 368,776 | 692,567 | 117,018 |
| – Gross Shorts: | 103,275 | 891,581 | 183,505 |
| – Long to Short Ratio: | 3.6 to 1 | 0.8 to 1 | 0.6 to 1 |
| NET POSITION TREND: | |||
| – COT Index Score (3 Year Range Pct): | 63.9 | 43.6 | 4.8 |
| – COT Index Reading (3 Year Range): | Bullish | Bearish | Bearish-Extreme |
| NET POSITION MOVEMENT INDEX: | |||
| – 6-Week Change in Strength Index: | -7.2 | 7.3 | 2.7 |
Free Reports:
 Sign Up for Our Stock Market Newsletter – Get updated on News, Charts & Rankings of Public Companies when you join our Stocks Newsletter
 Get our Weekly Commitment of Traders Reports - See where the biggest traders (Hedge Funds and Commercial Hedgers) are positioned in the futures markets on a weekly basis.
SUGAR Futures:
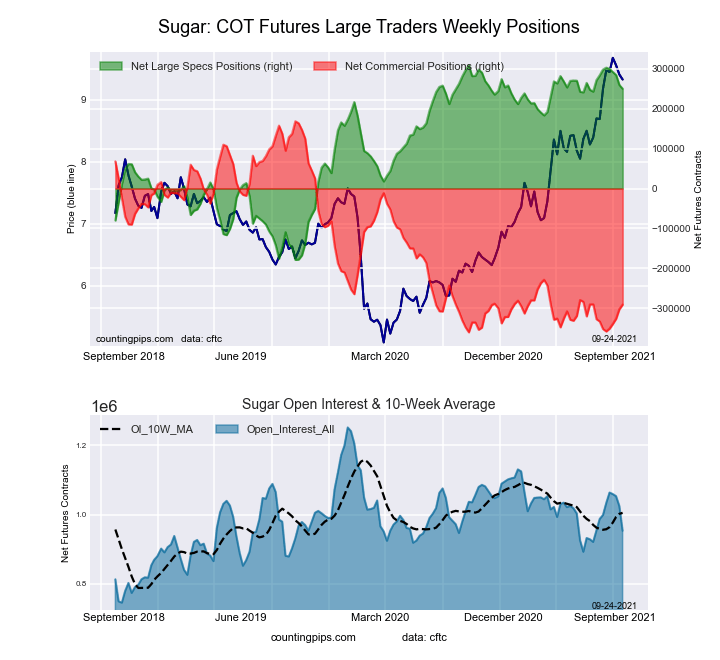 The SUGAR large speculator standing this week totaled a net position of 249,467 contracts in the data reported through Tuesday. This was a weekly decrease of -9,582 contracts from the previous week which had a total of 259,049 net contracts.
This week’s current strength score (the trader positioning range over the past three years, measured from 0 to 100) shows the speculators are currently Bullish-Extreme with a score of 87.9 percent. The commercials are Bearish-Extreme with a score of 13.1 percent and the small traders (not shown in chart) are Bullish with a score of 58.5 percent.
| SUGAR Futures Statistics | SPECULATORS | COMMERCIALS | SMALL TRADERS |
| – Percent of Open Interest Longs: | 30.9 | 45.8 | 9.4 |
| – Percent of Open Interest Shorts: | 4.7 | 76.2 | 5.1 |
| – Net Position: | 249,467 | -290,392 | 40,925 |
| – Gross Longs: | 294,049 | 436,110 | 89,249 |
| – Gross Shorts: | 44,582 | 726,502 | 48,324 |
| – Long to Short Ratio: | 6.6 to 1 | 0.6 to 1 | 1.8 to 1 |
| NET POSITION TREND: | |||
| – COT Index Score (3 Year Range Pct): | 87.9 | 13.1 | 58.5 |
| – COT Index Reading (3 Year Range): | Bullish-Extreme | Bearish-Extreme | Bullish |
| NET POSITION MOVEMENT INDEX: | |||
| – 6-Week Change in Strength Index: | -9.9 | 11.6 | -16.1 |
COFFEE Futures:
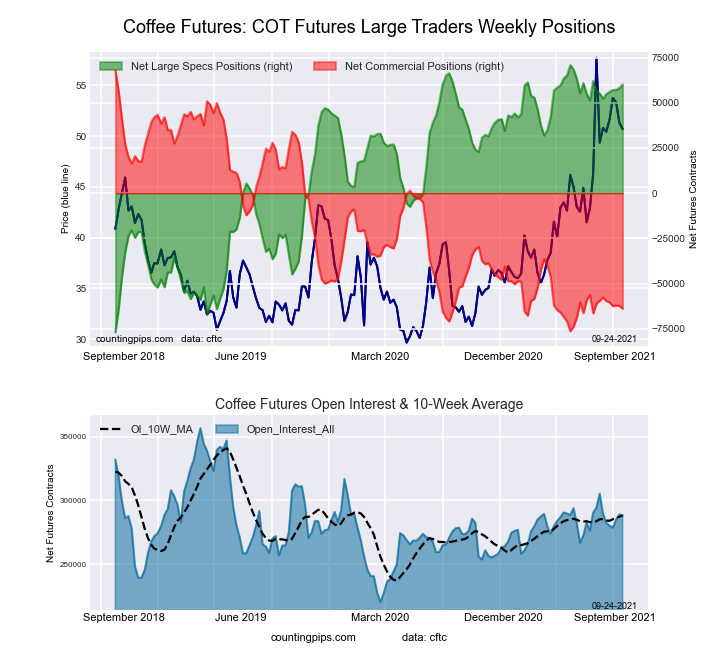 The COFFEE large speculator standing this week totaled a net position of 60,118 contracts in the data reported through Tuesday. This was a weekly gain of 2,051 contracts from the previous week which had a total of 58,067 net contracts.
This week’s current strength score (the trader positioning range over the past three years, measured from 0 to 100) shows the speculators are currently Bullish-Extreme with a score of 92.8 percent. The commercials are Bearish-Extreme with a score of 8.6 percent and the small traders (not shown in chart) are Bearish-Extreme with a score of 14.1 percent.
| COFFEE Futures Statistics | SPECULATORS | COMMERCIALS | SMALL TRADERS |
| – Percent of Open Interest Longs: | 27.0 | 42.6 | 3.6 |
| – Percent of Open Interest Shorts: | 6.2 | 64.8 | 2.3 |
| – Net Position: | 60,118 | -63,846 | 3,728 |
| – Gross Longs: | 77,942 | 122,867 | 10,484 |
| – Gross Shorts: | 17,824 | 186,713 | 6,756 |
| – Long to Short Ratio: | 4.4 to 1 | 0.7 to 1 | 1.6 to 1 |
| NET POSITION TREND: | |||
| – COT Index Score (3 Year Range Pct): | 92.8 | 8.6 | 14.1 |
| – COT Index Reading (3 Year Range): | Bullish-Extreme | Bearish-Extreme | Bearish-Extreme |
| NET POSITION MOVEMENT INDEX: | |||
| – 6-Week Change in Strength Index: | 5.3 | -4.3 | -11.2 |
SOYBEANS Futures:
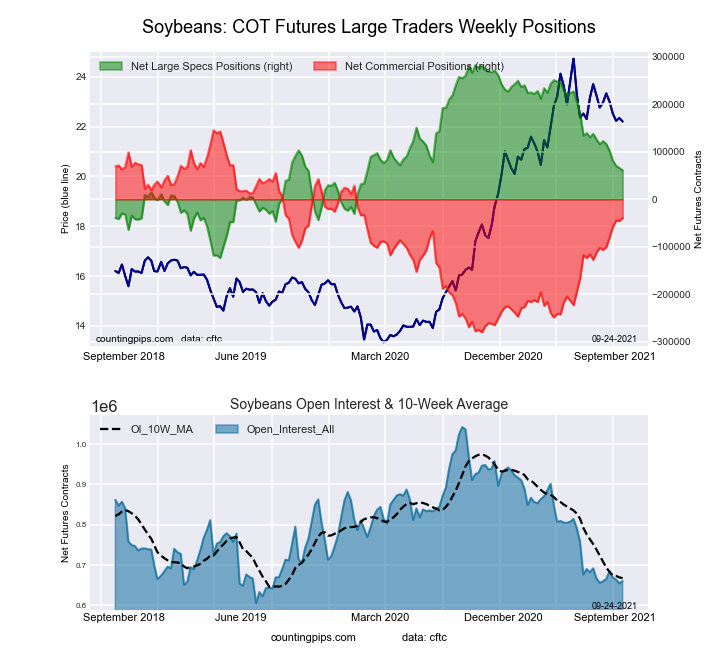 The SOYBEANS large speculator standing this week totaled a net position of 61,054 contracts in the data reported through Tuesday. This was a weekly decrease of -4,701 contracts from the previous week which had a total of 65,755 net contracts.
This week’s current strength score (the trader positioning range over the past three years, measured from 0 to 100) shows the speculators are currently Bearish with a score of 45.5 percent. The commercials are Bullish with a score of 56.6 percent and the small traders (not shown in chart) are Bearish with a score of 35.7 percent.
| SOYBEANS Futures Statistics | SPECULATORS | COMMERCIALS | SMALL TRADERS |
| – Percent of Open Interest Longs: | 21.0 | 56.8 | 7.2 |
| – Percent of Open Interest Shorts: | 11.8 | 62.7 | 10.5 |
| – Net Position: | 61,054 | -39,359 | -21,695 |
| – Gross Longs: | 138,867 | 375,002 | 47,718 |
| – Gross Shorts: | 77,813 | 414,361 | 69,413 |
| – Long to Short Ratio: | 1.8 to 1 | 0.9 to 1 | 0.7 to 1 |
| NET POSITION TREND: | |||
| – COT Index Score (3 Year Range Pct): | 45.5 | 56.6 | 35.7 |
| – COT Index Reading (3 Year Range): | Bearish | Bullish | Bearish |
| NET POSITION MOVEMENT INDEX: | |||
| – 6-Week Change in Strength Index: | -15.1 | 15.8 | -9.6 |
SOYBEAN MEAL Futures:
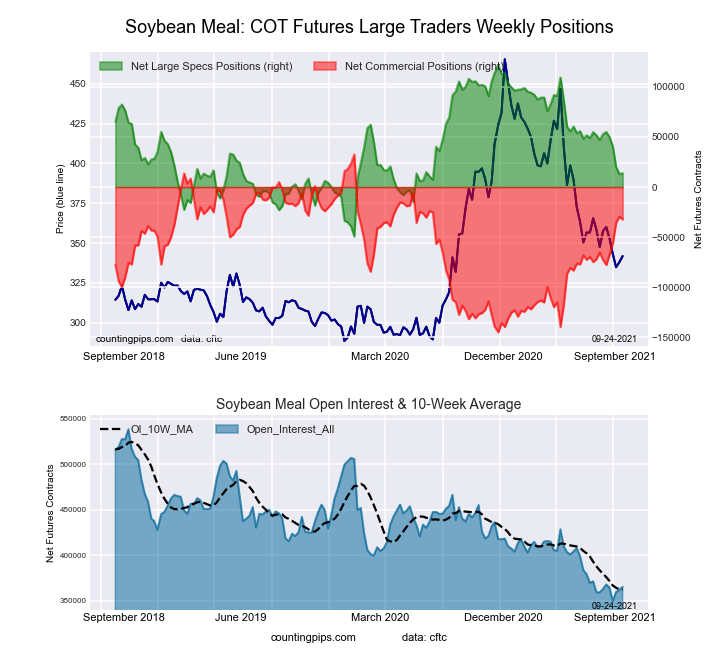 The SOYBEAN MEAL large speculator standing this week totaled a net position of 13,810 contracts in the data reported through Tuesday. This was a weekly rise of 847 contracts from the previous week which had a total of 12,963 net contracts.
This week’s current strength score (the trader positioning range over the past three years, measured from 0 to 100) shows the speculators are currently Bearish with a score of 36.9 percent. The commercials are Bullish with a score of 63.5 percent and the small traders (not shown in chart) are Bearish with a score of 45.0 percent.
| SOYBEAN MEAL Futures Statistics | SPECULATORS | COMMERCIALS | SMALL TRADERS |
| – Percent of Open Interest Longs: | 21.4 | 49.1 | 13.0 |
| – Percent of Open Interest Shorts: | 17.6 | 58.0 | 7.9 |
| – Net Position: | 13,810 | -32,358 | 18,548 |
| – Gross Longs: | 78,062 | 179,344 | 47,411 |
| – Gross Shorts: | 64,252 | 211,702 | 28,863 |
| – Long to Short Ratio: | 1.2 to 1 | 0.8 to 1 | 1.6 to 1 |
| NET POSITION TREND: | |||
| – COT Index Score (3 Year Range Pct): | 36.9 | 63.5 | 45.0 |
| – COT Index Reading (3 Year Range): | Bearish | Bullish | Bearish |
| NET POSITION MOVEMENT INDEX: | |||
| – 6-Week Change in Strength Index: | -22.8 | 22.9 | -6.2 |
LIVE CATTLE Futures:
 The LIVE CATTLE large speculator standing this week totaled a net position of 44,556 contracts in the data reported through Tuesday. This was a weekly fall of -8,599 contracts from the previous week which had a total of 53,155 net contracts.
This week’s current strength score (the trader positioning range over the past three years, measured from 0 to 100) shows the speculators are currently Bearish-Extreme with a score of 18.9 percent. The commercials are Bullish with a score of 77.6 percent and the small traders (not shown in chart) are Bullish with a score of 68.5 percent.
| LIVE CATTLE Futures Statistics | SPECULATORS | COMMERCIALS | SMALL TRADERS |
| – Percent of Open Interest Longs: | 32.2 | 43.2 | 10.7 |
| – Percent of Open Interest Shorts: | 16.8 | 55.9 | 13.3 |
| – Net Position: | 44,556 | -36,903 | -7,653 |
| – Gross Longs: | 93,533 | 125,744 | 31,090 |
| – Gross Shorts: | 48,977 | 162,647 | 38,743 |
| – Long to Short Ratio: | 1.9 to 1 | 0.8 to 1 | 0.8 to 1 |
| NET POSITION TREND: | |||
| – COT Index Score (3 Year Range Pct): | 18.9 | 77.6 | 68.5 |
| – COT Index Reading (3 Year Range): | Bearish-Extreme | Bullish | Bullish |
| NET POSITION MOVEMENT INDEX: | |||
| – 6-Week Change in Strength Index: | -20.5 | 21.5 | 11.1 |
LEAN HOGS Futures:
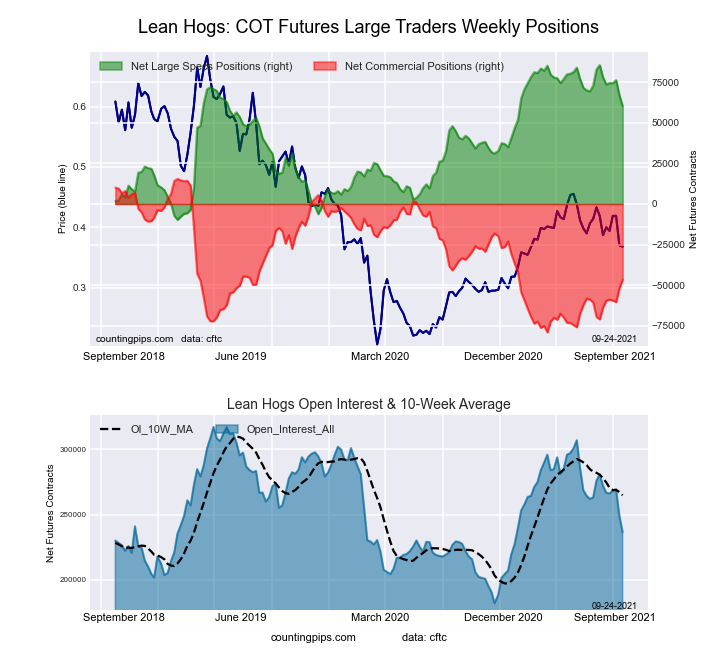 The LEAN HOGS large speculator standing this week totaled a net position of 60,363 contracts in the data reported through Tuesday. This was a weekly fall of -6,871 contracts from the previous week which had a total of 67,234 net contracts.
This week’s current strength score (the trader positioning range over the past three years, measured from 0 to 100) shows the speculators are currently Bullish with a score of 73.5 percent. The commercials are Bearish with a score of 34.3 percent and the small traders (not shown in chart) are Bearish-Extreme with a score of 12.9 percent.
| LEAN HOGS Futures Statistics | SPECULATORS | COMMERCIALS | SMALL TRADERS |
| – Percent of Open Interest Longs: | 43.2 | 32.5 | 7.8 |
| – Percent of Open Interest Shorts: | 17.8 | 52.2 | 13.6 |
| – Net Position: | 60,363 | -46,665 | -13,698 |
| – Gross Longs: | 102,404 | 76,951 | 18,464 |
| – Gross Shorts: | 42,041 | 123,616 | 32,162 |
| – Long to Short Ratio: | 2.4 to 1 | 0.6 to 1 | 0.6 to 1 |
| NET POSITION TREND: | |||
| – COT Index Score (3 Year Range Pct): | 73.5 | 34.3 | 12.9 |
| – COT Index Reading (3 Year Range): | Bullish | Bearish | Bearish-Extreme |
| NET POSITION MOVEMENT INDEX: | |||
| – 6-Week Change in Strength Index: | -18.6 | 18.0 | 3.2 |
COTTON Futures:
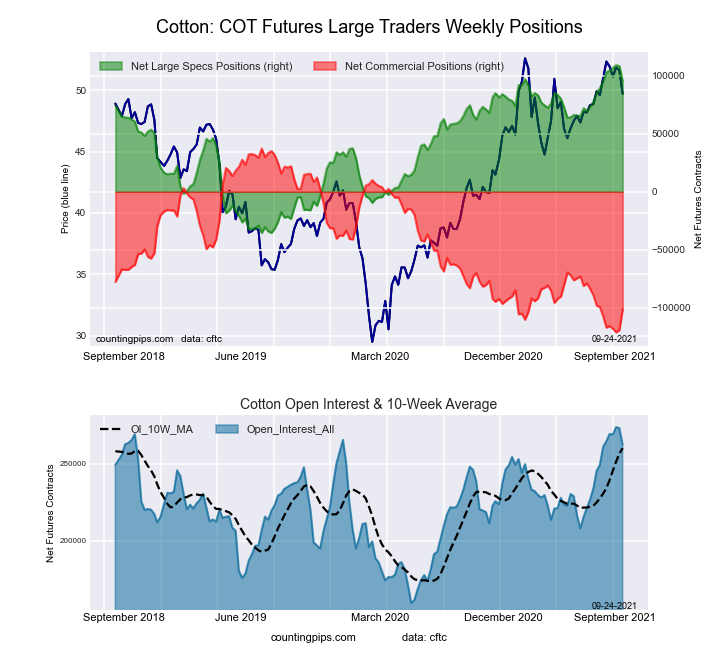 The COTTON large speculator standing this week totaled a net position of 95,025 contracts in the data reported through Tuesday. This was a weekly decline of -13,198 contracts from the previous week which had a total of 108,223 net contracts.
This week’s current strength score (the trader positioning range over the past three years, measured from 0 to 100) shows the speculators are currently Bullish-Extreme with a score of 90.4 percent. The commercials are Bearish-Extreme with a score of 12.4 percent and the small traders (not shown in chart) are Bullish with a score of 52.0 percent.
| COTTON Futures Statistics | SPECULATORS | COMMERCIALS | SMALL TRADERS |
| – Percent of Open Interest Longs: | 43.2 | 36.6 | 6.2 |
| – Percent of Open Interest Shorts: | 7.0 | 75.2 | 3.9 |
| – Net Position: | 95,025 | -101,181 | 6,156 |
| – Gross Longs: | 113,474 | 96,189 | 16,348 |
| – Gross Shorts: | 18,449 | 197,370 | 10,192 |
| – Long to Short Ratio: | 6.2 to 1 | 0.5 to 1 | 1.6 to 1 |
| NET POSITION TREND: | |||
| – COT Index Score (3 Year Range Pct): | 90.4 | 12.4 | 52.0 |
| – COT Index Reading (3 Year Range): | Bullish-Extreme | Bearish-Extreme | Bullish |
| NET POSITION MOVEMENT INDEX: | |||
| – 6-Week Change in Strength Index: | 0.1 | 3.8 | -37.9 |
COCOA Futures:
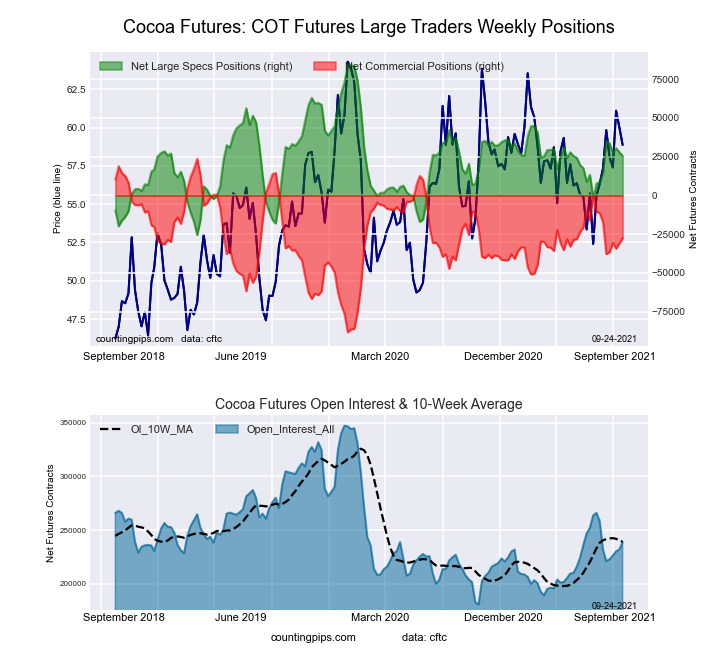 The COCOA large speculator standing this week totaled a net position of 25,439 contracts in the data reported through Tuesday. This was a weekly reduction of -2,597 contracts from the previous week which had a total of 28,036 net contracts.
This week’s current strength score (the trader positioning range over the past three years, measured from 0 to 100) shows the speculators are currently Bearish with a score of 46.5 percent. The commercials are Bullish with a score of 54.2 percent and the small traders (not shown in chart) are Bearish with a score of 33.3 percent.
| COCOA Futures Statistics | SPECULATORS | COMMERCIALS | SMALL TRADERS |
| – Percent of Open Interest Longs: | 29.1 | 51.9 | 4.6 |
| – Percent of Open Interest Shorts: | 18.5 | 63.5 | 3.7 |
| – Net Position: | 25,439 | -27,626 | 2,187 |
| – Gross Longs: | 69,586 | 123,960 | 11,047 |
| – Gross Shorts: | 44,147 | 151,586 | 8,860 |
| – Long to Short Ratio: | 1.6 to 1 | 0.8 to 1 | 1.2 to 1 |
| NET POSITION TREND: | |||
| – COT Index Score (3 Year Range Pct): | 46.5 | 54.2 | 33.3 |
| – COT Index Reading (3 Year Range): | Bearish | Bullish | Bearish |
| NET POSITION MOVEMENT INDEX: | |||
| – 6-Week Change in Strength Index: | 10.2 | -9.3 | -9.0 |
WHEAT Futures:
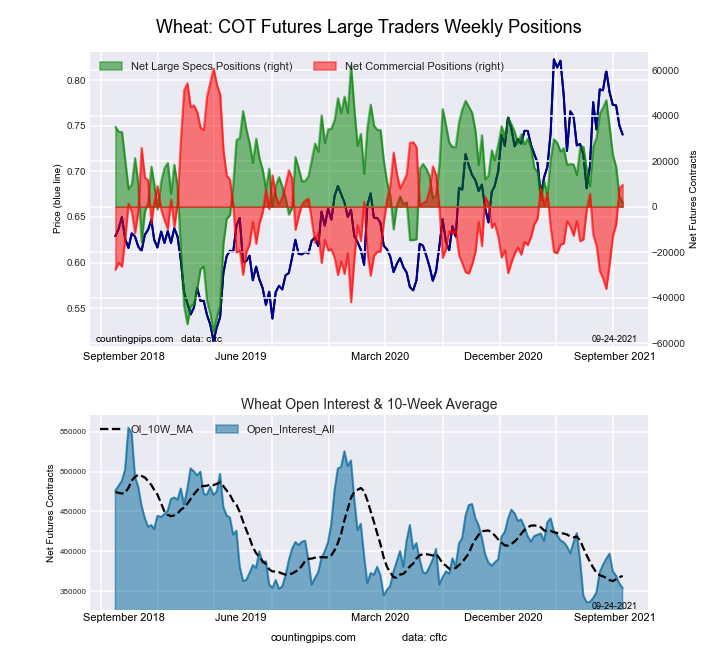 The WHEAT large speculator standing this week totaled a net position of 1,842 contracts in the data reported through Tuesday. This was a weekly fall of -2,732 contracts from the previous week which had a total of 4,574 net contracts.
This week’s current strength score (the trader positioning range over the past three years, measured from 0 to 100) shows the speculators are currently Bearish with a score of 48.6 percent. The commercials are Bullish with a score of 50.2 percent and the small traders (not shown in chart) are Bearish with a score of 46.7 percent.
| WHEAT Futures Statistics | SPECULATORS | COMMERCIALS | SMALL TRADERS |
| – Percent of Open Interest Longs: | 24.5 | 43.4 | 8.0 |
| – Percent of Open Interest Shorts: | 24.0 | 40.7 | 11.2 |
| – Net Position: | 1,842 | 9,654 | -11,496 |
| – Gross Longs: | 86,658 | 153,473 | 28,167 |
| – Gross Shorts: | 84,816 | 143,819 | 39,663 |
| – Long to Short Ratio: | 1.0 to 1 | 1.1 to 1 | 0.7 to 1 |
| NET POSITION TREND: | |||
| – COT Index Score (3 Year Range Pct): | 48.6 | 50.2 | 46.7 |
| – COT Index Reading (3 Year Range): | Bearish | Bullish | Bearish |
| NET POSITION MOVEMENT INDEX: | |||
| – 6-Week Change in Strength Index: | -35.6 | 40.0 | 3.2 |
Article By InvestMacro.com – Receive our weekly COT Reports by Email
*COT Report: The COT data, released weekly to the public each Friday, is updated through the most recent Tuesday (data is 3 days old) and shows a quick view of how large speculators or non-commercials (for-profit traders) were positioned in the futures markets.
The CFTC categorizes trader positions according to commercial hedgers (traders who use futures contracts for hedging as part of the business), non-commercials (large traders who speculate to realize trading profits) and nonreportable traders (usually small traders/speculators).
Find CFTC criteria here: (http://www.cftc.gov/MarketReports/CommitmentsofTraders/ExplanatoryNotes/index.htm).

- COT Metals Charts: Weekly Speculator Bets led by Copper & Steel Jul 18, 2026
- COT Bonds Charts: Weekly Speculator Bets led by 2-Year, SOFR 3M & 5-Year Bonds Jul 18, 2026
- COT Energy Charts: Weekly Speculator Bets led by Brent Oil & Heating Oil Jul 18, 2026
- COT Soft Commodities Charts: Weekly Speculator Bets led by Wheat, Corn & Soybean Meal Jul 18, 2026
- The Bank of Canada kept its interest rate unchanged. Platinum prices reached a three‑week high Jul 16, 2026
- Stock indices rose after the release of US inflation data. China’s GDP slowed sharply Jul 15, 2026
- GBP/USD Awaits Political News: What Will Happen Next Jul 15, 2026
- USD/JPY Holds at Highs: Pressure Lingers on Yen Jul 14, 2026
- Oil prices jumped 4% amid a new wave of escalation between the US and Iran Jul 13, 2026
- EUR/USD: US Inflation Will Determine Everything Jul 13, 2026