
By CountingPips.com COT Home | Data Tables | Data Downloads | Newsletter
Here are the latest charts and statistics for the Commitment of Traders (COT) data published by the Commodities Futures Trading Commission (CFTC).
The latest COT data is updated through Tuesday September 7th 2021 and shows a quick view of how large traders (for-profit speculators and commercial entities) were positioned in the futures markets.
3-Month Eurodollars Futures:
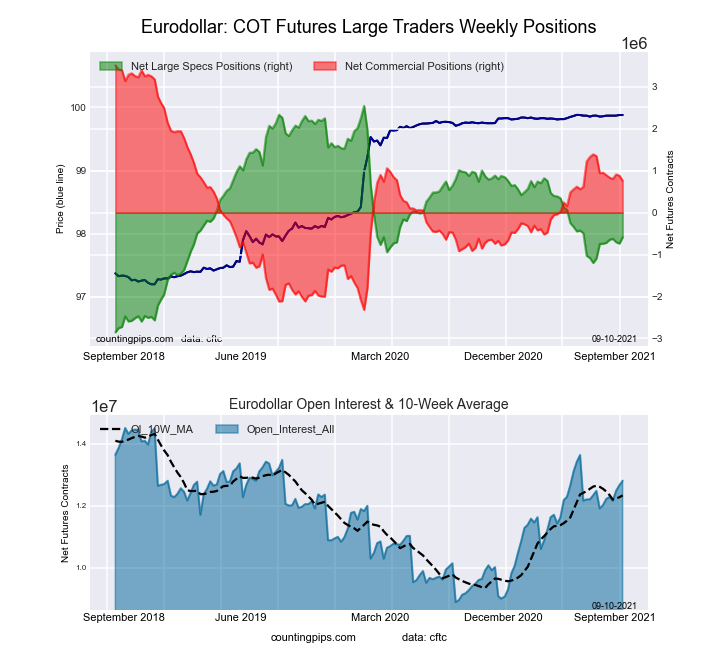 The 3-Month Eurodollars large speculator standing this week came in at a net position of -586,439 contracts in the data reported through Tuesday. This was a weekly gain of 150,353 contracts from the previous week which had a total of -736,792 net contracts.
This week’s current strength score (the trader positioning range over the past three years, measured from 0 to 100) shows the speculators are currently Bearish with a score of 42.0 percent. The commercials are Bullish with a score of 52.8 percent and the small traders (not shown in chart) are Bullish-Extreme with a score of 80.3 percent.
| 3-Month Eurodollars Statistics | SPECULATORS | COMMERCIALS | SMALL TRADERS |
| – Percent of Open Interest Longs: | 16.5 | 59.0 | 5.0 |
| – Percent of Open Interest Shorts: | 21.1 | 53.1 | 6.4 |
| – Net Position: | -586,439 | 759,467 | -173,028 |
| – Gross Longs: | 2,118,472 | 7,556,117 | 643,596 |
| – Gross Shorts: | 2,704,911 | 6,796,650 | 816,624 |
| – Long to Short Ratio: | 0.8 to 1 | 1.1 to 1 | 0.8 to 1 |
| NET POSITION TREND: | |||
| – COT Index Score (3 Year Range Pct): | 42.0 | 52.8 | 80.3 |
| – COT Index Reading (3 Year Range): | Bearish | Bullish | Bullish-Extreme |
| NET POSITION MOVEMENT INDEX: | |||
| – 6-Week Change in Strength Index: | 2.9 | -3.3 | 4.8 |
Free Reports:
 Sign Up for Our Stock Market Newsletter – Get updated on News, Charts & Rankings of Public Companies when you join our Stocks Newsletter
 Get our Weekly Commitment of Traders Reports - See where the biggest traders (Hedge Funds and Commercial Hedgers) are positioned in the futures markets on a weekly basis.
30-Day Federal Funds Futures:
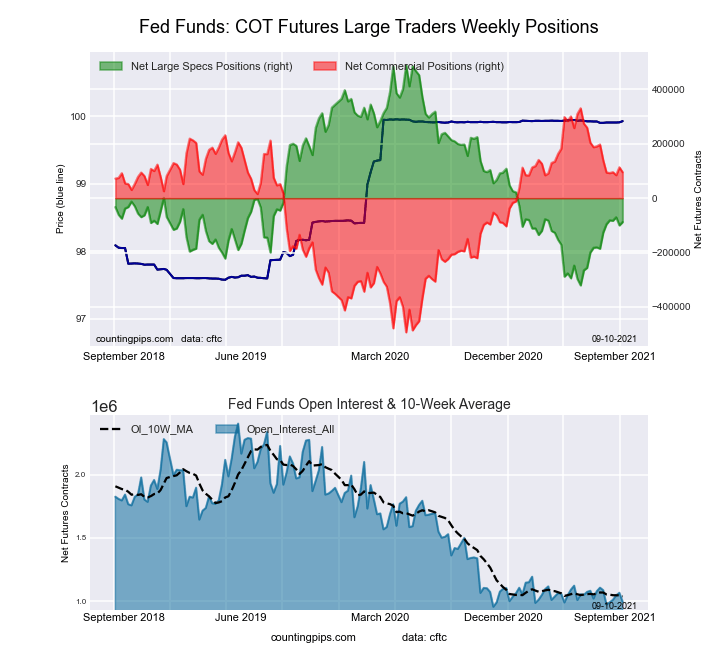 The 30-Day Federal Funds large speculator standing this week came in at a net position of -87,939 contracts in the data reported through Tuesday. This was a weekly gain of 12,346 contracts from the previous week which had a total of -100,285 net contracts.
This week’s current strength score (the trader positioning range over the past three years, measured from 0 to 100) shows the speculators are currently Bearish with a score of 28.8 percent. The commercials are Bullish with a score of 71.4 percent and the small traders (not shown in chart) are Bearish with a score of 49.7 percent.
| 30-Day Federal Funds Statistics | SPECULATORS | COMMERCIALS | SMALL TRADERS |
| – Percent of Open Interest Longs: | 5.3 | 75.6 | 2.6 |
| – Percent of Open Interest Shorts: | 14.1 | 66.0 | 3.3 |
| – Net Position: | -87,939 | 95,213 | -7,274 |
| – Gross Longs: | 52,327 | 752,315 | 25,982 |
| – Gross Shorts: | 140,266 | 657,102 | 33,256 |
| – Long to Short Ratio: | 0.4 to 1 | 1.1 to 1 | 0.8 to 1 |
| NET POSITION TREND: | |||
| – COT Index Score (3 Year Range Pct): | 28.8 | 71.4 | 49.7 |
| – COT Index Reading (3 Year Range): | Bearish | Bullish | Bearish |
| NET POSITION MOVEMENT INDEX: | |||
| – 6-Week Change in Strength Index: | 4.8 | -5.3 | 10.9 |
2-Year Treasury Note Futures:
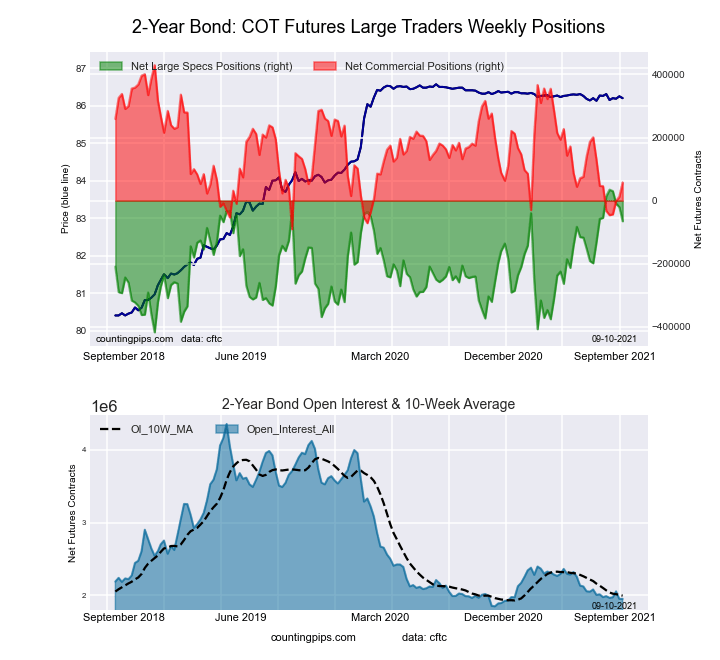 The 2-Year Treasury Note large speculator standing this week came in at a net position of -65,257 contracts in the data reported through Tuesday. This was a weekly fall of -44,687 contracts from the previous week which had a total of -20,570 net contracts.
This week’s current strength score (the trader positioning range over the past three years, measured from 0 to 100) shows the speculators are currently Bullish with a score of 77.9 percent. The commercials are Bearish with a score of 28.5 percent and the small traders (not shown in chart) are Bearish with a score of 33.0 percent.
| 2-Year Treasury Note Statistics | SPECULATORS | COMMERCIALS | SMALL TRADERS |
| – Percent of Open Interest Longs: | 19.4 | 70.4 | 7.3 |
| – Percent of Open Interest Shorts: | 22.7 | 67.4 | 7.0 |
| – Net Position: | -65,257 | 57,753 | 7,504 |
| – Gross Longs: | 377,641 | 1,372,906 | 143,339 |
| – Gross Shorts: | 442,898 | 1,315,153 | 135,835 |
| – Long to Short Ratio: | 0.9 to 1 | 1.0 to 1 | 1.1 to 1 |
| NET POSITION TREND: | |||
| – COT Index Score (3 Year Range Pct): | 77.9 | 28.5 | 33.0 |
| – COT Index Reading (3 Year Range): | Bullish | Bearish | Bearish |
| NET POSITION MOVEMENT INDEX: | |||
| – 6-Week Change in Strength Index: | -2.4 | 2.2 | -0.4 |
5-Year Treasury Note Futures:
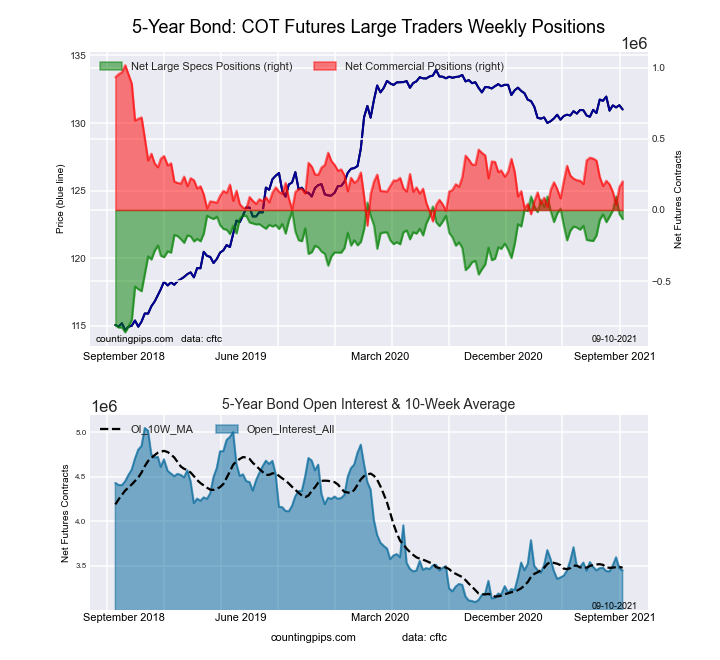 The 5-Year Treasury Note large speculator standing this week came in at a net position of -63,512 contracts in the data reported through Tuesday. This was a weekly decline of -35,376 contracts from the previous week which had a total of -28,136 net contracts.
This week’s current strength score (the trader positioning range over the past three years, measured from 0 to 100) shows the speculators are currently Bullish-Extreme with a score of 83.4 percent. The commercials are Bearish with a score of 27.6 percent and the small traders (not shown in chart) are Bearish-Extreme with a score of 13.0 percent.
| 5-Year Treasury Note Statistics | SPECULATORS | COMMERCIALS | SMALL TRADERS |
| – Percent of Open Interest Longs: | 10.0 | 77.8 | 8.2 |
| – Percent of Open Interest Shorts: | 11.9 | 72.0 | 12.1 |
| – Net Position: | -63,512 | 201,205 | -137,693 |
| – Gross Longs: | 346,413 | 2,683,162 | 281,154 |
| – Gross Shorts: | 409,925 | 2,481,957 | 418,847 |
| – Long to Short Ratio: | 0.8 to 1 | 1.1 to 1 | 0.7 to 1 |
| NET POSITION TREND: | |||
| – COT Index Score (3 Year Range Pct): | 83.4 | 27.6 | 13.0 |
| – COT Index Reading (3 Year Range): | Bullish-Extreme | Bearish | Bearish-Extreme |
| NET POSITION MOVEMENT INDEX: | |||
| – 6-Week Change in Strength Index: | -3.5 | 2.9 | 0.4 |
10-Year Treasury Note Futures:
 The 10-Year Treasury Note large speculator standing this week came in at a net position of 780 contracts in the data reported through Tuesday. This was a weekly boost of 30,599 contracts from the previous week which had a total of -29,819 net contracts.
This week’s current strength score (the trader positioning range over the past three years, measured from 0 to 100) shows the speculators are currently Bullish-Extreme with a score of 81.4 percent. The commercials are Bearish with a score of 39.8 percent and the small traders (not shown in chart) are Bearish-Extreme with a score of 14.2 percent.
| 10-Year Treasury Note Statistics | SPECULATORS | COMMERCIALS | SMALL TRADERS |
| – Percent of Open Interest Longs: | 19.2 | 69.4 | 8.8 |
| – Percent of Open Interest Shorts: | 19.1 | 63.7 | 14.6 |
| – Net Position: | 780 | 225,778 | -226,558 |
| – Gross Longs: | 747,865 | 2,711,723 | 344,871 |
| – Gross Shorts: | 747,085 | 2,485,945 | 571,429 |
| – Long to Short Ratio: | 1.0 to 1 | 1.1 to 1 | 0.6 to 1 |
| NET POSITION TREND: | |||
| – COT Index Score (3 Year Range Pct): | 81.4 | 39.8 | 14.2 |
| – COT Index Reading (3 Year Range): | Bullish-Extreme | Bearish | Bearish-Extreme |
| NET POSITION MOVEMENT INDEX: | |||
| – 6-Week Change in Strength Index: | -17.6 | 18.3 | -6.8 |
Ultra 10-Year Notes Futures:
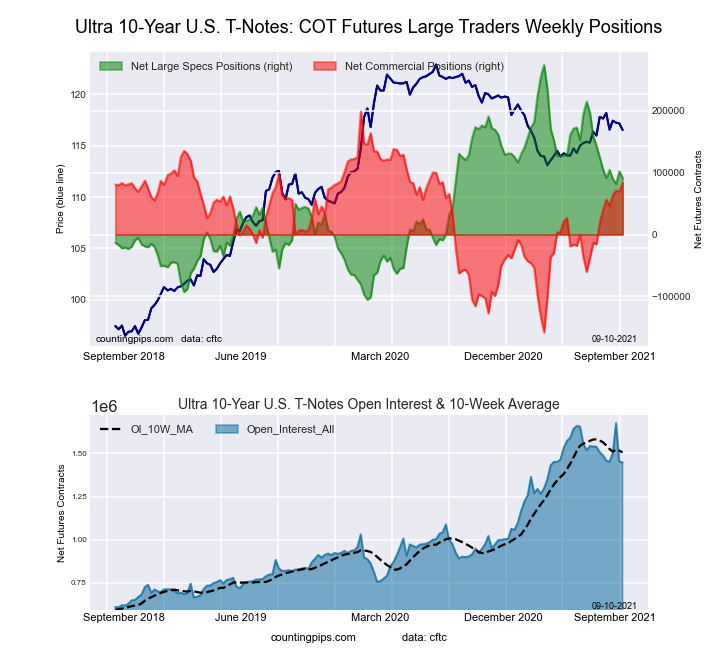 The Ultra 10-Year Notes large speculator standing this week came in at a net position of 91,575 contracts in the data reported through Tuesday. This was a weekly fall of -10,304 contracts from the previous week which had a total of 101,879 net contracts.
This week’s current strength score (the trader positioning range over the past three years, measured from 0 to 100) shows the speculators are currently Bullish with a score of 51.9 percent. The commercials are Bullish with a score of 67.6 percent and the small traders (not shown in chart) are Bearish-Extreme with a score of 0.0 percent.
| Ultra 10-Year Notes Statistics | SPECULATORS | COMMERCIALS | SMALL TRADERS |
| – Percent of Open Interest Longs: | 15.3 | 75.4 | 8.3 |
| – Percent of Open Interest Shorts: | 8.9 | 69.6 | 20.4 |
| – Net Position: | 91,575 | 83,122 | -174,697 |
| – Gross Longs: | 220,804 | 1,090,484 | 119,965 |
| – Gross Shorts: | 129,229 | 1,007,362 | 294,662 |
| – Long to Short Ratio: | 1.7 to 1 | 1.1 to 1 | 0.4 to 1 |
| NET POSITION TREND: | |||
| – COT Index Score (3 Year Range Pct): | 51.9 | 67.6 | 0.0 |
| – COT Index Reading (3 Year Range): | Bullish | Bullish | Bearish-Extreme |
| NET POSITION MOVEMENT INDEX: | |||
| – 6-Week Change in Strength Index: | -3.7 | 12.3 | -20.1 |
US Treasury Bonds Futures:
 The US Treasury Bonds large speculator standing this week came in at a net position of -83,571 contracts in the data reported through Tuesday. This was a weekly boost of 20,639 contracts from the previous week which had a total of -104,210 net contracts.
This week’s current strength score (the trader positioning range over the past three years, measured from 0 to 100) shows the speculators are currently Bullish with a score of 63.4 percent. The commercials are Bearish with a score of 47.7 percent and the small traders (not shown in chart) are Bullish with a score of 50.2 percent.
| US Treasury Bonds Statistics | SPECULATORS | COMMERCIALS | SMALL TRADERS |
| – Percent of Open Interest Longs: | 10.8 | 72.4 | 15.1 |
| – Percent of Open Interest Shorts: | 17.6 | 65.3 | 15.4 |
| – Net Position: | -83,571 | 86,594 | -3,023 |
| – Gross Longs: | 130,380 | 877,928 | 183,178 |
| – Gross Shorts: | 213,951 | 791,334 | 186,201 |
| – Long to Short Ratio: | 0.6 to 1 | 1.1 to 1 | 1.0 to 1 |
| NET POSITION TREND: | |||
| – COT Index Score (3 Year Range Pct): | 63.4 | 47.7 | 50.2 |
| – COT Index Reading (3 Year Range): | Bullish | Bearish | Bullish |
| NET POSITION MOVEMENT INDEX: | |||
| – 6-Week Change in Strength Index: | -0.2 | 6.3 | -15.2 |
Ultra US Treasury Bonds Futures:
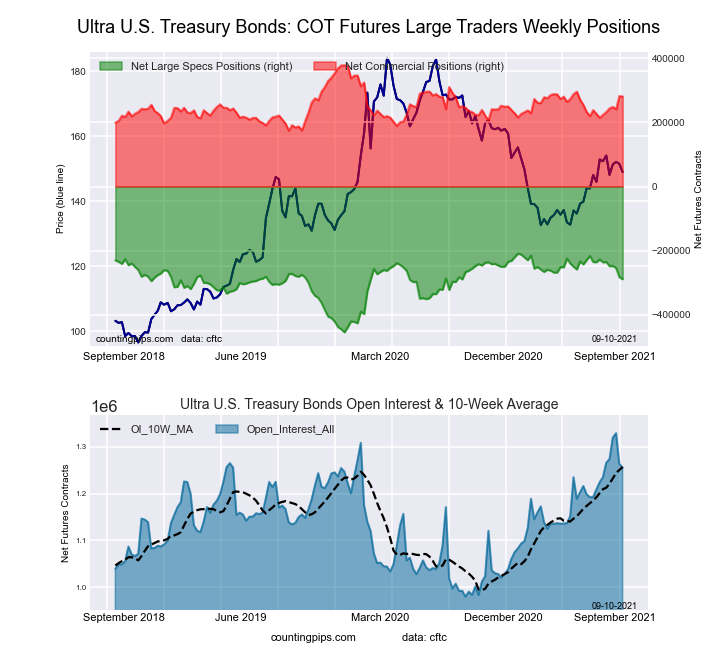 The Ultra US Treasury Bonds large speculator standing this week came in at a net position of -288,599 contracts in the data reported through Tuesday. This was a weekly lowering of -6,224 contracts from the previous week which had a total of -282,375 net contracts.
This week’s current strength score (the trader positioning range over the past three years, measured from 0 to 100) shows the speculators are currently Bullish with a score of 67.5 percent. The commercials are Bullish with a score of 52.3 percent and the small traders (not shown in chart) are Bearish with a score of 34.0 percent.
| Ultra US Treasury Bonds Statistics | SPECULATORS | COMMERCIALS | SMALL TRADERS |
| – Percent of Open Interest Longs: | 7.3 | 77.7 | 12.3 |
| – Percent of Open Interest Shorts: | 30.3 | 55.4 | 11.6 |
| – Net Position: | -288,599 | 280,674 | 7,925 |
| – Gross Longs: | 91,722 | 975,782 | 154,116 |
| – Gross Shorts: | 380,321 | 695,108 | 146,191 |
| – Long to Short Ratio: | 0.2 to 1 | 1.4 to 1 | 1.1 to 1 |
| NET POSITION TREND: | |||
| – COT Index Score (3 Year Range Pct): | 67.5 | 52.3 | 34.0 |
| – COT Index Reading (3 Year Range): | Bullish | Bullish | Bearish |
| NET POSITION MOVEMENT INDEX: | |||
| – 6-Week Change in Strength Index: | -21.4 | 28.1 | -3.5 |
Article By CountingPips.com – Receive our weekly COT Reports by Email
*COT Report: The COT data, released weekly to the public each Friday, is updated through the most recent Tuesday (data is 3 days old) and shows a quick view of how large speculators or non-commercials (for-profit traders) were positioned in the futures markets.
The CFTC categorizes trader positions according to commercial hedgers (traders who use futures contracts for hedging as part of the business), non-commercials (large traders who speculate to realize trading profits) and nonreportable traders (usually small traders/speculators).
Find CFTC criteria here: (http://www.cftc.gov/MarketReports/CommitmentsofTraders/ExplanatoryNotes/index.htm).

- Geopolitical and macroeconomic conditions continue to pressure market sentiment Jul 20, 2026
- USD/JPY Poised to Continue Gains as Expensive Oil and Lack of Support Weigh on Yen Jul 20, 2026
- COT Metals Charts: Weekly Speculator Bets led by Copper & Steel Jul 18, 2026
- COT Bonds Charts: Weekly Speculator Bets led by 2-Year, SOFR 3M & 5-Year Bonds Jul 18, 2026
- COT Energy Charts: Weekly Speculator Bets led by Brent Oil & Heating Oil Jul 18, 2026
- COT Soft Commodities Charts: Weekly Speculator Bets led by Wheat, Corn & Soybean Meal Jul 18, 2026
- The Bank of Canada kept its interest rate unchanged. Platinum prices reached a three‑week high Jul 16, 2026
- Stock indices rose after the release of US inflation data. China’s GDP slowed sharply Jul 15, 2026
- GBP/USD Awaits Political News: What Will Happen Next Jul 15, 2026
- USD/JPY Holds at Highs: Pressure Lingers on Yen Jul 14, 2026