
By CountingPips.com COT Home | Data Tables | Data Downloads | Newsletter
Here are the latest charts and statistics for the Commitment of Traders (COT) data published by the Commodities Futures Trading Commission (CFTC).
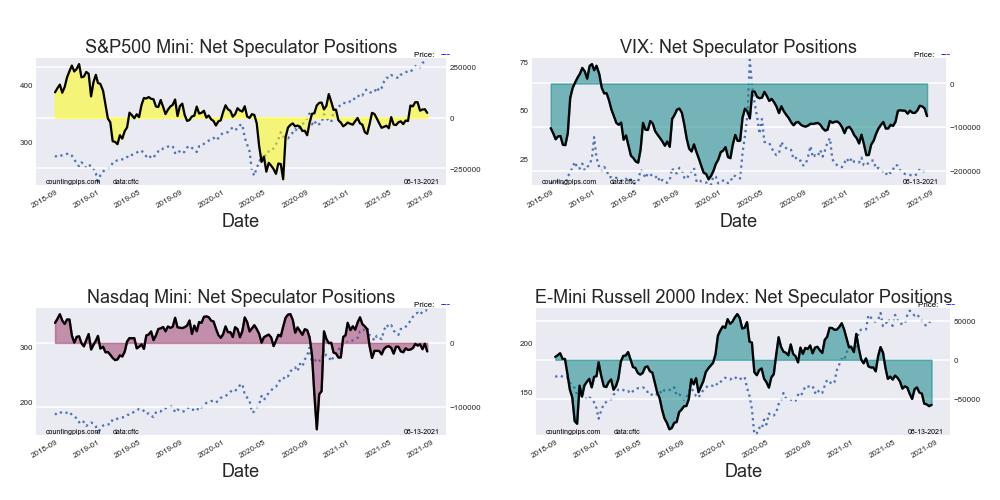
The latest COT data is updated through Tuesday August 10 2021 and shows a quick view of how large traders (for-profit speculators and commercial entities) were positioned in the futures markets.
VIX Volatility Futures:
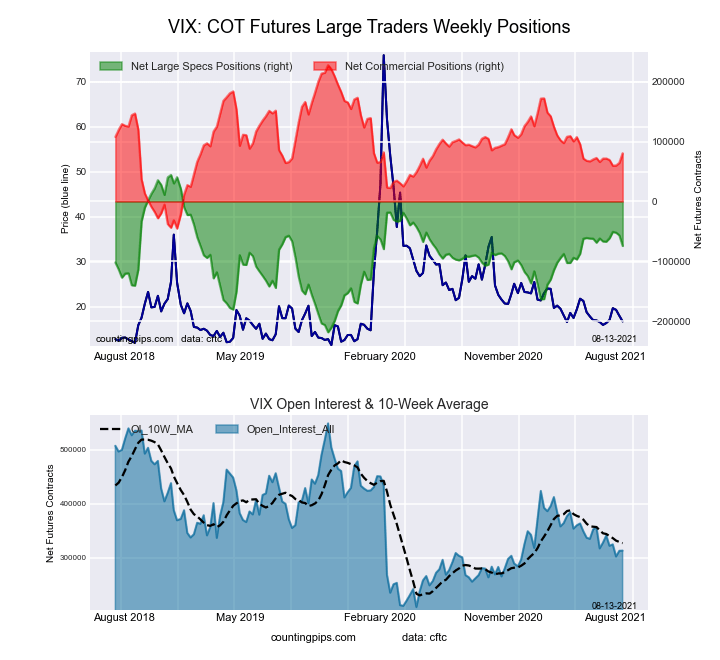 The VIX Volatility large speculator standing this week totaled a net position of -74,251 contracts in the data reported through Tuesday. This was a weekly fall of -17,684 contracts from the previous week which had a total of -56,567 net contracts.
This week’s current strength score (the trader positioning range over the past three years, measured from 0 to 100) shows the speculators are currently Bullish with a score of 54.9 percent. The commercials are Bearish with a score of 46.1 percent and the small traders (not shown in chart) are Bearish with a score of 32.8 percent.
Free Reports:
 Download Our Metatrader 4 Indicators – Put Our Free MetaTrader 4 Custom Indicators on your charts when you join our Weekly Newsletter
 Get our Weekly Commitment of Traders Reports - See where the biggest traders (Hedge Funds and Commercial Hedgers) are positioned in the futures markets on a weekly basis.
| VIX Volatility Futures Statistics | SPECULATORS | COMMERCIALS | SMALL TRADERS |
| – Percent of Open Interest Longs: | 18.8 | 55.0 | 6.9 |
| – Percent of Open Interest Shorts: | 42.5 | 29.3 | 8.9 |
| – Net Position: | -74,251 | 80,481 | -6,230 |
| – Gross Longs: | 58,742 | 172,327 | 21,703 |
| – Gross Shorts: | 132,993 | 91,846 | 27,933 |
| – Long to Short Ratio: | 0.4 to 1 | 1.9 to 1 | 0.8 to 1 |
| NET POSITION TREND: | |||
| – COT Index Score (3 Year Range Pct): | 54.9 | 46.1 | 32.8 |
| – COT Index Reading (3 Year Range): | Bullish | Bearish | Bearish |
| NET POSITION MOVEMENT INDEX: | |||
| – 6-Week Change in Strength Index: | -2.9 | 3.3 | -5.4 |
S&P500 Mini Futures:
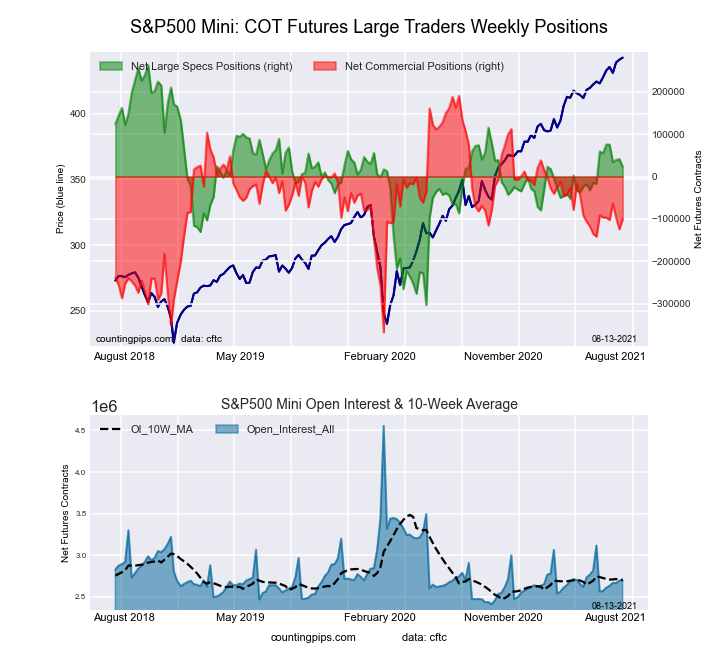 The S&P500 Mini large speculator standing this week totaled a net position of 23,111 contracts in the data reported through Tuesday. This was a weekly decline of -18,155 contracts from the previous week which had a total of 41,266 net contracts.
This week’s current strength score (the trader positioning range over the past three years, measured from 0 to 100) shows the speculators are currently Bullish with a score of 57.6 percent. The commercials are Bearish with a score of 47.9 percent and the small traders (not shown in chart) are Bearish with a score of 42.6 percent.
| S&P500 Mini Futures Statistics | SPECULATORS | COMMERCIALS | SMALL TRADERS |
| – Percent of Open Interest Longs: | 16.3 | 68.2 | 12.1 |
| – Percent of Open Interest Shorts: | 15.4 | 71.9 | 9.3 |
| – Net Position: | 23,111 | -100,445 | 77,334 |
| – Gross Longs: | 438,866 | 1,839,250 | 327,602 |
| – Gross Shorts: | 415,755 | 1,939,695 | 250,268 |
| – Long to Short Ratio: | 1.1 to 1 | 0.9 to 1 | 1.3 to 1 |
| NET POSITION TREND: | |||
| – COT Index Score (3 Year Range Pct): | 57.6 | 47.9 | 42.6 |
| – COT Index Reading (3 Year Range): | Bullish | Bearish | Bearish |
| NET POSITION MOVEMENT INDEX: | |||
| – 6-Week Change in Strength Index: | -5.7 | -0.7 | 7.5 |
Dow Jones Mini Futures:
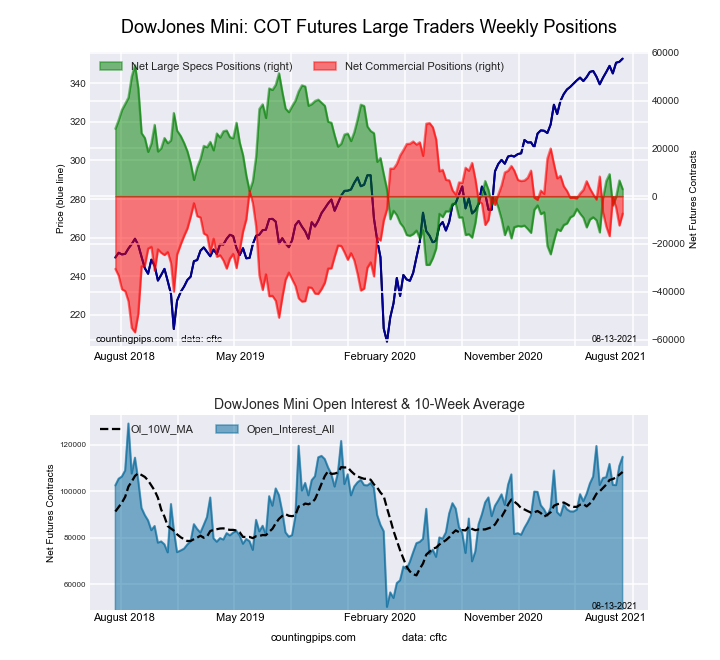 The Dow Jones Mini large speculator standing this week totaled a net position of 2,888 contracts in the data reported through Tuesday. This was a weekly lowering of -3,693 contracts from the previous week which had a total of 6,581 net contracts.
This week’s current strength score (the trader positioning range over the past three years, measured from 0 to 100) shows the speculators are currently Bearish with a score of 37.9 percent. The commercials are Bullish with a score of 56.7 percent and the small traders (not shown in chart) are Bullish with a score of 62.1 percent.
| Dow Jones Mini Futures Statistics | SPECULATORS | COMMERCIALS | SMALL TRADERS |
| – Percent of Open Interest Longs: | 40.9 | 41.4 | 15.3 |
| – Percent of Open Interest Shorts: | 38.3 | 47.7 | 11.5 |
| – Net Position: | 2,888 | -7,310 | 4,422 |
| – Gross Longs: | 46,893 | 47,483 | 17,584 |
| – Gross Shorts: | 44,005 | 54,793 | 13,162 |
| – Long to Short Ratio: | 1.1 to 1 | 0.9 to 1 | 1.3 to 1 |
| NET POSITION TREND: | |||
| – COT Index Score (3 Year Range Pct): | 37.9 | 56.7 | 62.1 |
| – COT Index Reading (3 Year Range): | Bearish | Bullish | Bullish |
| NET POSITION MOVEMENT INDEX: | |||
| – 6-Week Change in Strength Index: | 4.4 | -0.5 | -17.3 |
Nasdaq Mini Futures:
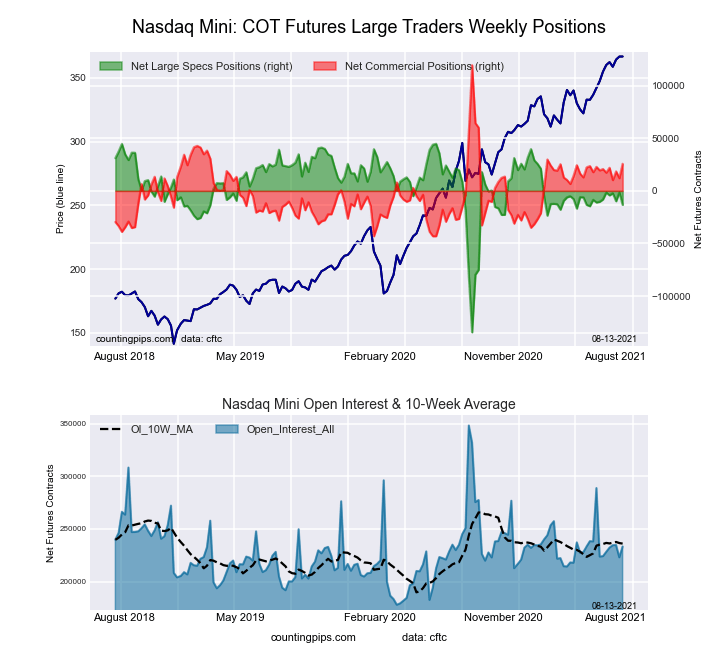 The Nasdaq Mini large speculator standing this week totaled a net position of -13,269 contracts in the data reported through Tuesday. This was a weekly reduction of -11,803 contracts from the previous week which had a total of -1,466 net contracts.
This week’s current strength score (the trader positioning range over the past three years, measured from 0 to 100) shows the speculators are currently Bullish with a score of 67.6 percent. The commercials are Bearish with a score of 42.3 percent and the small traders (not shown in chart) are Bearish-Extreme with a score of 16.1 percent.
| Nasdaq Mini Futures Statistics | SPECULATORS | COMMERCIALS | SMALL TRADERS |
| – Percent of Open Interest Longs: | 25.1 | 57.2 | 14.6 |
| – Percent of Open Interest Shorts: | 30.8 | 46.2 | 19.9 |
| – Net Position: | -13,269 | 25,706 | -12,437 |
| – Gross Longs: | 58,502 | 133,533 | 34,086 |
| – Gross Shorts: | 71,771 | 107,827 | 46,523 |
| – Long to Short Ratio: | 0.8 to 1 | 1.2 to 1 | 0.7 to 1 |
| NET POSITION TREND: | |||
| – COT Index Score (3 Year Range Pct): | 67.6 | 42.3 | 16.1 |
| – COT Index Reading (3 Year Range): | Bullish | Bearish | Bearish-Extreme |
| NET POSITION MOVEMENT INDEX: | |||
| – 6-Week Change in Strength Index: | -2.9 | 3.1 | 0.4 |
Russell 2000 Mini Futures:
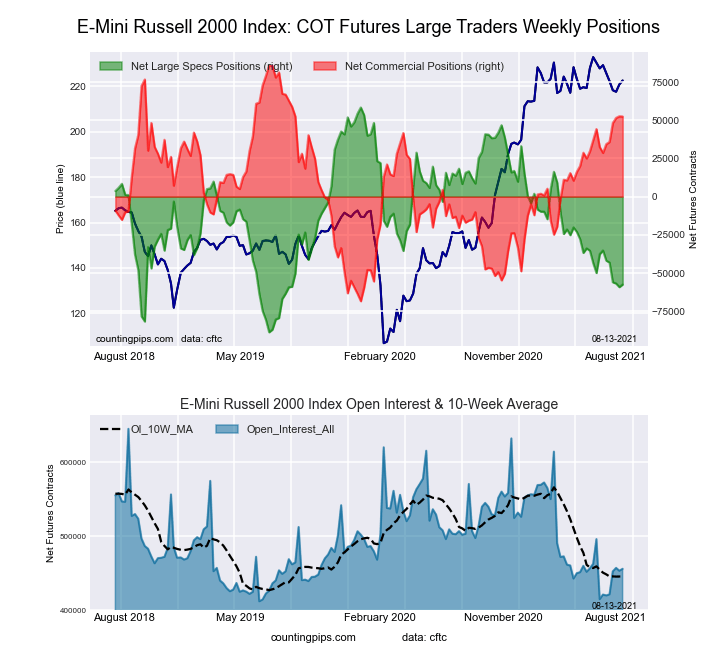 The Russell 2000 Mini large speculator standing this week totaled a net position of -57,535 contracts in the data reported through Tuesday. This was a weekly lift of 1,676 contracts from the previous week which had a total of -59,211 net contracts.
This week’s current strength score (the trader positioning range over the past three years, measured from 0 to 100) shows the speculators are currently Bearish with a score of 21.2 percent. The commercials are Bullish with a score of 78.3 percent and the small traders (not shown in chart) are Bearish with a score of 47.4 percent.
| Russell 2000 Mini Futures Statistics | SPECULATORS | COMMERCIALS | SMALL TRADERS |
| – Percent of Open Interest Longs: | 13.8 | 79.1 | 6.0 |
| – Percent of Open Interest Shorts: | 26.4 | 67.6 | 4.9 |
| – Net Position: | -57,535 | 52,438 | 5,097 |
| – Gross Longs: | 62,990 | 360,431 | 27,283 |
| – Gross Shorts: | 120,525 | 307,993 | 22,186 |
| – Long to Short Ratio: | 0.5 to 1 | 1.2 to 1 | 1.2 to 1 |
| NET POSITION TREND: | |||
| – COT Index Score (3 Year Range Pct): | 21.2 | 78.3 | 47.4 |
| – COT Index Reading (3 Year Range): | Bearish | Bullish | Bearish |
| NET POSITION MOVEMENT INDEX: | |||
| – 6-Week Change in Strength Index: | -15.2 | 15.4 | -4.3 |
Nikkei Stock Average (USD) Futures:
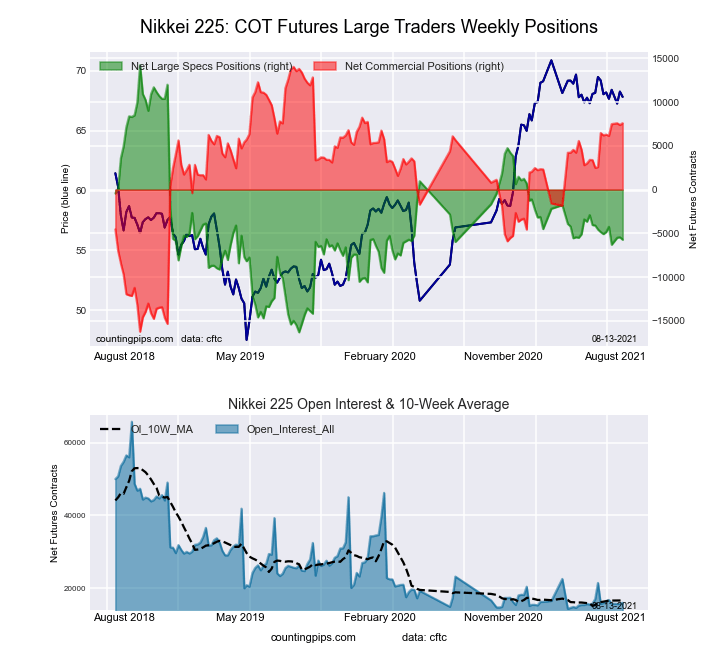 The Nikkei Stock Average (USD) large speculator standing this week totaled a net position of -5,722 contracts in the data reported through Tuesday. This was a weekly reduction of -282 contracts from the previous week which had a total of -5,440 net contracts.
This week’s current strength score (the trader positioning range over the past three years, measured from 0 to 100) shows the speculators are currently Bearish with a score of 34.7 percent. The commercials are Bullish with a score of 78.7 percent and the small traders (not shown in chart) are Bearish-Extreme with a score of 2.5 percent.
| Nikkei Stock Average Futures Statistics | SPECULATORS | COMMERCIALS | SMALL TRADERS |
| – Percent of Open Interest Longs: | 14.5 | 62.4 | 23.1 |
| – Percent of Open Interest Shorts: | 50.2 | 15.0 | 34.8 |
| – Net Position: | -5,722 | 7,588 | -1,866 |
| – Gross Longs: | 2,314 | 9,987 | 3,704 |
| – Gross Shorts: | 8,036 | 2,399 | 5,570 |
| – Long to Short Ratio: | 0.3 to 1 | 4.2 to 1 | 0.7 to 1 |
| NET POSITION TREND: | |||
| – COT Index Score (3 Year Range Pct): | 34.7 | 78.7 | 2.5 |
| – COT Index Reading (3 Year Range): | Bearish | Bullish | Bearish-Extreme |
| NET POSITION MOVEMENT INDEX: | |||
| – 6-Week Change in Strength Index: | -2.1 | 4.6 | -8.3 |
MSCI EAFE Mini Futures:
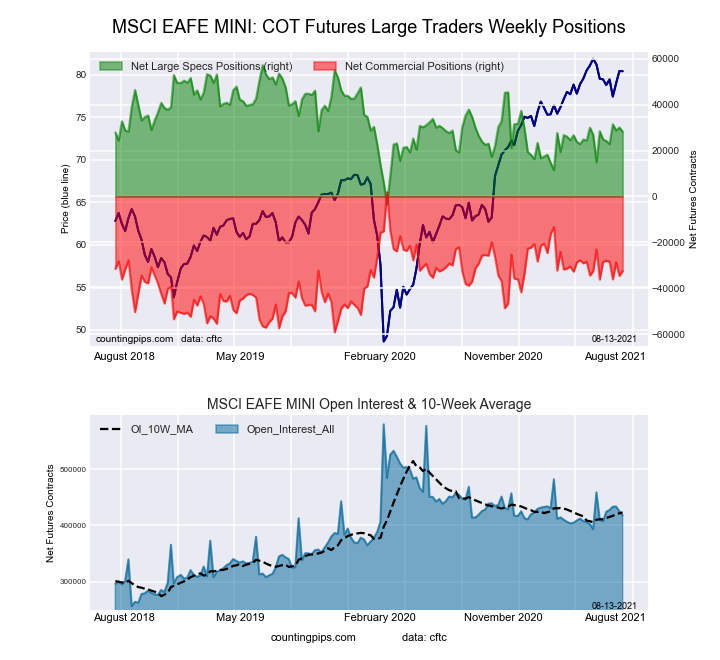 The MSCI EAFE Mini large speculator standing this week totaled a net position of 28,200 contracts in the data reported through Tuesday. This was a weekly lowering of -1,857 contracts from the previous week which had a total of 30,057 net contracts.
This week’s current strength score (the trader positioning range over the past three years, measured from 0 to 100) shows the speculators are currently Bullish with a score of 52.2 percent. The commercials are Bearish with a score of 43.7 percent and the small traders (not shown in chart) are Bullish with a score of 54.9 percent.
| MSCI EAFE Mini Futures Statistics | SPECULATORS | COMMERCIALS | SMALL TRADERS |
| – Percent of Open Interest Longs: | 10.2 | 87.0 | 2.5 |
| – Percent of Open Interest Shorts: | 3.5 | 94.8 | 1.4 |
| – Net Position: | 28,200 | -32,497 | 4,297 |
| – Gross Longs: | 42,623 | 363,434 | 10,247 |
| – Gross Shorts: | 14,423 | 395,931 | 5,950 |
| – Long to Short Ratio: | 3.0 to 1 | 0.9 to 1 | 1.7 to 1 |
| NET POSITION TREND: | |||
| – COT Index Score (3 Year Range Pct): | 52.2 | 43.7 | 54.9 |
| – COT Index Reading (3 Year Range): | Bullish | Bearish | Bullish |
| NET POSITION MOVEMENT INDEX: | |||
| – 6-Week Change in Strength Index: | 5.5 | -6.5 | 5.9 |
MSCI Emerging Mkts Mini Futures:
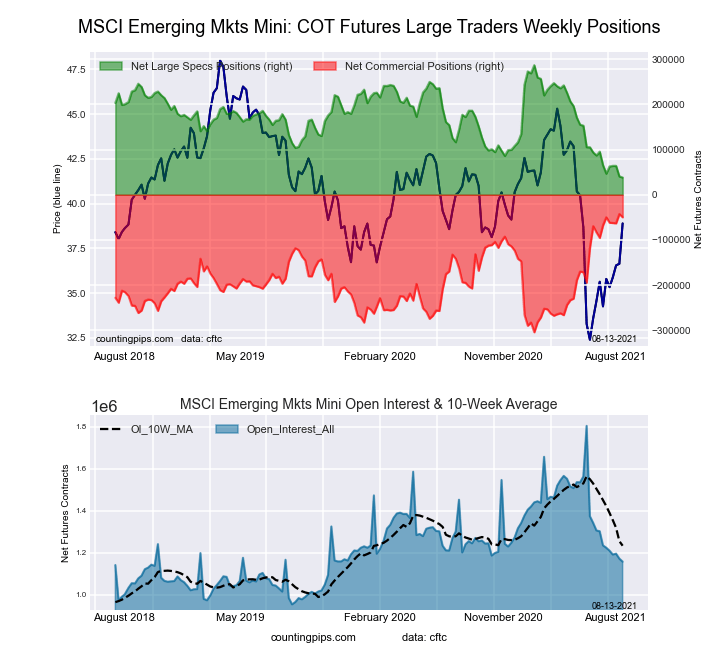 The MSCI Emerging Mkts Mini large speculator standing this week totaled a net position of 38,211 contracts in the data reported through Tuesday. This was a weekly decline of -2,219 contracts from the previous week which had a total of 40,430 net contracts.
This week’s current strength score (the trader positioning range over the past three years, measured from 0 to 100) shows the speculators are currently Bearish-Extreme with a score of 0.0 percent. The commercials are Bullish-Extreme with a score of 97.2 percent and the small traders (not shown in chart) are Bearish with a score of 40.4 percent.
| MSCI Emerging Mkts Mini Futures Statistics | SPECULATORS | COMMERCIALS | SMALL TRADERS |
| – Percent of Open Interest Longs: | 14.3 | 82.2 | 2.4 |
| – Percent of Open Interest Shorts: | 11.0 | 86.5 | 1.3 |
| – Net Position: | 38,211 | -49,886 | 11,675 |
| – Gross Longs: | 165,150 | 950,685 | 27,250 |
| – Gross Shorts: | 126,939 | 1,000,571 | 15,575 |
| – Long to Short Ratio: | 1.3 to 1 | 1.0 to 1 | 1.7 to 1 |
| NET POSITION TREND: | |||
| – COT Index Score (3 Year Range Pct): | 0.0 | 97.2 | 40.4 |
| – COT Index Reading (3 Year Range): | Bearish-Extreme | Bullish-Extreme | Bearish |
| NET POSITION MOVEMENT INDEX: | |||
| – 6-Week Change in Strength Index: | -11.0 | 6.8 | 7.3 |
Article By CountingPips.com – Receive our weekly COT Reports by Email
*COT Report: The COT data, released weekly to the public each Friday, is updated through the most recent Tuesday (data is 3 days old) and shows a quick view of how large speculators or non-commercials (for-profit traders) were positioned in the futures markets.
The CFTC categorizes trader positions according to commercial hedgers (traders who use futures contracts for hedging as part of the business), non-commercials (large traders who speculate to realize trading profits) and nonreportable traders (usually small traders/speculators).
Find CFTC criteria here: (http://www.cftc.gov/MarketReports/CommitmentsofTraders/ExplanatoryNotes/index.htm).

- The Tech‑heavy NASDAQ Index jumped by more than 3.3%. The offshore yuan is trading at its highest level since 2023 Jul 31, 2026
- USD/JPY After Volatility: Multiple Events in One Day Jul 31, 2026
- The US indices sell off amid renewed US-Iran clashes. Oil jumps by 7% Jul 30, 2026
- USD/JPY Temporary in Equilibrium: Multiple Factors in Focus Jul 30, 2026
- GBP/USD at Month’s Lows: The Outlook Remains Weak Jul 29, 2026
- Crude oil falls below $80 per barrel. Australia sees inflation slowdown Jul 29, 2026
- The US Tech sector hit by sell‑off. Oil prices decline on renewed negotiations Jul 28, 2026
- Gold Declines, Focus on Fed and Falling Oil Prices Jul 28, 2026
- This week will be one of the most crowded for central‑bank meetings Jul 27, 2026
- EUR/USD Ahead of a Key Week: Holding Near Lows Jul 27, 2026