
By CountingPips.com COT Home | Data Tables | Data Downloads | Newsletter
Here are the latest charts and statistics for the Commitment of Traders (COT) data published by the Commodities Futures Trading Commission (CFTC).
The latest COT data is updated through Tuesday August 10 2021 and shows a quick view of how large traders (for-profit speculators and commercial entities) were positioned in the futures markets.
CORN Futures:
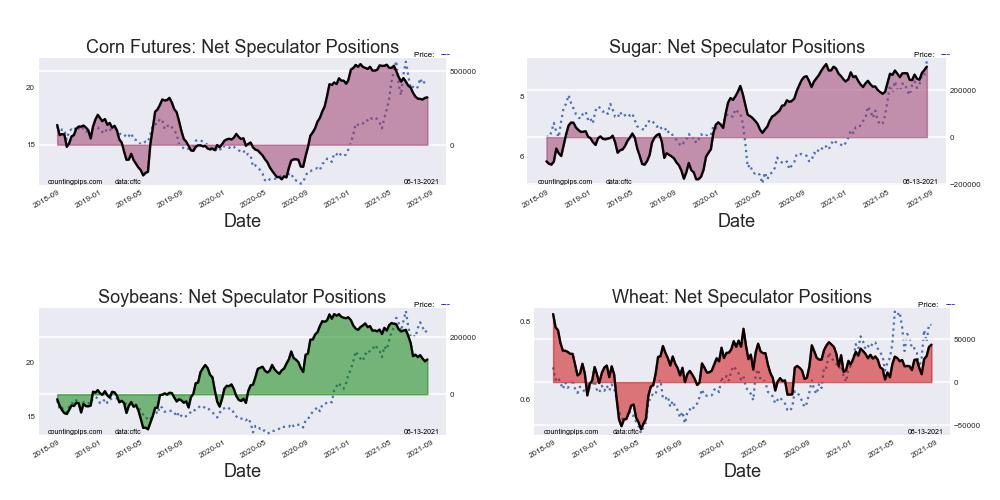
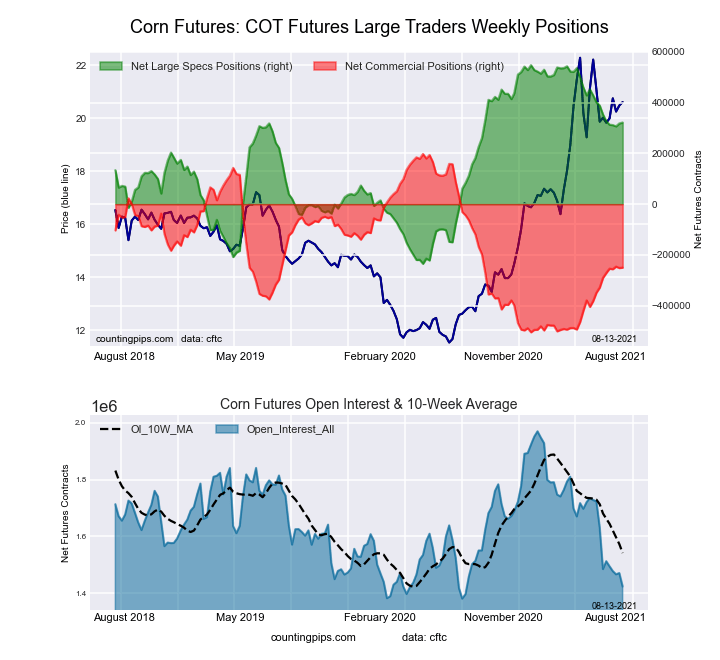 The CORN large speculator standing this week equaled a net position of 321,559 contracts in the data reported through Tuesday. This was a weekly rise of 3,516 contracts from the previous week which had a total of 318,043 net contracts.
This week’s current strength score (the trader positioning range over the past three years, measured from 0 to 100) shows the speculators are currently Bullish with a score of 71.1 percent. The commercials are Bearish with a score of 36.3 percent and the small traders (not shown in chart) are Bearish-Extreme with a score of 0.0 percent.
| CORN Futures Statistics | SPECULATORS | COMMERCIALS | SMALL TRADERS |
| – Percent of Open Interest Longs: | 28.9 | 48.4 | 8.6 |
| – Percent of Open Interest Shorts: | 6.4 | 66.0 | 13.6 |
| – Net Position: | 321,559 | -250,300 | -71,259 |
| – Gross Longs: | 412,203 | 689,370 | 122,560 |
| – Gross Shorts: | 90,644 | 939,670 | 193,819 |
| – Long to Short Ratio: | 4.5 to 1 | 0.7 to 1 | 0.6 to 1 |
| NET POSITION TREND: | |||
| – COT Index Score (3 Year Range Pct): | 71.1 | 36.3 | 0.0 |
| – COT Index Reading (3 Year Range): | Bullish | Bearish | Bearish-Extreme |
| NET POSITION MOVEMENT INDEX: | |||
| – 6-Week Change in Strength Index: | -4.0 | 5.7 | -5.1 |
Free Reports:
 Get our Weekly Commitment of Traders Reports - See where the biggest traders (Hedge Funds and Commercial Hedgers) are positioned in the futures markets on a weekly basis.
 Download Our Metatrader 4 Indicators – Put Our Free MetaTrader 4 Custom Indicators on your charts when you join our Weekly Newsletter
SUGAR Futures:
 The SUGAR large speculator standing this week equaled a net position of 297,421 contracts in the data reported through Tuesday. This was a weekly rise of 14,134 contracts from the previous week which had a total of 283,287 net contracts.
This week’s current strength score (the trader positioning range over the past three years, measured from 0 to 100) shows the speculators are currently Bullish-Extreme with a score of 97.7 percent. The commercials are Bearish-Extreme with a score of 1.5 percent and the small traders (not shown in chart) are Bullish with a score of 74.6 percent.
| SUGAR Futures Statistics | SPECULATORS | COMMERCIALS | SMALL TRADERS |
| – Percent of Open Interest Longs: | 33.6 | 41.8 | 9.5 |
| – Percent of Open Interest Shorts: | 3.8 | 77.0 | 4.1 |
| – Net Position: | 297,421 | -351,385 | 53,964 |
| – Gross Longs: | 335,075 | 417,712 | 95,057 |
| – Gross Shorts: | 37,654 | 769,097 | 41,093 |
| – Long to Short Ratio: | 8.9 to 1 | 0.5 to 1 | 2.3 to 1 |
| NET POSITION TREND: | |||
| – COT Index Score (3 Year Range Pct): | 97.7 | 1.5 | 74.6 |
| – COT Index Reading (3 Year Range): | Bullish-Extreme | Bearish-Extreme | Bullish |
| NET POSITION MOVEMENT INDEX: | |||
| – 6-Week Change in Strength Index: | 11.6 | -12.9 | 13.9 |
COFFEE Futures:
 The COFFEE large speculator standing this week equaled a net position of 52,266 contracts in the data reported through Tuesday. This was a weekly lowering of -2,757 contracts from the previous week which had a total of 55,023 net contracts.
This week’s current strength score (the trader positioning range over the past three years, measured from 0 to 100) shows the speculators are currently Bullish-Extreme with a score of 89.1 percent. The commercials are Bearish-Extreme with a score of 11.5 percent and the small traders (not shown in chart) are Bearish with a score of 25.4 percent.
| COFFEE Futures Statistics | SPECULATORS | COMMERCIALS | SMALL TRADERS |
| – Percent of Open Interest Longs: | 24.9 | 47.1 | 4.0 |
| – Percent of Open Interest Shorts: | 6.9 | 67.0 | 2.2 |
| – Net Position: | 52,266 | -57,615 | 5,349 |
| – Gross Longs: | 72,187 | 136,272 | 11,716 |
| – Gross Shorts: | 19,921 | 193,887 | 6,367 |
| – Long to Short Ratio: | 3.6 to 1 | 0.7 to 1 | 1.8 to 1 |
| NET POSITION TREND: | |||
| – COT Index Score (3 Year Range Pct): | 89.1 | 11.5 | 25.4 |
| – COT Index Reading (3 Year Range): | Bullish-Extreme | Bearish-Extreme | Bearish |
| NET POSITION MOVEMENT INDEX: | |||
| – 6-Week Change in Strength Index: | -5.1 | 5.3 | -0.6 |
SOYBEANS Futures:
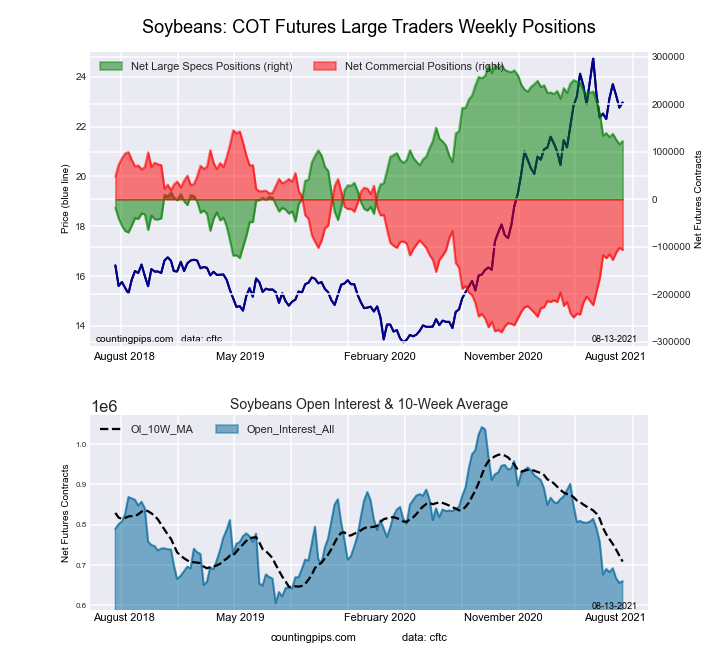 The SOYBEANS large speculator standing this week equaled a net position of 122,396 contracts in the data reported through Tuesday. This was a weekly lift of 6,593 contracts from the previous week which had a total of 115,803 net contracts.
This week’s current strength score (the trader positioning range over the past three years, measured from 0 to 100) shows the speculators are currently Bullish with a score of 60.6 percent. The commercials are Bearish with a score of 40.8 percent and the small traders (not shown in chart) are Bearish with a score of 45.3 percent.
| SOYBEANS Futures Statistics | SPECULATORS | COMMERCIALS | SMALL TRADERS |
| – Percent of Open Interest Longs: | 27.7 | 50.4 | 6.9 |
| – Percent of Open Interest Shorts: | 9.2 | 66.6 | 9.3 |
| – Net Position: | 122,396 | -106,486 | -15,910 |
| – Gross Longs: | 183,135 | 332,870 | 45,764 |
| – Gross Shorts: | 60,739 | 439,356 | 61,674 |
| – Long to Short Ratio: | 3.0 to 1 | 0.8 to 1 | 0.7 to 1 |
| NET POSITION TREND: | |||
| – COT Index Score (3 Year Range Pct): | 60.6 | 40.8 | 45.3 |
| – COT Index Reading (3 Year Range): | Bullish | Bearish | Bearish |
| NET POSITION MOVEMENT INDEX: | |||
| – 6-Week Change in Strength Index: | -2.9 | 2.6 | 1.2 |
SOYBEAN OIL Futures:
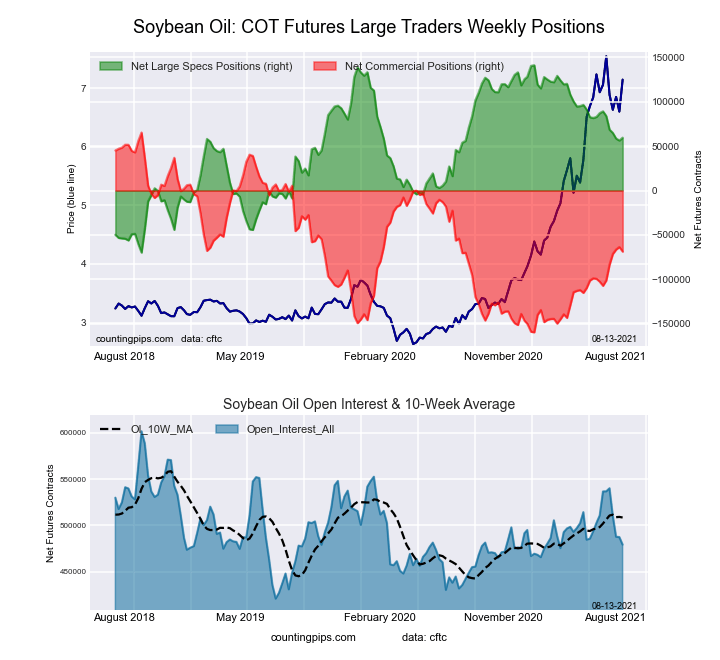 The SOYBEAN OIL large speculator standing this week equaled a net position of 59,517 contracts in the data reported through Tuesday. This was a weekly boost of 3,102 contracts from the previous week which had a total of 56,415 net contracts.
This week’s current strength score (the trader positioning range over the past three years, measured from 0 to 100) shows the speculators are currently Bullish with a score of 61.3 percent. The commercials are Bearish with a score of 40.4 percent and the small traders (not shown in chart) are Bearish with a score of 47.7 percent.
| SOYBEAN OIL Futures Statistics | SPECULATORS | COMMERCIALS | SMALL TRADERS |
| – Percent of Open Interest Longs: | 19.8 | 50.9 | 7.2 |
| – Percent of Open Interest Shorts: | 7.4 | 65.2 | 5.3 |
| – Net Position: | 59,517 | -68,690 | 9,173 |
| – Gross Longs: | 95,068 | 243,983 | 34,536 |
| – Gross Shorts: | 35,551 | 312,673 | 25,363 |
| – Long to Short Ratio: | 2.7 to 1 | 0.8 to 1 | 1.4 to 1 |
| NET POSITION TREND: | |||
| – COT Index Score (3 Year Range Pct): | 61.3 | 40.4 | 47.7 |
| – COT Index Reading (3 Year Range): | Bullish | Bearish | Bearish |
| NET POSITION MOVEMENT INDEX: | |||
| – 6-Week Change in Strength Index: | -14.1 | 17.1 | -32.9 |
SOYBEAN MEAL Futures:
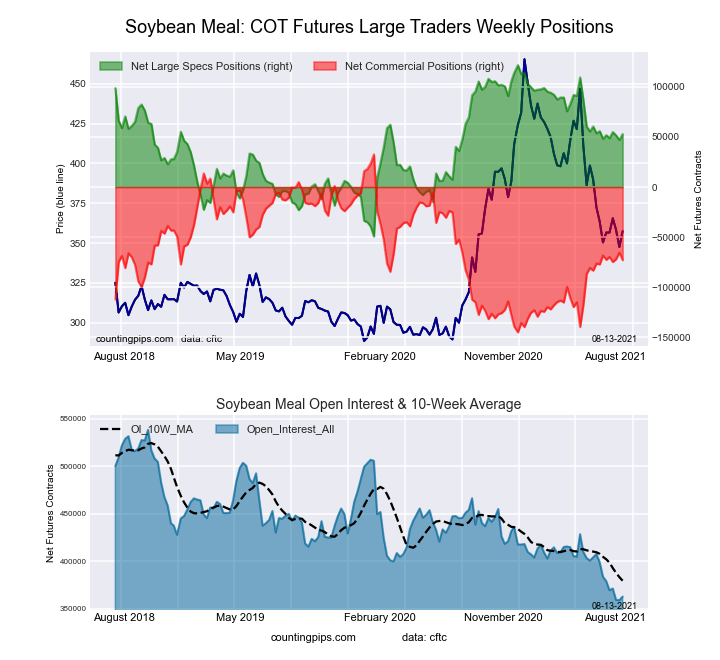 The SOYBEAN MEAL large speculator standing this week equaled a net position of 52,858 contracts in the data reported through Tuesday. This was a weekly gain of 5,856 contracts from the previous week which had a total of 47,002 net contracts.
This week’s current strength score (the trader positioning range over the past three years, measured from 0 to 100) shows the speculators are currently Bullish with a score of 59.8 percent. The commercials are Bearish with a score of 40.6 percent and the small traders (not shown in chart) are Bullish with a score of 51.1 percent.
| SOYBEAN MEAL Futures Statistics | SPECULATORS | COMMERCIALS | SMALL TRADERS |
| – Percent of Open Interest Longs: | 24.2 | 52.0 | 12.1 |
| – Percent of Open Interest Shorts: | 9.6 | 72.1 | 6.6 |
| – Net Position: | 52,858 | -72,944 | 20,086 |
| – Gross Longs: | 87,713 | 188,502 | 43,915 |
| – Gross Shorts: | 34,855 | 261,446 | 23,829 |
| – Long to Short Ratio: | 2.5 to 1 | 0.7 to 1 | 1.8 to 1 |
| NET POSITION TREND: | |||
| – COT Index Score (3 Year Range Pct): | 59.8 | 40.6 | 51.1 |
| – COT Index Reading (3 Year Range): | Bullish | Bearish | Bullish |
| NET POSITION MOVEMENT INDEX: | |||
| – 6-Week Change in Strength Index: | 2.7 | -2.6 | 0.0 |
LIVE CATTLE Futures:
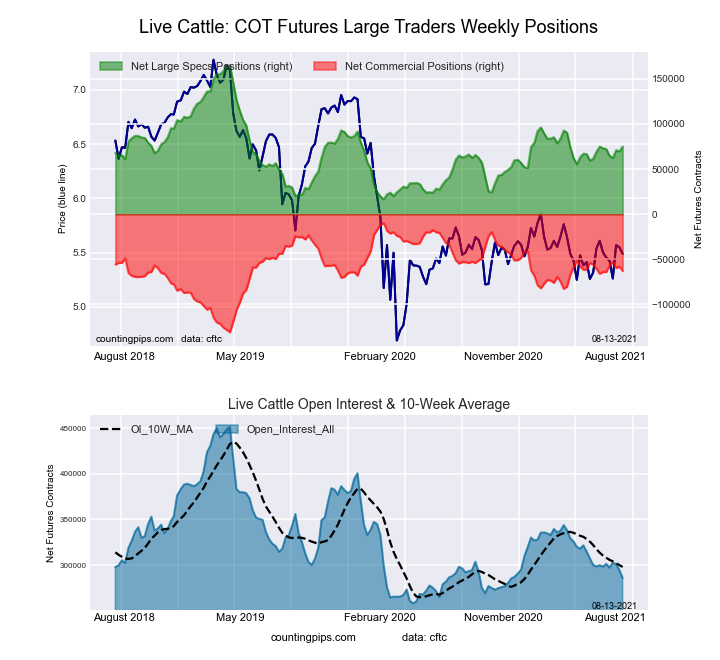 The LIVE CATTLE large speculator standing this week equaled a net position of 75,076 contracts in the data reported through Tuesday. This was a weekly rise of 5,425 contracts from the previous week which had a total of 69,651 net contracts.
This week’s current strength score (the trader positioning range over the past three years, measured from 0 to 100) shows the speculators are currently Bearish with a score of 39.4 percent. The commercials are Bullish with a score of 56.1 percent and the small traders (not shown in chart) are Bullish with a score of 57.4 percent.
| LIVE CATTLE Futures Statistics | SPECULATORS | COMMERCIALS | SMALL TRADERS |
| – Percent of Open Interest Longs: | 38.6 | 40.4 | 9.6 |
| – Percent of Open Interest Shorts: | 12.4 | 62.4 | 13.9 |
| – Net Position: | 75,076 | -62,884 | -12,192 |
| – Gross Longs: | 110,379 | 115,446 | 27,520 |
| – Gross Shorts: | 35,303 | 178,330 | 39,712 |
| – Long to Short Ratio: | 3.1 to 1 | 0.6 to 1 | 0.7 to 1 |
| NET POSITION TREND: | |||
| – COT Index Score (3 Year Range Pct): | 39.4 | 56.1 | 57.4 |
| – COT Index Reading (3 Year Range): | Bearish | Bullish | Bullish |
| NET POSITION MOVEMENT INDEX: | |||
| – 6-Week Change in Strength Index: | 1.3 | 0.9 | -7.6 |
LEAN HOGS Futures:
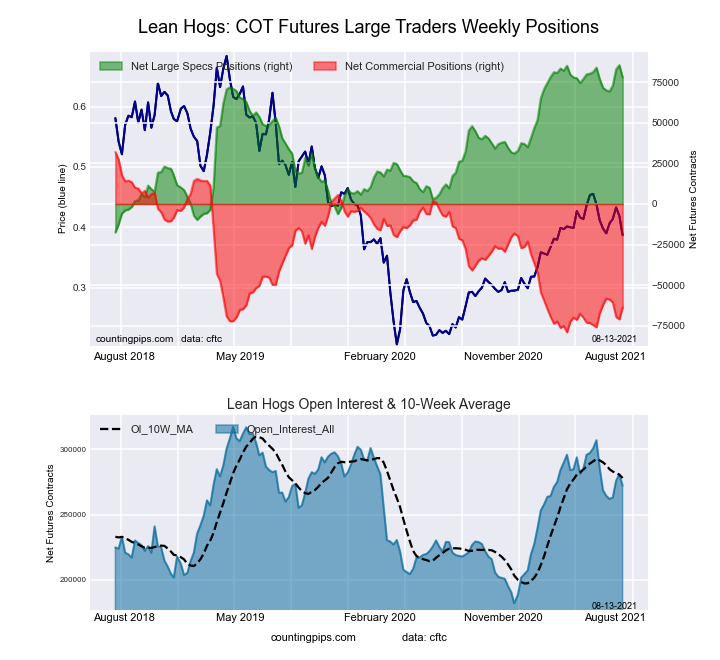 The LEAN HOGS large speculator standing this week equaled a net position of 78,088 contracts in the data reported through Tuesday. This was a weekly lowering of -7,504 contracts from the previous week which had a total of 85,592 net contracts.
This week’s current strength score (the trader positioning range over the past three years, measured from 0 to 100) shows the speculators are currently Bullish-Extreme with a score of 92.7 percent. The commercials are Bearish-Extreme with a score of 13.8 percent and the small traders (not shown in chart) are Bearish-Extreme with a score of 9.7 percent.
| LEAN HOGS Futures Statistics | SPECULATORS | COMMERCIALS | SMALL TRADERS |
| – Percent of Open Interest Longs: | 44.7 | 30.2 | 7.4 |
| – Percent of Open Interest Shorts: | 16.0 | 53.6 | 12.7 |
| – Net Position: | 78,088 | -63,722 | -14,366 |
| – Gross Longs: | 121,661 | 82,267 | 20,152 |
| – Gross Shorts: | 43,573 | 145,989 | 34,518 |
| – Long to Short Ratio: | 2.8 to 1 | 0.6 to 1 | 0.6 to 1 |
| NET POSITION TREND: | |||
| – COT Index Score (3 Year Range Pct): | 92.7 | 13.8 | 9.7 |
| – COT Index Reading (3 Year Range): | Bullish-Extreme | Bearish-Extreme | Bearish-Extreme |
| NET POSITION MOVEMENT INDEX: | |||
| – 6-Week Change in Strength Index: | 6.2 | -1.4 | -23.0 |
COTTON Futures:
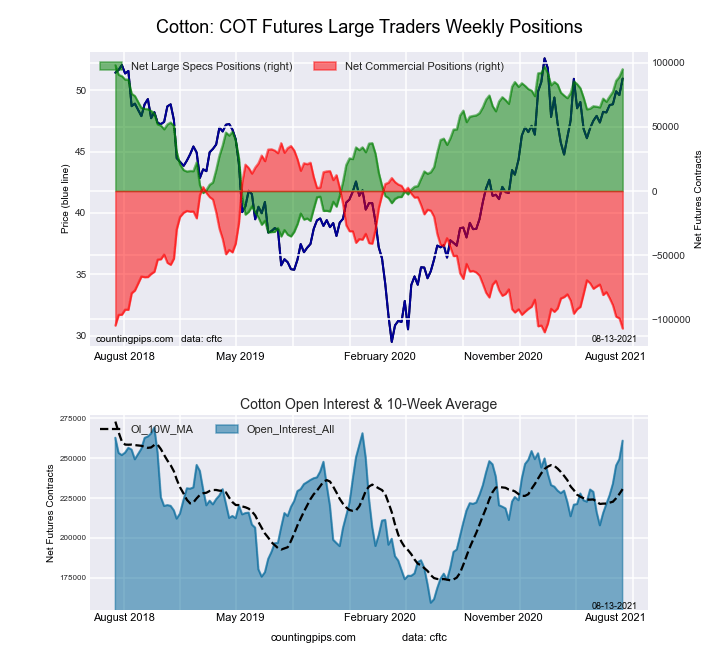 The COTTON large speculator standing this week equaled a net position of 94,912 contracts in the data reported through Tuesday. This was a weekly rise of 5,869 contracts from the previous week which had a total of 89,043 net contracts.
This week’s current strength score (the trader positioning range over the past three years, measured from 0 to 100) shows the speculators are currently Bullish-Extreme with a score of 98.4 percent. The commercials are Bearish-Extreme with a score of 2.0 percent and the small traders (not shown in chart) are Bullish-Extreme with a score of 91.1 percent.
| COTTON Futures Statistics | SPECULATORS | COMMERCIALS | SMALL TRADERS |
| – Percent of Open Interest Longs: | 42.9 | 36.8 | 7.5 |
| – Percent of Open Interest Shorts: | 6.5 | 77.8 | 2.9 |
| – Net Position: | 94,912 | -107,143 | 12,231 |
| – Gross Longs: | 111,991 | 95,971 | 19,693 |
| – Gross Shorts: | 17,079 | 203,114 | 7,462 |
| – Long to Short Ratio: | 6.6 to 1 | 0.5 to 1 | 2.6 to 1 |
| NET POSITION TREND: | |||
| – COT Index Score (3 Year Range Pct): | 98.4 | 2.0 | 91.1 |
| – COT Index Reading (3 Year Range): | Bullish-Extreme | Bearish-Extreme | Bullish-Extreme |
| NET POSITION MOVEMENT INDEX: | |||
| – 6-Week Change in Strength Index: | 17.3 | -17.7 | 20.1 |
COCOA Futures:
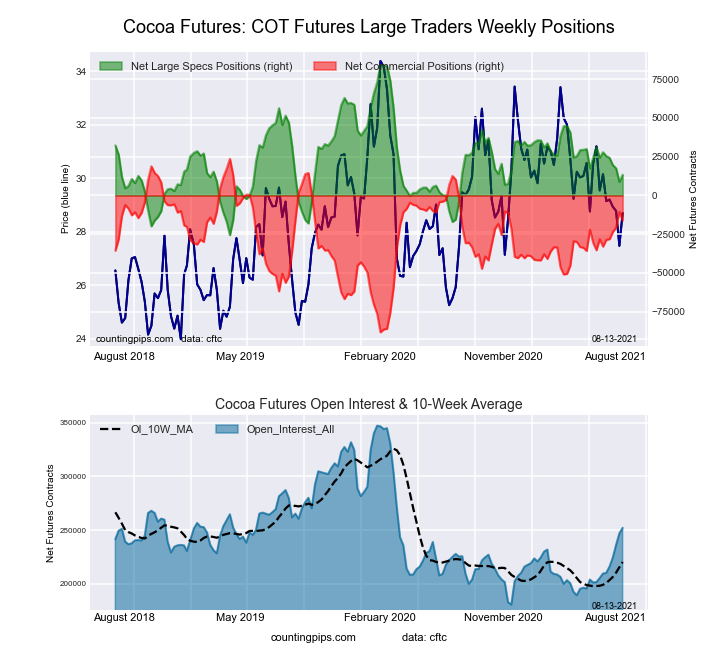 The COCOA large speculator standing this week equaled a net position of 13,326 contracts in the data reported through Tuesday. This was a weekly boost of 4,559 contracts from the previous week which had a total of 8,767 net contracts.
This week’s current strength score (the trader positioning range over the past three years, measured from 0 to 100) shows the speculators are currently Bearish with a score of 35.5 percent. The commercials are Bullish with a score of 64.5 percent and the small traders (not shown in chart) are Bearish with a score of 39.9 percent.
| COCOA Futures Statistics | SPECULATORS | COMMERCIALS | SMALL TRADERS |
| – Percent of Open Interest Longs: | 27.3 | 48.2 | 4.7 |
| – Percent of Open Interest Shorts: | 22.0 | 54.6 | 3.6 |
| – Net Position: | 13,326 | -16,092 | 2,766 |
| – Gross Longs: | 68,772 | 121,390 | 11,767 |
| – Gross Shorts: | 55,446 | 137,482 | 9,001 |
| – Long to Short Ratio: | 1.2 to 1 | 0.9 to 1 | 1.3 to 1 |
| NET POSITION TREND: | |||
| – COT Index Score (3 Year Range Pct): | 35.5 | 64.5 | 39.9 |
| – COT Index Reading (3 Year Range): | Bearish | Bullish | Bearish |
| NET POSITION MOVEMENT INDEX: | |||
| – 6-Week Change in Strength Index: | -13.3 | 15.1 | -26.6 |
WHEAT Futures:
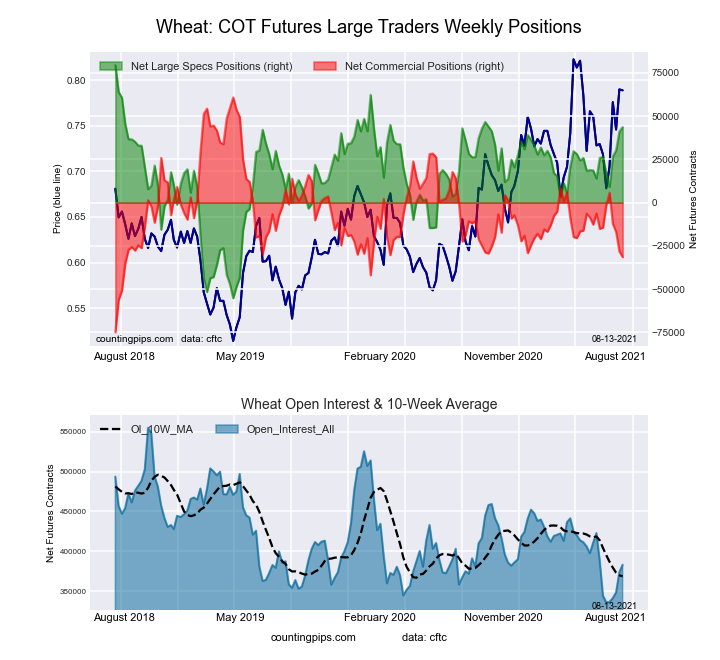 The WHEAT large speculator standing this week equaled a net position of 43,632 contracts in the data reported through Tuesday. This was a weekly gain of 2,655 contracts from the previous week which had a total of 40,977 net contracts.
This week’s current strength score (the trader positioning range over the past three years, measured from 0 to 100) shows the speculators are currently Bullish with a score of 73.4 percent. The commercials are Bearish with a score of 32.0 percent and the small traders (not shown in chart) are Bearish with a score of 43.5 percent.
| WHEAT Futures Statistics | SPECULATORS | COMMERCIALS | SMALL TRADERS |
| – Percent of Open Interest Longs: | 32.2 | 37.6 | 8.0 |
| – Percent of Open Interest Shorts: | 20.8 | 45.8 | 11.2 |
| – Net Position: | 43,632 | -31,461 | -12,171 |
| – Gross Longs: | 123,383 | 144,051 | 30,779 |
| – Gross Shorts: | 79,751 | 175,512 | 42,950 |
| – Long to Short Ratio: | 1.5 to 1 | 0.8 to 1 | 0.7 to 1 |
| NET POSITION TREND: | |||
| – COT Index Score (3 Year Range Pct): | 73.4 | 32.0 | 43.5 |
| – COT Index Reading (3 Year Range): | Bullish | Bearish | Bearish |
| NET POSITION MOVEMENT INDEX: | |||
| – 6-Week Change in Strength Index: | 12.8 | -12.6 | -0.3 |
Article By CountingPips.com – Receive our weekly COT Reports by Email
*COT Report: The COT data, released weekly to the public each Friday, is updated through the most recent Tuesday (data is 3 days old) and shows a quick view of how large speculators or non-commercials (for-profit traders) were positioned in the futures markets.
The CFTC categorizes trader positions according to commercial hedgers (traders who use futures contracts for hedging as part of the business), non-commercials (large traders who speculate to realize trading profits) and nonreportable traders (usually small traders/speculators).
Find CFTC criteria here: (http://www.cftc.gov/MarketReports/CommitmentsofTraders/ExplanatoryNotes/index.htm).

- The Tech‑heavy NASDAQ Index jumped by more than 3.3%. The offshore yuan is trading at its highest level since 2023 Jul 31, 2026
- USD/JPY After Volatility: Multiple Events in One Day Jul 31, 2026
- The US indices sell off amid renewed US-Iran clashes. Oil jumps by 7% Jul 30, 2026
- USD/JPY Temporary in Equilibrium: Multiple Factors in Focus Jul 30, 2026
- GBP/USD at Month’s Lows: The Outlook Remains Weak Jul 29, 2026
- Crude oil falls below $80 per barrel. Australia sees inflation slowdown Jul 29, 2026
- The US Tech sector hit by sell‑off. Oil prices decline on renewed negotiations Jul 28, 2026
- Gold Declines, Focus on Fed and Falling Oil Prices Jul 28, 2026
- This week will be one of the most crowded for central‑bank meetings Jul 27, 2026
- EUR/USD Ahead of a Key Week: Holding Near Lows Jul 27, 2026