
Article By RoboForex.com
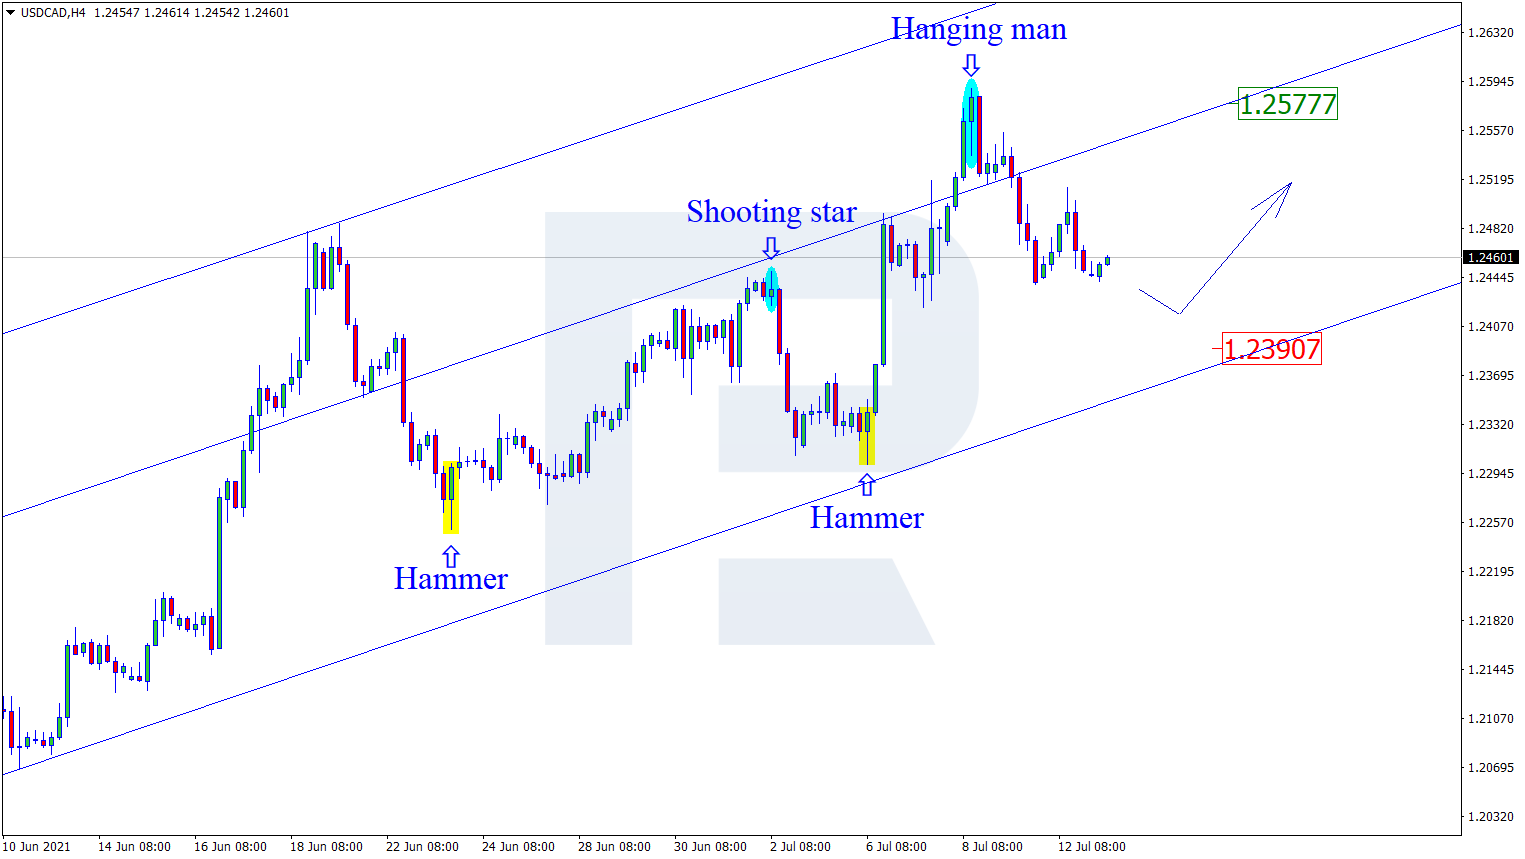
USDCAD, “US Dollar vs Canadian Dollar”
As we can see in the H4 chart, the asset continues the correction. After forming a Hanging Man pattern close to the resistance level, USDCAD is reversing and may start a new decline towards the support area at 1.2390. After testing this level, the price may rebound from it and resume its ascending tendency. However, an alternative scenario implies that the asset may continue growing to reach 1.2577 without correcting towards the support area.

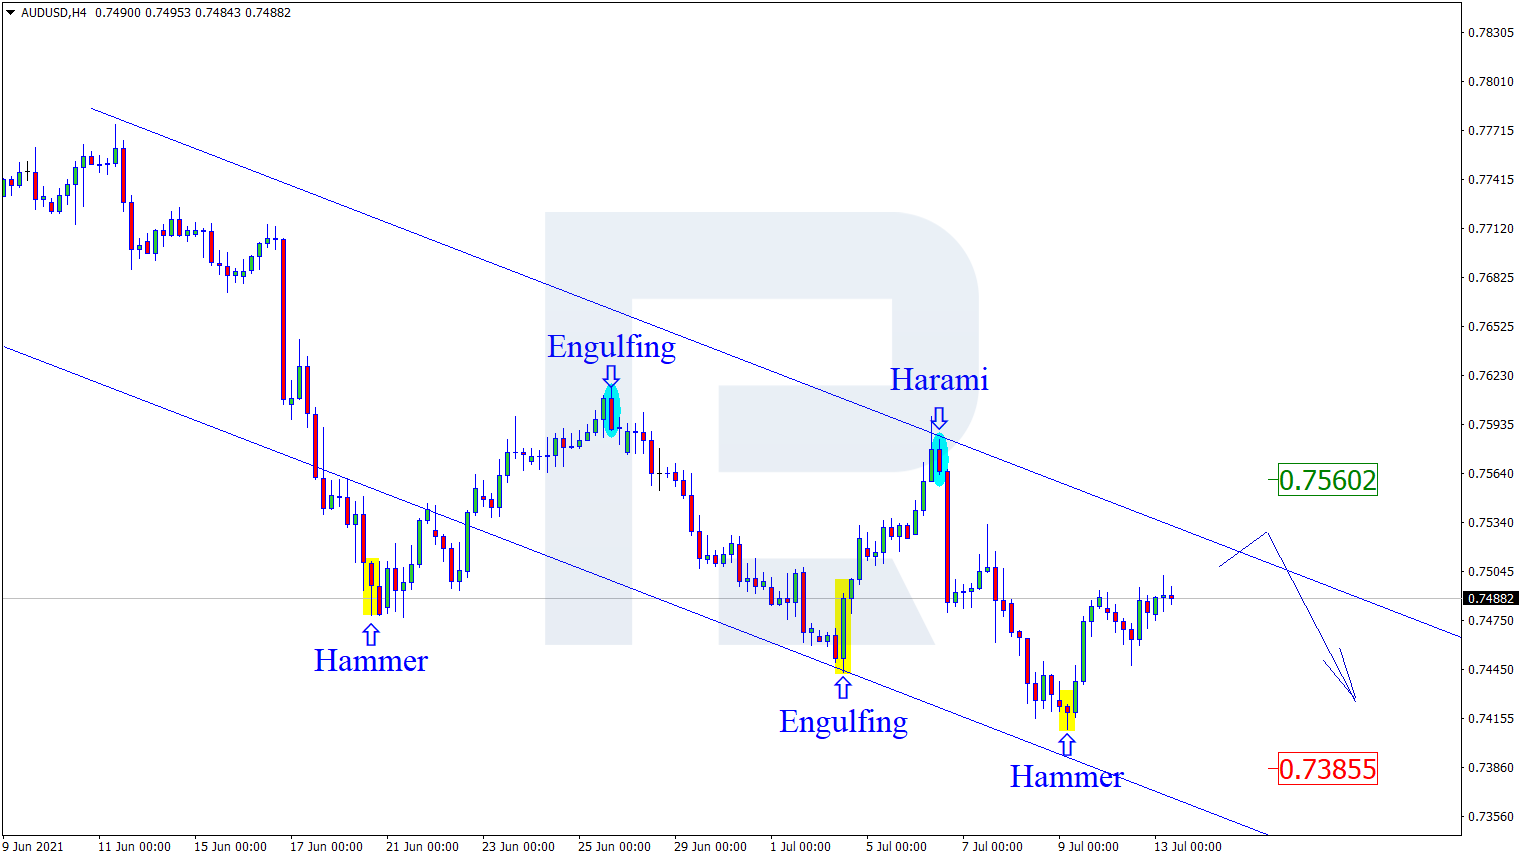
AUDUSD, “Australian Dollar vs US Dollar”
As we can see in the H4 chart, AUDUSD has formed several reversal patterns, such as Hammer, not far from the support level. At the moment, the asset is reversing in the form of a new correction within the descending channel. In this case, the upside target may be the resistance area at 0.7560. At the same time, an opposite scenario implies that the price may fall towards the support level at 0.7385 and continue the descending tendency without testing the resistance area.
Free Reports:
 Download Our Metatrader 4 Indicators – Put Our Free MetaTrader 4 Custom Indicators on your charts when you join our Weekly Newsletter
 Get our Weekly Commitment of Traders Reports - See where the biggest traders (Hedge Funds and Commercial Hedgers) are positioned in the futures markets on a weekly basis.
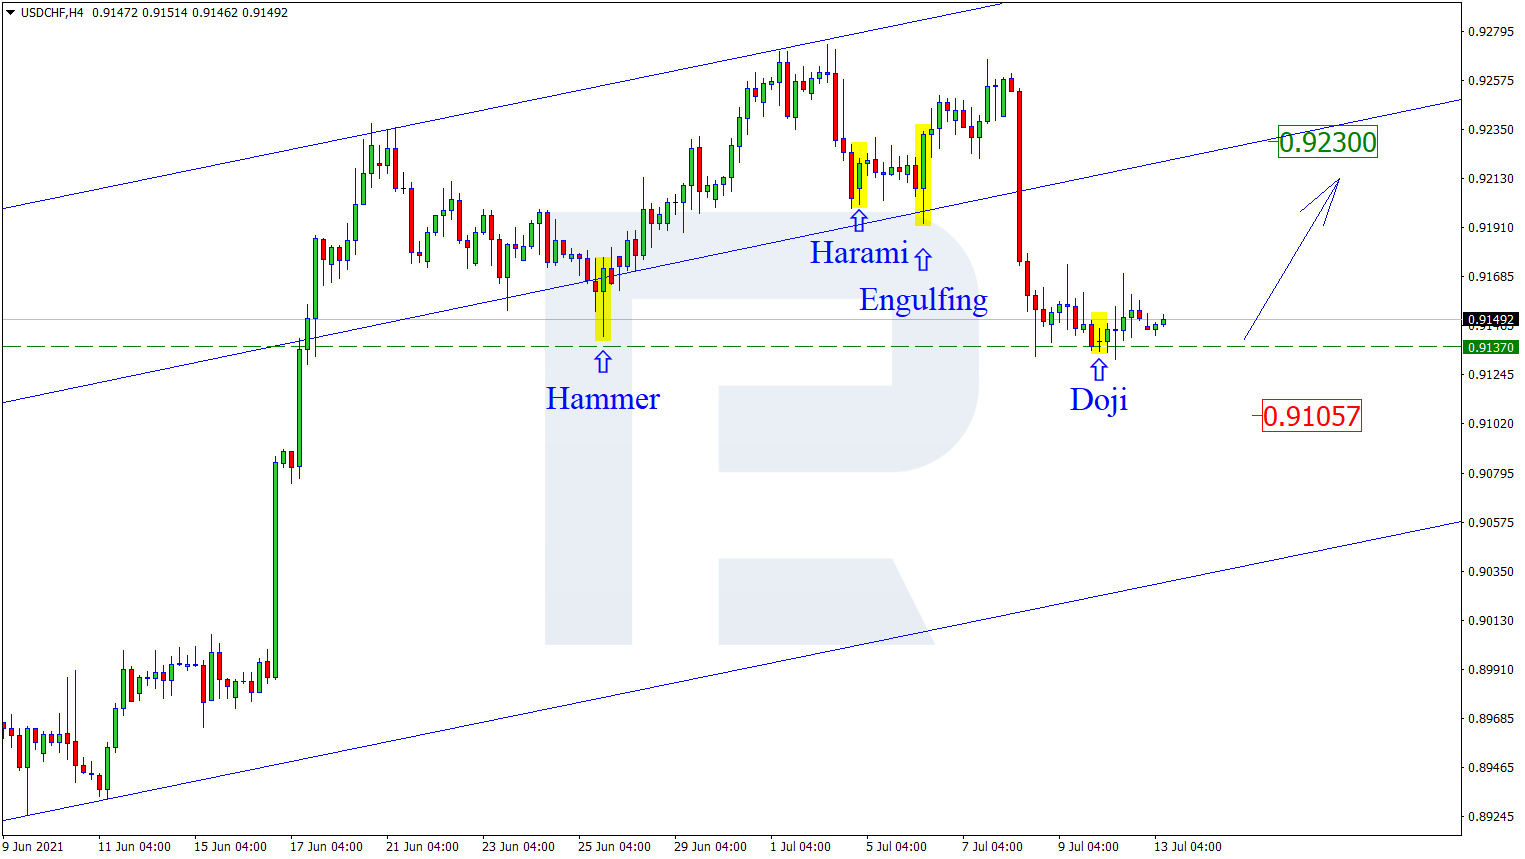
USDCHF, “US Dollar vs Swiss Franc”
As we can see in the H4 chart, the asset is still testing the support area, where it has formed several reversal patterns, for example, Doji, Harami, and Hammer. At the moment, USDCHF may reverse and start new growth. In this case, the upside target may be the resistance level at 0.9230. Still, there might be an alternative scenario, according to which the asset may break the support area and correct towards 0.9105 before resuming its ascending tendency.
Article By RoboForex.com
Attention!
Forecasts presented in this section only reflect the author’s private opinion and should not be considered as guidance for trading. RoboForex LP bears no responsibility for trading results based on trading recommendations described in these analytical reviews.

- GBP/USD at Month’s Lows: The Outlook Remains Weak Jul 29, 2026
- Crude oil falls below $80 per barrel. Australia sees inflation slowdown Jul 29, 2026
- The US Tech sector hit by sell‑off. Oil prices decline on renewed negotiations Jul 28, 2026
- Gold Declines, Focus on Fed and Falling Oil Prices Jul 28, 2026
- This week will be one of the most crowded for central‑bank meetings Jul 27, 2026
- EUR/USD Ahead of a Key Week: Holding Near Lows Jul 27, 2026
- COT Metals Charts: Weekly Speculator Changes led by Copper Jul 26, 2026
- COT Bonds Charts: Speculator Bets led by SOFR 3-Months & 5-Year Bonds Jul 26, 2026
- COT Energy Charts: Weekly Speculator Bets led by WTI Crude & Natural Gas Jul 26, 2026
- COT Soft Commodities Charts: Weekly Speculator Bets led by Corn & Soybeans Jul 26, 2026