
By CountingPips.com COT Home | Data Tables | Data Downloads | Newsletter
Here are the latest charts and statistics for the Commitment of Traders (COT) data published by the Commodities Futures Trading Commission (CFTC).
The latest COT data is updated through Tuesday June 29 2021 and shows a quick view of how large traders (for-profit speculators and commercial entities) were positioned in the futures markets.
CORN Futures:
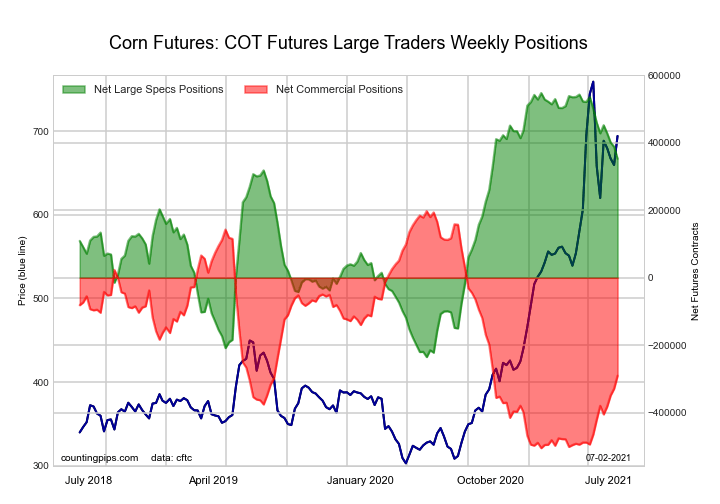 The CORN large speculator standing this week recorded a net position of 352,967 contracts in the data reported through Tuesday. This was a weekly lowering of -35,444 contracts from the previous week which had a total of 388,411 net contracts.
This week’s current strength score (the trader positioning range over the past three years, measured from 0 to 100) shows the speculators are currently Bullish with a score of 75.1 percent. The commercials are Bearish with a score of 30.5 percent and the small traders (not shown in chart) are Bearish-Extreme with a score of 0.1 percent.
| CORN Futures Statistics | SPECULATORS | COMMERCIALS | SMALL TRADERS |
| – Percent of Open Interest Longs: | 29.4 | 49.3 | 8.2 |
| – Percent of Open Interest Shorts: | 5.6 | 68.9 | 12.4 |
| – Net Position: | 352,967 | -290,475 | -62,492 |
| – Gross Longs: | 436,054 | 732,401 | 121,074 |
| – Gross Shorts: | 83,087 | 1,022,876 | 183,566 |
| – Long to Short Ratio: | 5.2 to 1 | 0.7 to 1 | 0.7 to 1 |
| NET POSITION TREND: | |||
| – COT Index Score (3 Year Range Pct): | 75.1 | 30.5 | 0.1 |
| – COT Index Reading (3 Year Range): | Bullish | Bearish | Bearish-Extreme |
| NET POSITION MOVEMENT INDEX: | |||
| – 6-Week Change in Strength Index: | -13.6 | 18.5 | -14.4 |
Free Reports:
 Sign Up for Our Stock Market Newsletter – Get updated on News, Charts & Rankings of Public Companies when you join our Stocks Newsletter
 Get our Weekly Commitment of Traders Reports - See where the biggest traders (Hedge Funds and Commercial Hedgers) are positioned in the futures markets on a weekly basis.
SUGAR Futures:
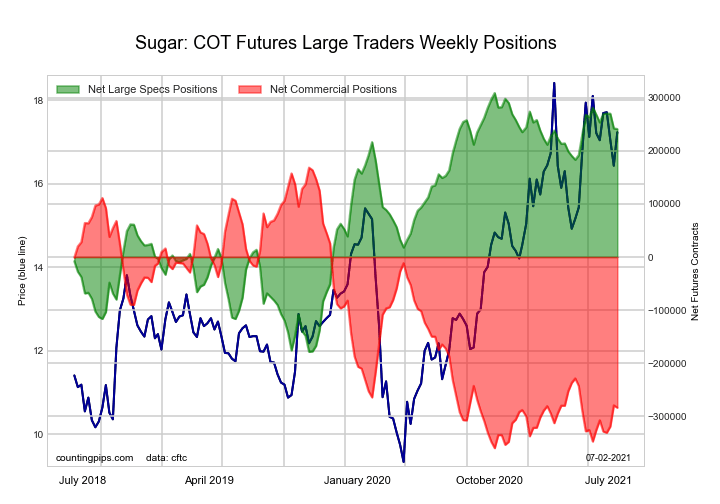 The SUGAR large speculator standing this week recorded a net position of 240,728 contracts in the data reported through Tuesday. This was a weekly lowering of -1,263 contracts from the previous week which had a total of 241,991 net contracts.
This week’s current strength score (the trader positioning range over the past three years, measured from 0 to 100) shows the speculators are currently Bullish-Extreme with a score of 86.1 percent. The commercials are Bearish-Extreme with a score of 14.4 percent and the small traders (not shown in chart) are Bullish with a score of 60.7 percent.
| SUGAR Futures Statistics | SPECULATORS | COMMERCIALS | SMALL TRADERS |
| – Percent of Open Interest Longs: | 31.5 | 45.0 | 9.4 |
| – Percent of Open Interest Shorts: | 4.5 | 76.7 | 4.6 |
| – Net Position: | 240,728 | -283,442 | 42,714 |
| – Gross Longs: | 280,757 | 401,035 | 83,427 |
| – Gross Shorts: | 40,029 | 684,477 | 40,713 |
| – Long to Short Ratio: | 7.0 to 1 | 0.6 to 1 | 2.0 to 1 |
| NET POSITION TREND: | |||
| – COT Index Score (3 Year Range Pct): | 86.1 | 14.4 | 60.7 |
| – COT Index Reading (3 Year Range): | Bullish-Extreme | Bearish-Extreme | Bullish |
| NET POSITION MOVEMENT INDEX: | |||
| – 6-Week Change in Strength Index: | -5.6 | 8.0 | -18.5 |
COFFEE Futures:
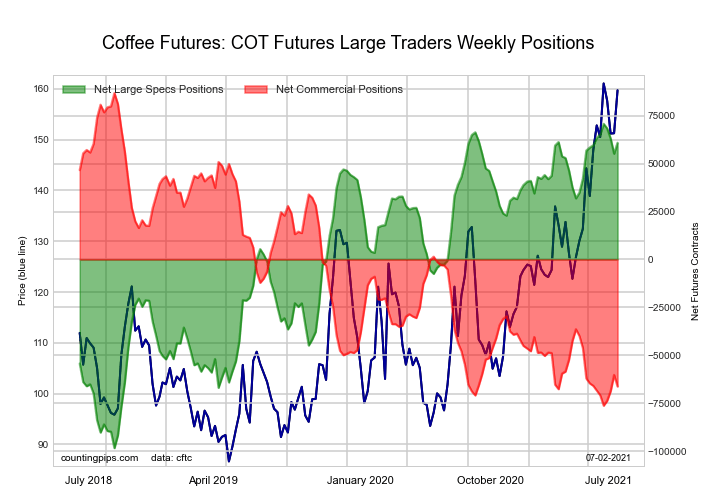 The COFFEE large speculator standing this week recorded a net position of 60,876 contracts in the data reported through Tuesday. This was a weekly lift of 5,656 contracts from the previous week which had a total of 55,220 net contracts.
This week’s current strength score (the trader positioning range over the past three years, measured from 0 to 100) shows the speculators are currently Bullish-Extreme with a score of 94.2 percent. The commercials are Bearish-Extreme with a score of 6.1 percent and the small traders (not shown in chart) are Bearish with a score of 26.0 percent.
| COFFEE Futures Statistics | SPECULATORS | COMMERCIALS | SMALL TRADERS |
| – Percent of Open Interest Longs: | 31.7 | 46.3 | 4.2 |
| – Percent of Open Interest Shorts: | 9.4 | 70.6 | 2.2 |
| – Net Position: | 60,876 | -66,315 | 5,439 |
| – Gross Longs: | 86,405 | 126,209 | 11,480 |
| – Gross Shorts: | 25,529 | 192,524 | 6,041 |
| – Long to Short Ratio: | 3.4 to 1 | 0.7 to 1 | 1.9 to 1 |
| NET POSITION TREND: | |||
| – COT Index Score (3 Year Range Pct): | 94.2 | 6.1 | 26.0 |
| – COT Index Reading (3 Year Range): | Bullish-Extreme | Bearish-Extreme | Bearish |
| NET POSITION MOVEMENT INDEX: | |||
| – 6-Week Change in Strength Index: | -1.5 | 1.3 | 3.5 |
SOYBEANS Futures:
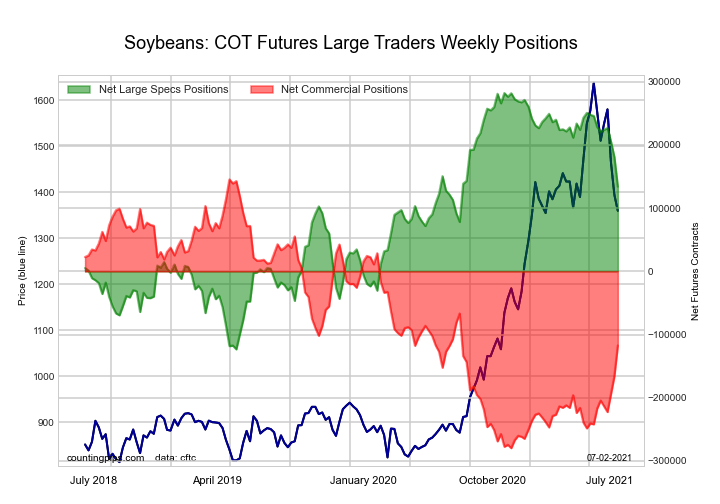 The SOYBEANS large speculator standing this week recorded a net position of 134,011 contracts in the data reported through Tuesday. This was a weekly decline of -46,937 contracts from the previous week which had a total of 180,948 net contracts.
This week’s current strength score (the trader positioning range over the past three years, measured from 0 to 100) shows the speculators are currently Bullish with a score of 63.5 percent. The commercials are Bearish with a score of 38.2 percent and the small traders (not shown in chart) are Bearish with a score of 44.2 percent.
| SOYBEANS Futures Statistics | SPECULATORS | COMMERCIALS | SMALL TRADERS |
| – Percent of Open Interest Longs: | 28.1 | 50.7 | 7.1 |
| – Percent of Open Interest Shorts: | 8.3 | 68.1 | 9.5 |
| – Net Position: | 134,011 | -117,406 | -16,605 |
| – Gross Longs: | 190,144 | 343,050 | 47,884 |
| – Gross Shorts: | 56,133 | 460,456 | 64,489 |
| – Long to Short Ratio: | 3.4 to 1 | 0.7 to 1 | 0.7 to 1 |
| NET POSITION TREND: | |||
| – COT Index Score (3 Year Range Pct): | 63.5 | 38.2 | 44.2 |
| – COT Index Reading (3 Year Range): | Bullish | Bearish | Bearish |
| NET POSITION MOVEMENT INDEX: | |||
| – 6-Week Change in Strength Index: | -23.3 | 23.4 | -8.8 |
SOYBEAN OIL Futures:
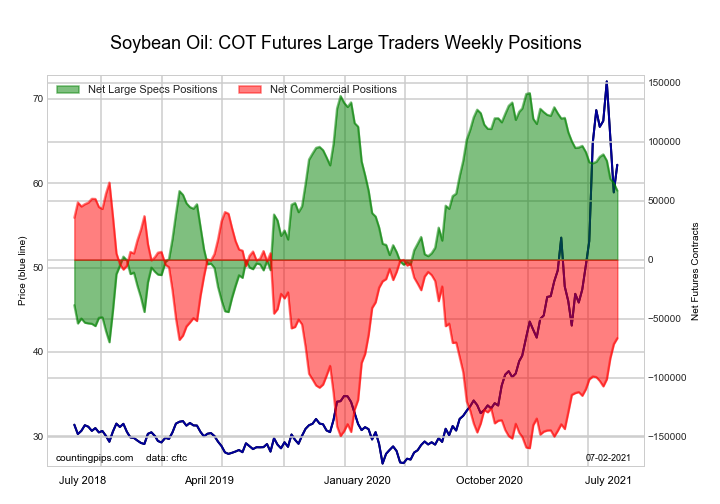 The SOYBEAN OIL large speculator standing this week recorded a net position of 58,570 contracts in the data reported through Tuesday. This was a weekly lowering of -6,338 contracts from the previous week which had a total of 64,908 net contracts.
This week’s current strength score (the trader positioning range over the past three years, measured from 0 to 100) shows the speculators are currently Bullish with a score of 60.9 percent. The commercials are Bearish with a score of 41.4 percent and the small traders (not shown in chart) are Bearish with a score of 42.8 percent.
| SOYBEAN OIL Futures Statistics | SPECULATORS | COMMERCIALS | SMALL TRADERS |
| – Percent of Open Interest Longs: | 18.9 | 51.7 | 7.0 |
| – Percent of Open Interest Shorts: | 6.9 | 65.3 | 5.4 |
| – Net Position: | 58,570 | -66,438 | 7,868 |
| – Gross Longs: | 92,353 | 252,314 | 34,071 |
| – Gross Shorts: | 33,783 | 318,752 | 26,203 |
| – Long to Short Ratio: | 2.7 to 1 | 0.8 to 1 | 1.3 to 1 |
| NET POSITION TREND: | |||
| – COT Index Score (3 Year Range Pct): | 60.9 | 41.4 | 42.8 |
| – COT Index Reading (3 Year Range): | Bullish | Bearish | Bearish |
| NET POSITION MOVEMENT INDEX: | |||
| – 6-Week Change in Strength Index: | -11.6 | 14.6 | -31.9 |
SOYBEAN MEAL Futures:
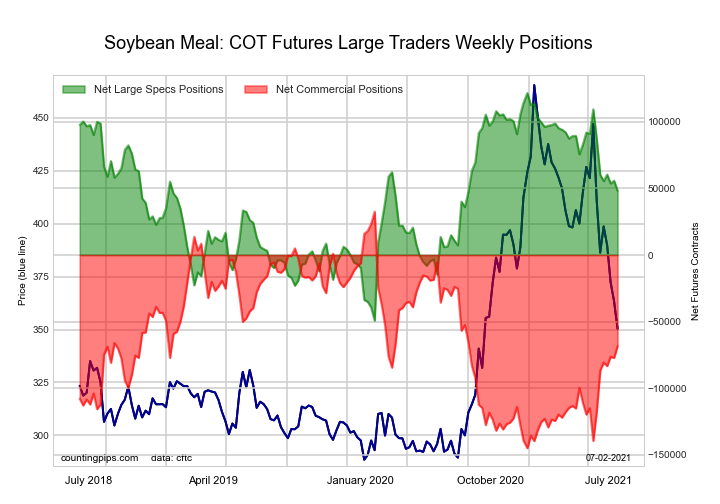 The SOYBEAN MEAL large speculator standing this week recorded a net position of 48,209 contracts in the data reported through Tuesday. This was a weekly reduction of -7,585 contracts from the previous week which had a total of 55,794 net contracts.
This week’s current strength score (the trader positioning range over the past three years, measured from 0 to 100) shows the speculators are currently Bullish with a score of 57.0 percent. The commercials are Bearish with a score of 43.2 percent and the small traders (not shown in chart) are Bullish with a score of 51.1 percent.
| SOYBEAN MEAL Futures Statistics | SPECULATORS | COMMERCIALS | SMALL TRADERS |
| – Percent of Open Interest Longs: | 22.4 | 52.0 | 12.1 |
| – Percent of Open Interest Shorts: | 9.8 | 69.8 | 6.9 |
| – Net Position: | 48,209 | -68,291 | 20,082 |
| – Gross Longs: | 85,971 | 199,332 | 46,445 |
| – Gross Shorts: | 37,762 | 267,623 | 26,363 |
| – Long to Short Ratio: | 2.3 to 1 | 0.7 to 1 | 1.8 to 1 |
| NET POSITION TREND: | |||
| – COT Index Score (3 Year Range Pct): | 57.0 | 43.2 | 51.1 |
| – COT Index Reading (3 Year Range): | Bullish | Bearish | Bullish |
| NET POSITION MOVEMENT INDEX: | |||
| – 6-Week Change in Strength Index: | -22.6 | 27.7 | -42.6 |
LIVE CATTLE Futures:
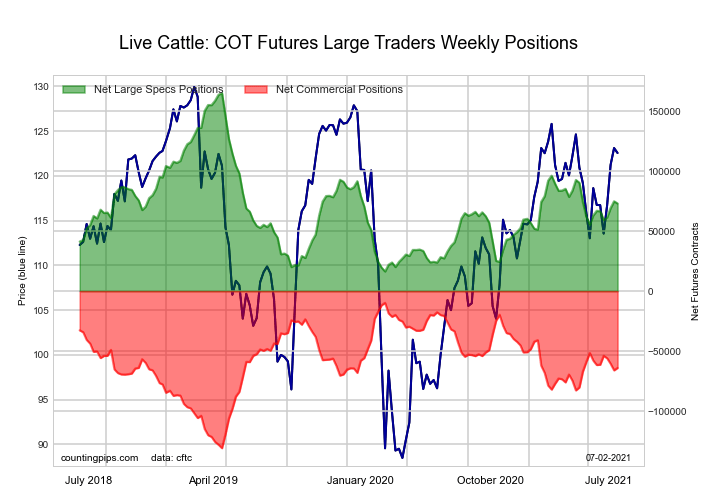 The LIVE CATTLE large speculator standing this week recorded a net position of 73,073 contracts in the data reported through Tuesday. This was a weekly reduction of -1,841 contracts from the previous week which had a total of 74,914 net contracts.
This week’s current strength score (the trader positioning range over the past three years, measured from 0 to 100) shows the speculators are currently Bearish with a score of 38.1 percent. The commercials are Bullish with a score of 55.2 percent and the small traders (not shown in chart) are Bullish with a score of 65.0 percent.
| LIVE CATTLE Futures Statistics | SPECULATORS | COMMERCIALS | SMALL TRADERS |
| – Percent of Open Interest Longs: | 38.2 | 38.4 | 8.9 |
| – Percent of Open Interest Shorts: | 13.7 | 59.9 | 11.9 |
| – Net Position: | 73,073 | -64,011 | -9,062 |
| – Gross Longs: | 114,064 | 114,621 | 26,481 |
| – Gross Shorts: | 40,991 | 178,632 | 35,543 |
| – Long to Short Ratio: | 2.8 to 1 | 0.6 to 1 | 0.7 to 1 |
| NET POSITION TREND: | |||
| – COT Index Score (3 Year Range Pct): | 38.1 | 55.2 | 65.0 |
| – COT Index Reading (3 Year Range): | Bearish | Bullish | Bullish |
| NET POSITION MOVEMENT INDEX: | |||
| – 6-Week Change in Strength Index: | 4.1 | -2.1 | -8.9 |
LEAN HOGS Futures:
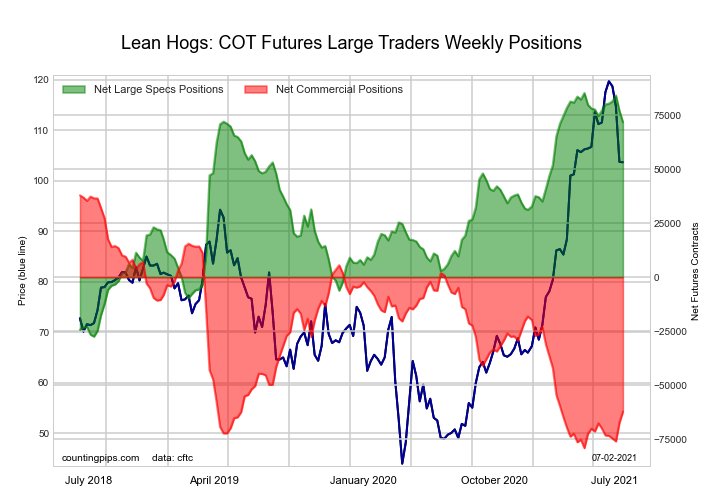 The LEAN HOGS large speculator standing this week recorded a net position of 71,699 contracts in the data reported through Tuesday. This was a weekly decline of -5,277 contracts from the previous week which had a total of 76,976 net contracts.
This week’s current strength score (the trader positioning range over the past three years, measured from 0 to 100) shows the speculators are currently Bullish-Extreme with a score of 88.0 percent. The commercials are Bearish-Extreme with a score of 14.5 percent and the small traders (not shown in chart) are Bearish with a score of 32.7 percent.
| LEAN HOGS Futures Statistics | SPECULATORS | COMMERCIALS | SMALL TRADERS |
| – Percent of Open Interest Longs: | 40.4 | 32.5 | 8.0 |
| – Percent of Open Interest Shorts: | 13.7 | 55.7 | 11.5 |
| – Net Position: | 71,699 | -62,199 | -9,500 |
| – Gross Longs: | 108,582 | 87,436 | 21,492 |
| – Gross Shorts: | 36,883 | 149,635 | 30,992 |
| – Long to Short Ratio: | 2.9 to 1 | 0.6 to 1 | 0.7 to 1 |
| NET POSITION TREND: | |||
| – COT Index Score (3 Year Range Pct): | 88.0 | 14.5 | 32.7 |
| – COT Index Reading (3 Year Range): | Bullish-Extreme | Bearish-Extreme | Bearish |
| NET POSITION MOVEMENT INDEX: | |||
| – 6-Week Change in Strength Index: | -4.8 | 6.7 | -11.3 |
COTTON Futures:
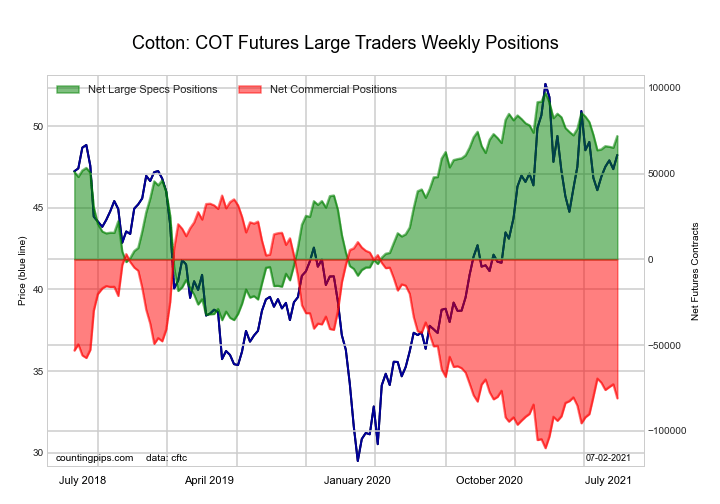 The COTTON large speculator standing this week recorded a net position of 71,952 contracts in the data reported through Tuesday. This was a weekly advance of 6,782 contracts from the previous week which had a total of 65,170 net contracts.
This week’s current strength score (the trader positioning range over the past three years, measured from 0 to 100) shows the speculators are currently Bullish with a score of 73.6 percent. The commercials are Bearish with a score of 24.6 percent and the small traders (not shown in chart) are Bullish with a score of 71.1 percent.
| COTTON Futures Statistics | SPECULATORS | COMMERCIALS | SMALL TRADERS |
| – Percent of Open Interest Longs: | 38.0 | 42.9 | 7.1 |
| – Percent of Open Interest Shorts: | 4.6 | 80.5 | 2.9 |
| – Net Position: | 71,952 | -81,008 | 9,056 |
| – Gross Longs: | 81,826 | 92,461 | 15,352 |
| – Gross Shorts: | 9,874 | 173,469 | 6,296 |
| – Long to Short Ratio: | 8.3 to 1 | 0.5 to 1 | 2.4 to 1 |
| NET POSITION TREND: | |||
| – COT Index Score (3 Year Range Pct): | 73.6 | 24.6 | 71.1 |
| – COT Index Reading (3 Year Range): | Bullish | Bearish | Bullish |
| NET POSITION MOVEMENT INDEX: | |||
| – 6-Week Change in Strength Index: | -0.5 | -0.6 | 10.4 |
COCOA Futures:
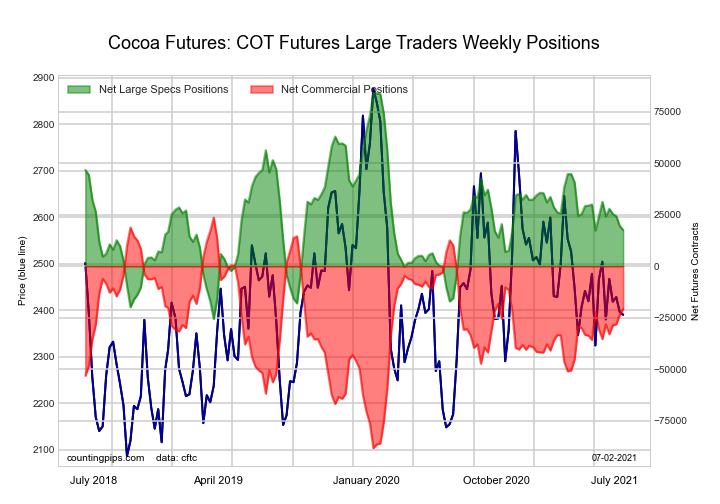 The COCOA large speculator standing this week recorded a net position of 17,514 contracts in the data reported through Tuesday. This was a weekly fall of -2,090 contracts from the previous week which had a total of 19,604 net contracts.
This week’s current strength score (the trader positioning range over the past three years, measured from 0 to 100) shows the speculators are currently Bearish with a score of 39.3 percent. The commercials are Bullish with a score of 60.4 percent and the small traders (not shown in chart) are Bearish with a score of 44.2 percent.
| COCOA Futures Statistics | SPECULATORS | COMMERCIALS | SMALL TRADERS |
| – Percent of Open Interest Longs: | 28.1 | 46.0 | 5.2 |
| – Percent of Open Interest Shorts: | 20.7 | 54.8 | 3.9 |
| – Net Position: | 17,514 | -20,654 | 3,140 |
| – Gross Longs: | 66,344 | 108,654 | 12,385 |
| – Gross Shorts: | 48,830 | 129,308 | 9,245 |
| – Long to Short Ratio: | 1.4 to 1 | 0.8 to 1 | 1.3 to 1 |
| NET POSITION TREND: | |||
| – COT Index Score (3 Year Range Pct): | 39.3 | 60.4 | 44.2 |
| – COT Index Reading (3 Year Range): | Bearish | Bullish | Bearish |
| NET POSITION MOVEMENT INDEX: | |||
| – 6-Week Change in Strength Index: | -12.5 | 13.1 | -10.6 |
WHEAT Futures:
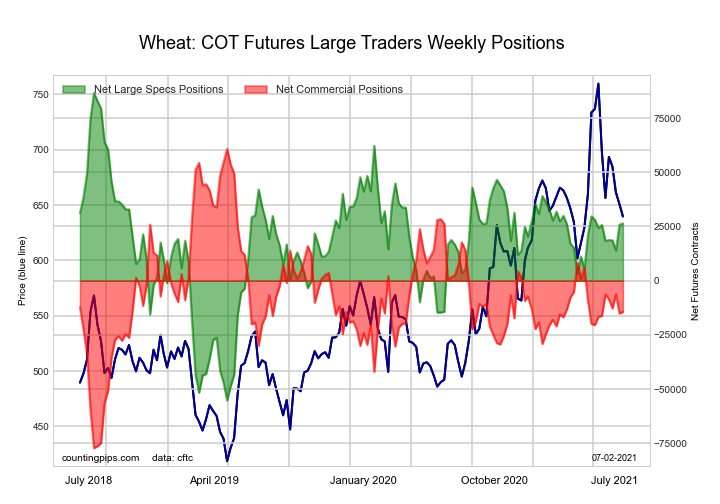 The WHEAT large speculator standing this week recorded a net position of 26,446 contracts in the data reported through Tuesday. This was a weekly gain of 640 contracts from the previous week which had a total of 25,806 net contracts.
This week’s current strength score (the trader positioning range over the past three years, measured from 0 to 100) shows the speculators are currently Bullish with a score of 57.6 percent. The commercials are Bearish with a score of 45.5 percent and the small traders (not shown in chart) are Bearish with a score of 43.8 percent.
| WHEAT Futures Statistics | SPECULATORS | COMMERCIALS | SMALL TRADERS |
| – Percent of Open Interest Longs: | 31.2 | 40.1 | 7.2 |
| – Percent of Open Interest Shorts: | 23.5 | 44.3 | 10.7 |
| – Net Position: | 26,446 | -14,345 | -12,101 |
| – Gross Longs: | 107,346 | 137,995 | 24,768 |
| – Gross Shorts: | 80,900 | 152,340 | 36,869 |
| – Long to Short Ratio: | 1.3 to 1 | 0.9 to 1 | 0.7 to 1 |
| NET POSITION TREND: | |||
| – COT Index Score (3 Year Range Pct): | 57.6 | 45.5 | 43.8 |
| – COT Index Reading (3 Year Range): | Bullish | Bearish | Bearish |
| NET POSITION MOVEMENT INDEX: | |||
| – 6-Week Change in Strength Index: | 0.5 | 1.3 | -12.0 |
Article By CountingPips.com – Receive our weekly COT Reports by Email
*COT Report: The COT data, released weekly to the public each Friday, is updated through the most recent Tuesday (data is 3 days old) and shows a quick view of how large speculators or non-commercials (for-profit traders) were positioned in the futures markets.
The CFTC categorizes trader positions according to commercial hedgers (traders who use futures contracts for hedging as part of the business), non-commercials (large traders who speculate to realize trading profits) and nonreportable traders (usually small traders/speculators).
Find CFTC criteria here: (http://www.cftc.gov/MarketReports/CommitmentsofTraders/ExplanatoryNotes/index.htm).

- The US Tech sector hit by sell‑off. Oil prices decline on renewed negotiations Jul 28, 2026
- Gold Declines, Focus on Fed and Falling Oil Prices Jul 28, 2026
- This week will be one of the most crowded for central‑bank meetings Jul 27, 2026
- EUR/USD Ahead of a Key Week: Holding Near Lows Jul 27, 2026
- COT Metals Charts: Weekly Speculator Changes led by Copper Jul 26, 2026
- COT Bonds Charts: Speculator Bets led by SOFR 3-Months & 5-Year Bonds Jul 26, 2026
- COT Energy Charts: Weekly Speculator Bets led by WTI Crude & Natural Gas Jul 26, 2026
- COT Soft Commodities Charts: Weekly Speculator Bets led by Corn & Soybeans Jul 26, 2026
- The US introduces new import tariffs for 60 countries. Brent crude surpasses $100 per barrel Jul 24, 2026
- USD/JPY Breaks Records: Nothing Slows the Yen’s Decline Jul 24, 2026