
Article By RoboForex.com
GBPUSD, “Great Britain Pound vs US Dollar”
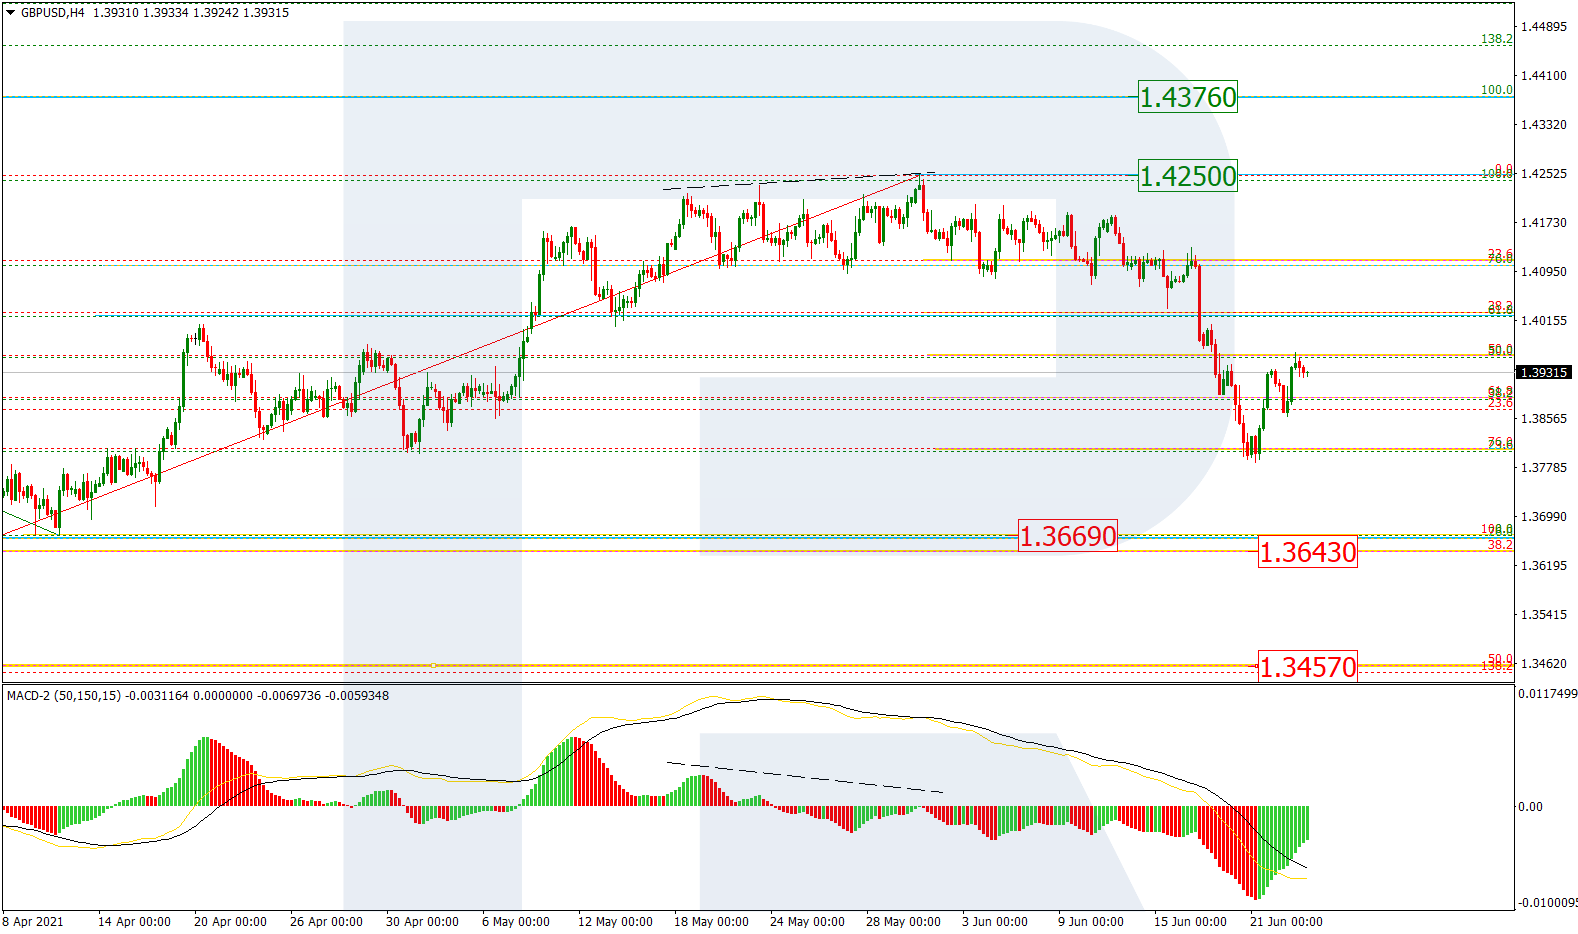
As we can see in the H4 chart, after falling and reaching 76.0% fibo, the asset has rebounded to start a new correction to the upside. After completing this pullback, GBPUSD may form another descending wave to break the support at 1.3669 and then continue falling towards 38.2% and 50.0% fibo at 1.3643 and 1.3457 respectively. An alternative scenario implies that the correction may transform into a rising wave to reach 1.4250 and 1.4376 but it’s very unlikely.

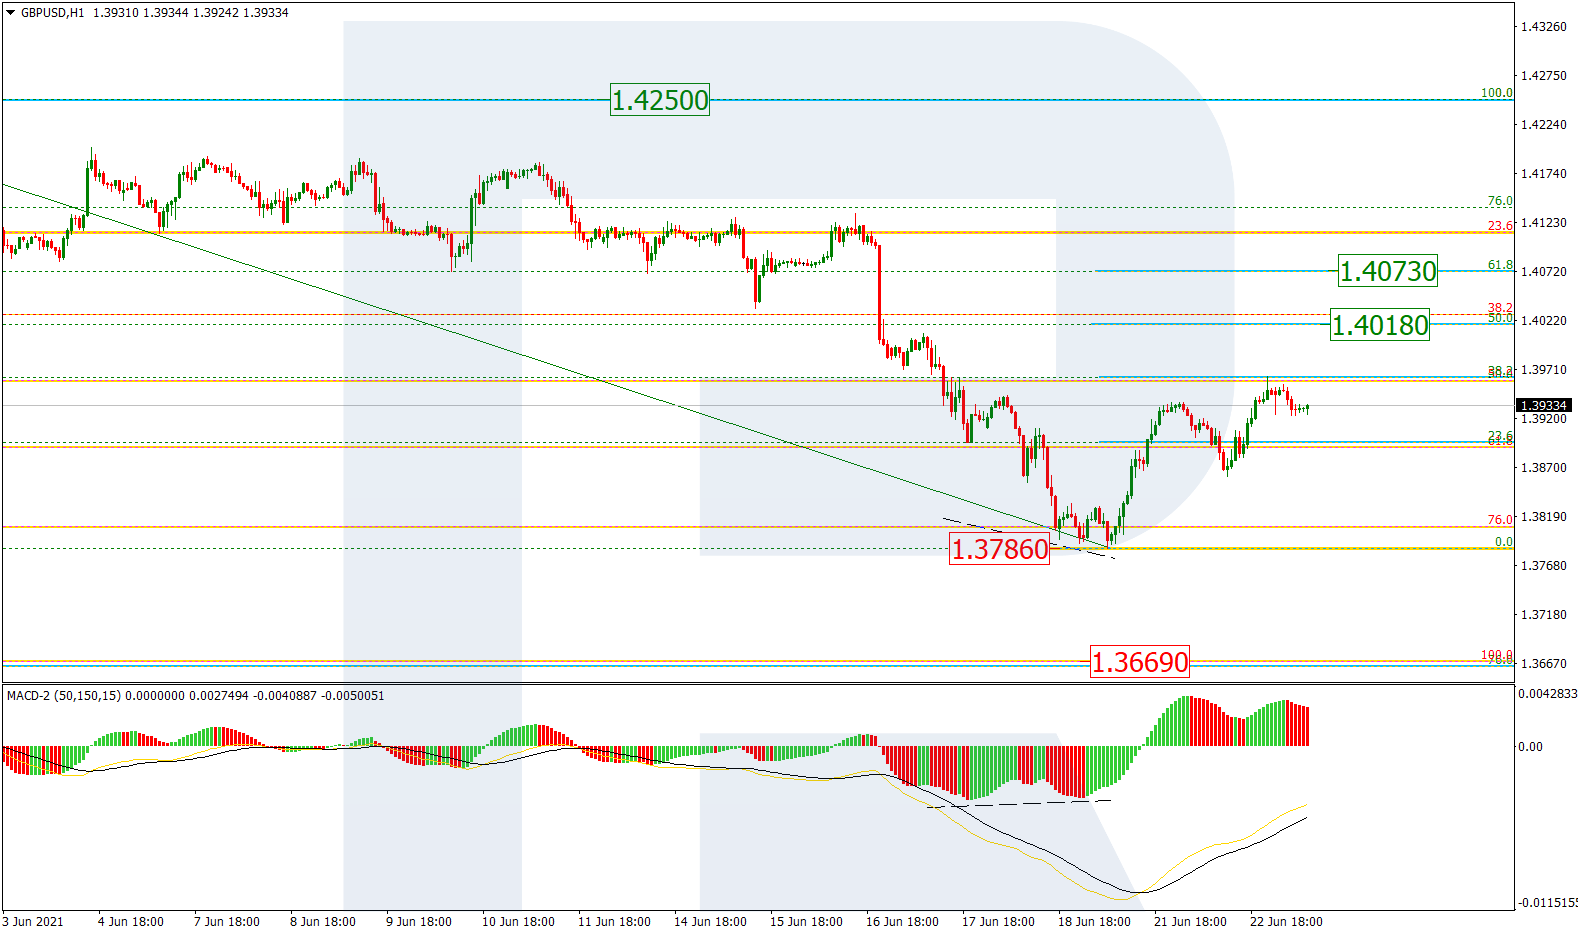
The H1 chart shows a correctional uptrend after a convergence on MACD, which has already reached 38.2% fibo and may later continue towards 50.0%and 61.8% fibo at 1.4018 and 1.4073 respectively. The local support is 1.3786, a breakout of which may complete the correction.
Free Reports:
 Get our Weekly Commitment of Traders Reports - See where the biggest traders (Hedge Funds and Commercial Hedgers) are positioned in the futures markets on a weekly basis.
 Sign Up for Our Stock Market Newsletter – Get updated on News, Charts & Rankings of Public Companies when you join our Stocks Newsletter
EURJPY, “Euro vs. Japanese Yen”
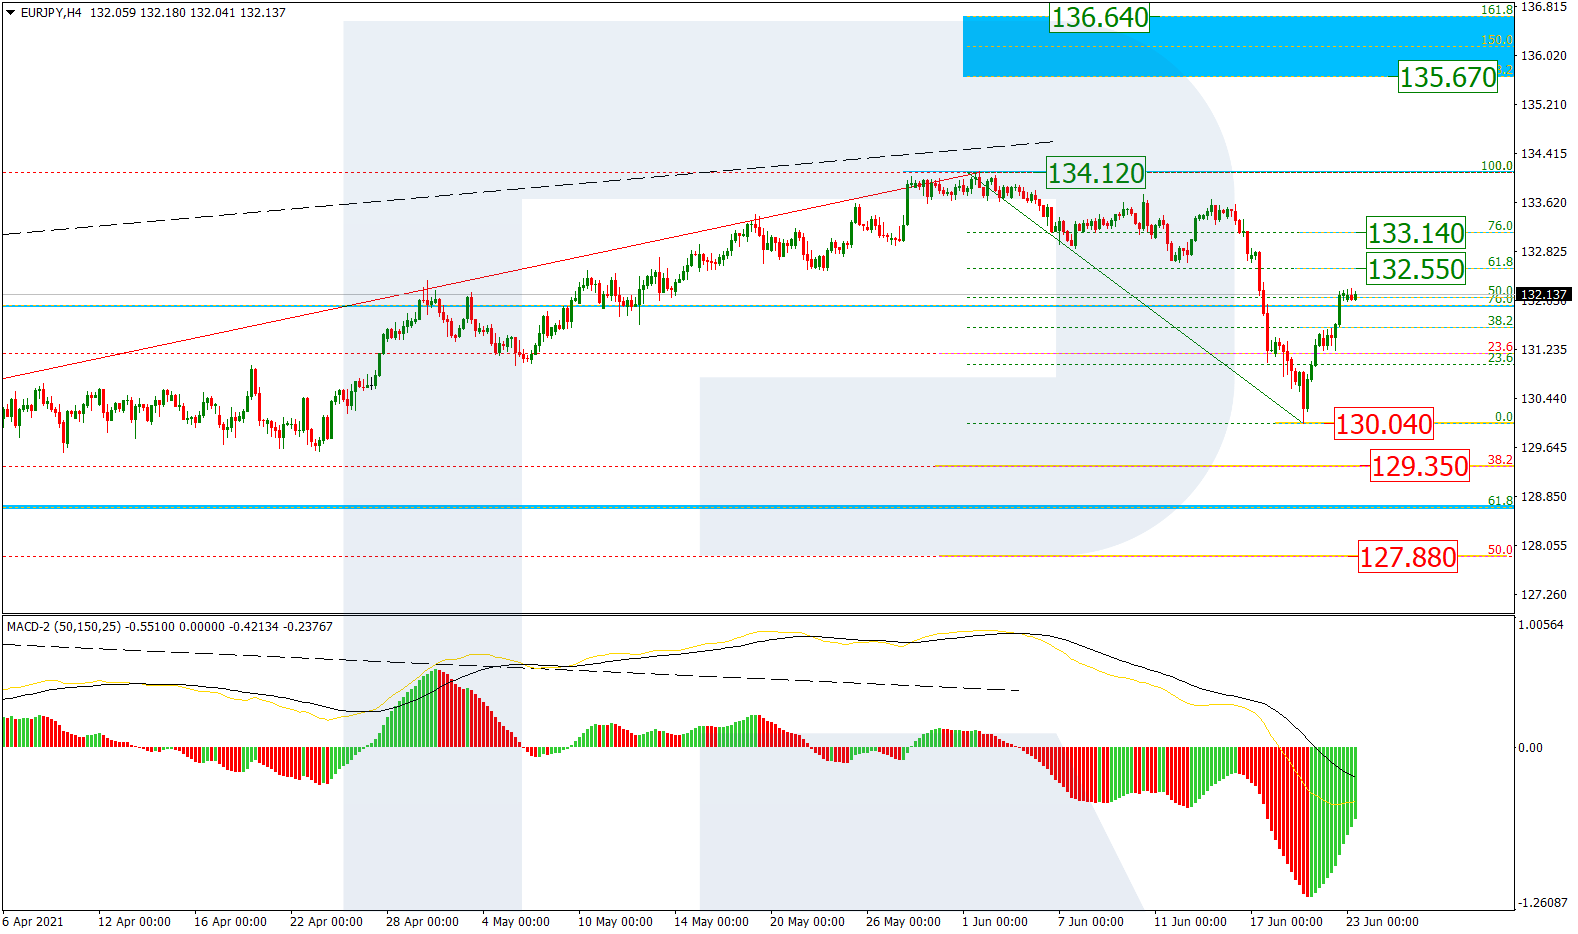
In the H4 chart, after finishing a quick correctional wave to the downside, which, after breaking 23.6% fibo, failed to reach 38.2% fibo at 129.35, EURJPY has started a new growth that may transform into a proper rising wave. If the asset fails to reach and break the high at 134.12, the pair may start a new decline to break the support at 130.04 and then continue falling towards 38.2% and 50.0% fibo at 129.35 and 127.88 respectively. At the same time, a breakout of the current high will result in a further uptrend towards the post-correctional extension area between 138.2% and 161.8% fibo at 135.67 and 136.64 respectively.
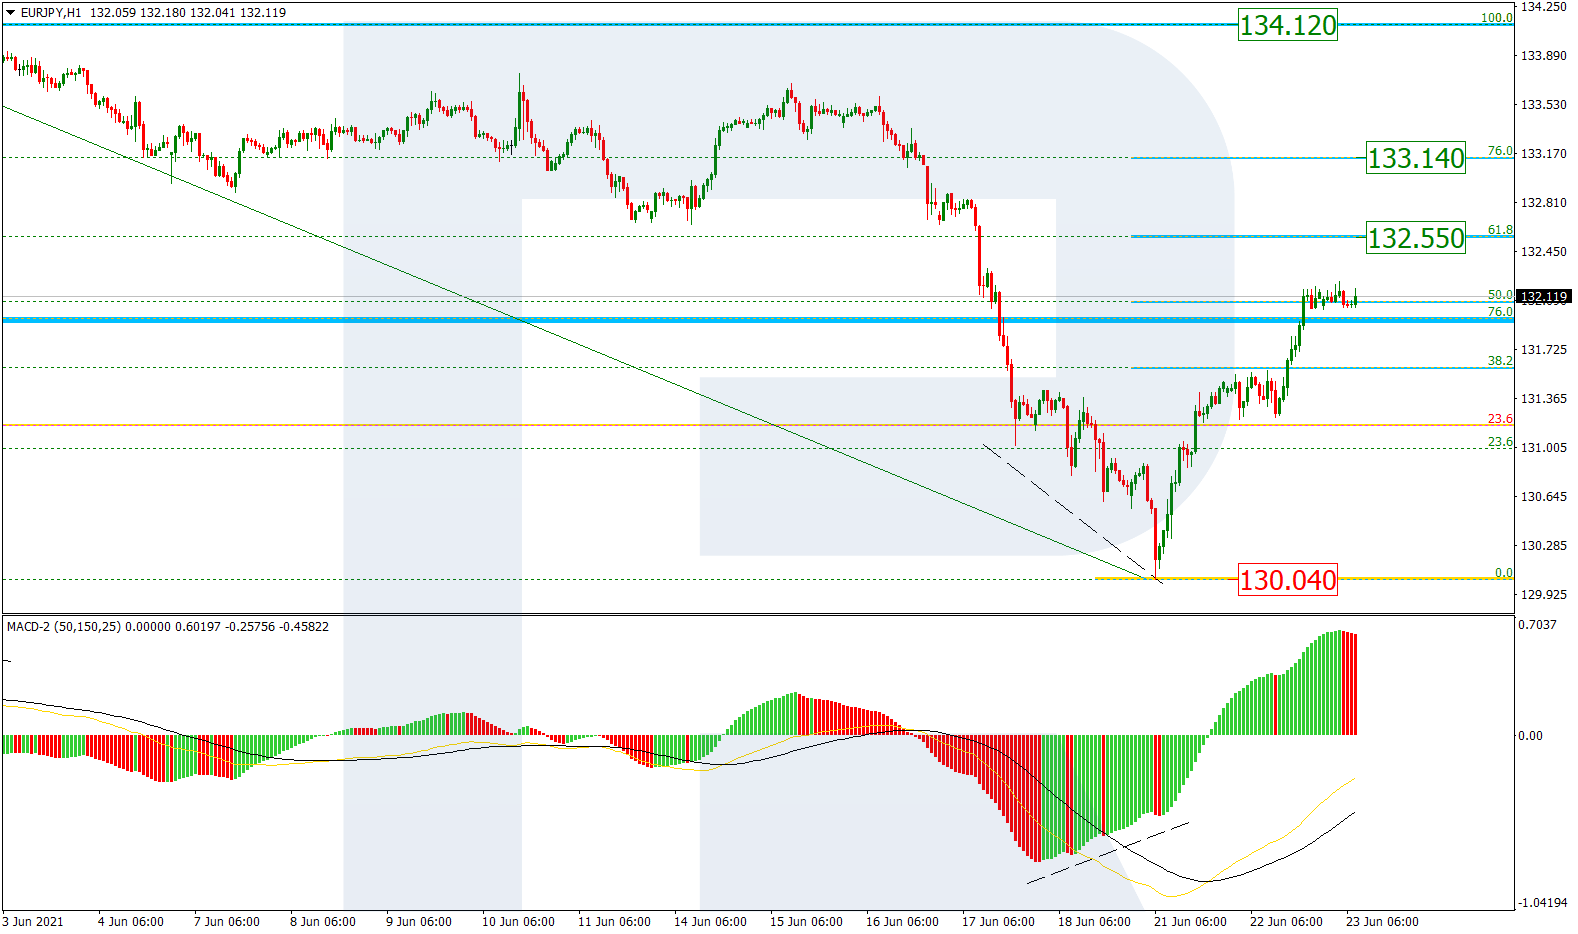
As we can see in the H1 chart, the asset is correcting upwards after a convergence on MACD. It has already reached 50.0% fibo and may later continue growing towards 61.8% and 76.0% fibo at 132.55 and 133.14 respectively. However, the key upside target is the high at 134.12. The support is the low at 130.04.
Article By RoboForex.com
Attention!
Forecasts presented in this section only reflect the author’s private opinion and should not be considered as guidance for trading. RoboForex LP bears no responsibility for trading results based on trading recommendations described in these analytical reviews.

- GBP/USD at Month’s Lows: The Outlook Remains Weak Jul 29, 2026
- Crude oil falls below $80 per barrel. Australia sees inflation slowdown Jul 29, 2026
- The US Tech sector hit by sell‑off. Oil prices decline on renewed negotiations Jul 28, 2026
- Gold Declines, Focus on Fed and Falling Oil Prices Jul 28, 2026
- This week will be one of the most crowded for central‑bank meetings Jul 27, 2026
- EUR/USD Ahead of a Key Week: Holding Near Lows Jul 27, 2026
- COT Metals Charts: Weekly Speculator Changes led by Copper Jul 26, 2026
- COT Bonds Charts: Speculator Bets led by SOFR 3-Months & 5-Year Bonds Jul 26, 2026
- COT Energy Charts: Weekly Speculator Bets led by WTI Crude & Natural Gas Jul 26, 2026
- COT Soft Commodities Charts: Weekly Speculator Bets led by Corn & Soybeans Jul 26, 2026
