
By Orbex
USDCHF faces strong resistance

The US dollar struggled to bounce back after the US labor market showed inconsistencies. Despite a week-long consolidation above 0.9075, the bearish momentum was a reminder that sellers are still in charge of the price action.
The RSI’s double-dip into the oversold territory may prompt short-term traders to take some chips off the table triggering a limited rebound.
0.9100 is a tough resistance where trend-followers could be on standby. A failure to break out would lead to renewed pressure towards 0.8940.
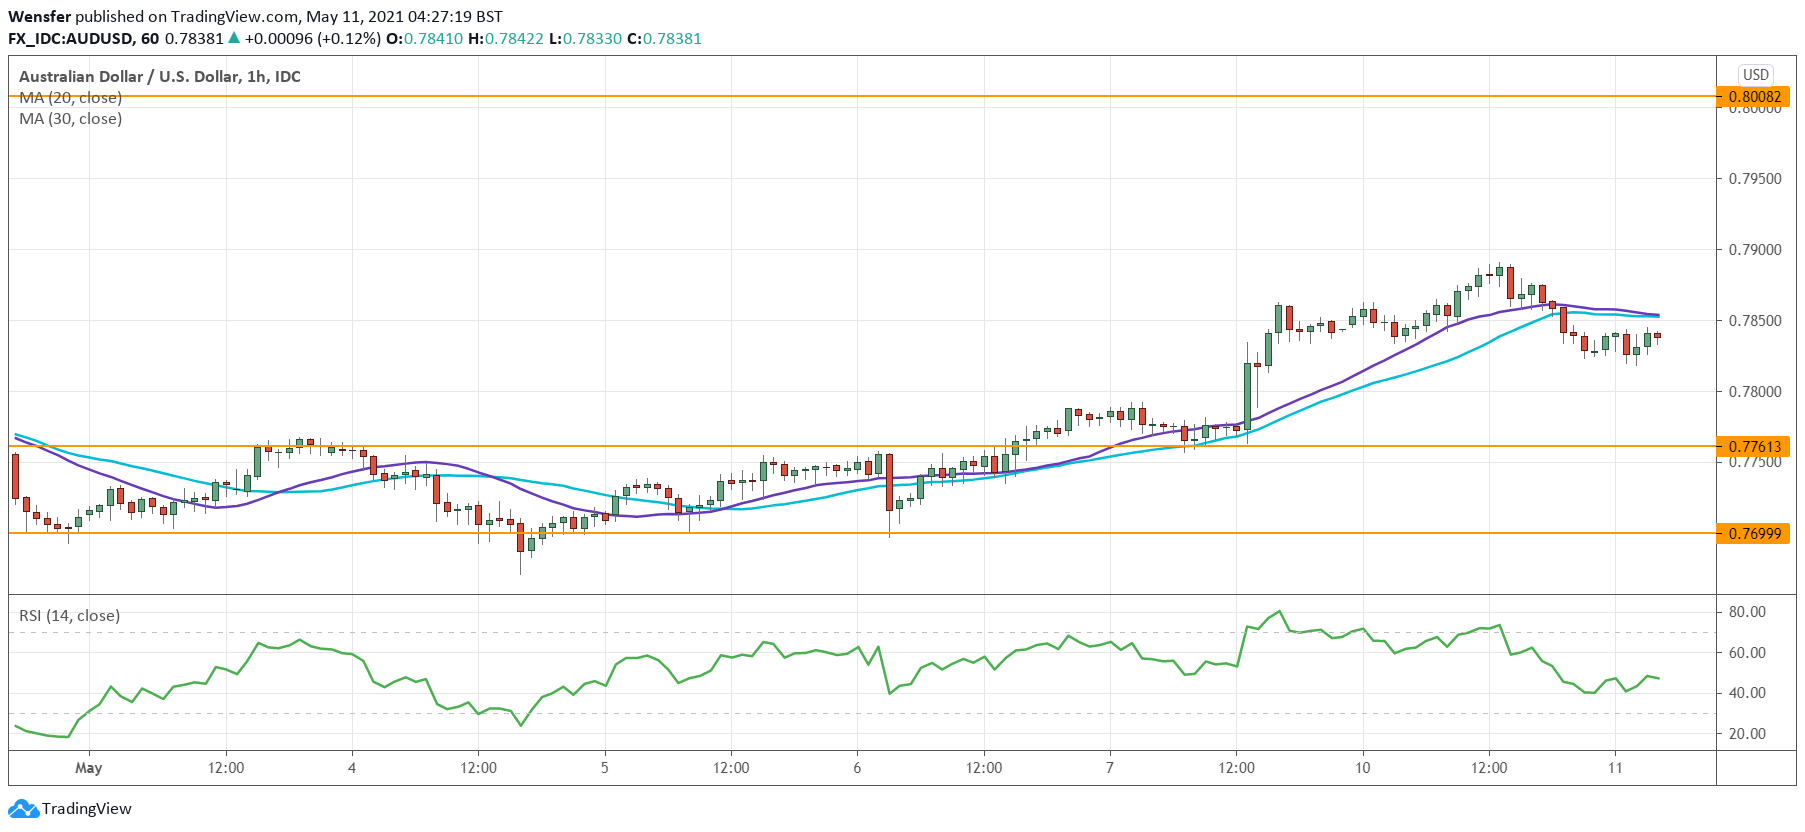
AUDUSD rallies towards February’s high
Free Reports:
 Download Our Metatrader 4 Indicators – Put Our Free MetaTrader 4 Custom Indicators on your charts when you join our Weekly Newsletter
 Get our Weekly Commitment of Traders Reports - See where the biggest traders (Hedge Funds and Commercial Hedgers) are positioned in the futures markets on a weekly basis.
The Australian dollar has found solid support from rallies in commodity prices. The pair saw strong momentum after it cleared the triple top at 0.7810.
From the daily chart’s perspective, a bullish close above the supply zone around 0.7850 could confirm the bullish MA and resume the uptrend from March 2020.
The previous high at 0.8010 would be the next target. 0.7835 near the 30-hour moving average struggles as a support, which means that 0.7760 is the second line of defense in case of a deeper correction.
XAGUSD hovers under major resistance
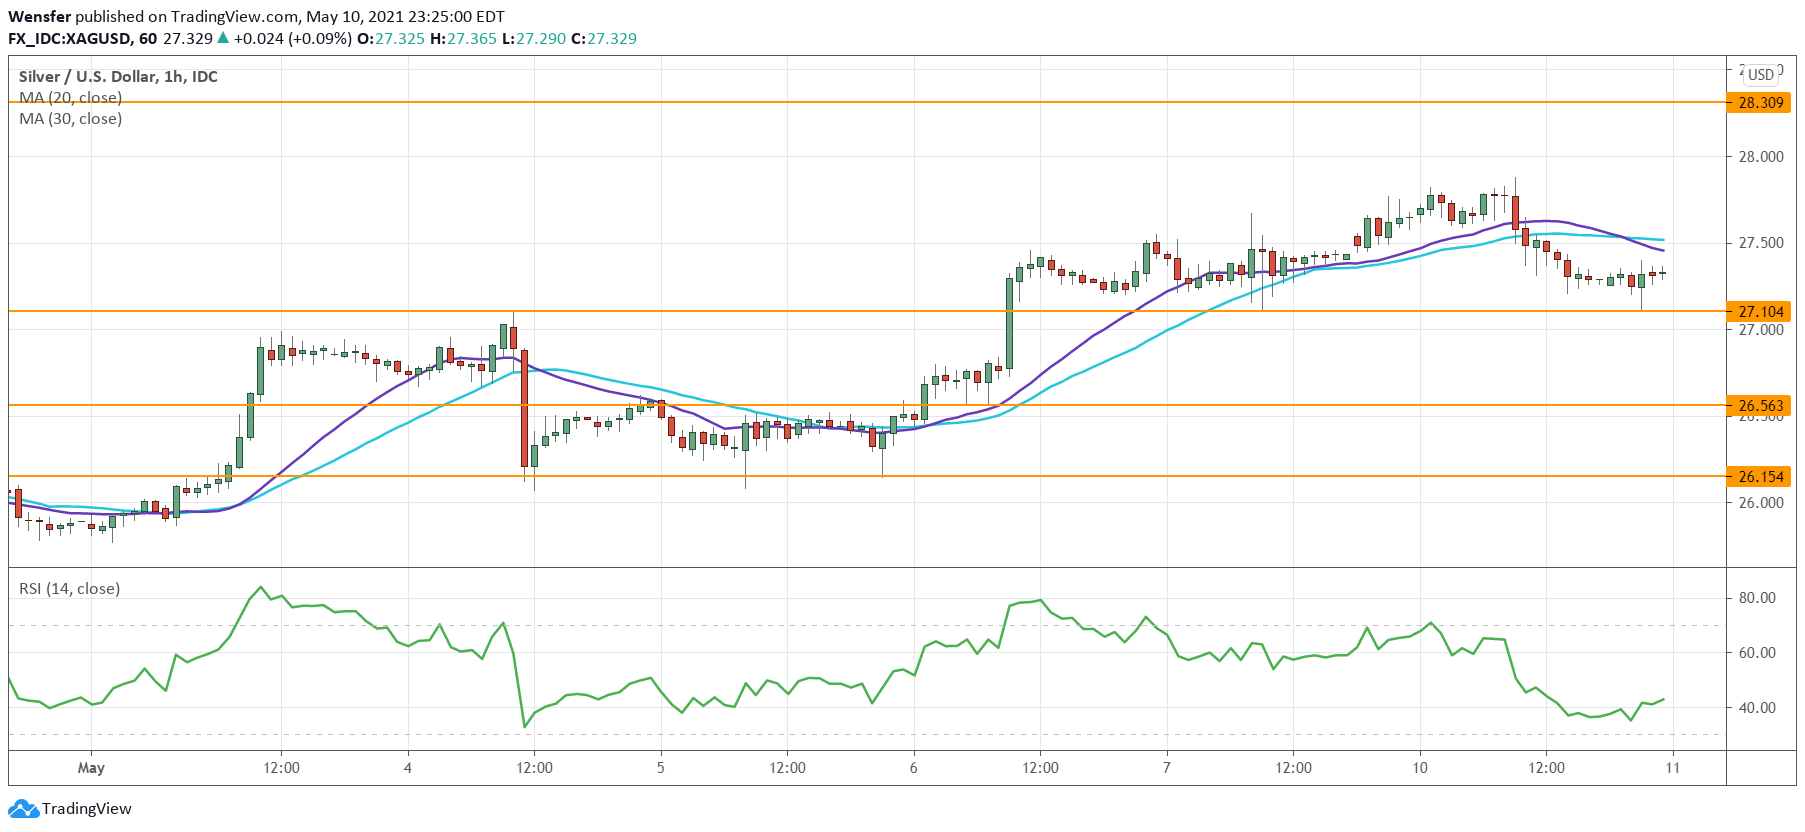
Bullions prices grind higher as the US dollar remains under pressure. The recovery accelerated after silver broke above the daily resistance at 26.60.
28.30 is a major hurdle ahead and a bullish breakout could extend the rally towards 30. Though an overbought RSI would suggest a potential retreat to attract more buying interest.
The resistance-turned-support 27.10 is the first level to monitor. Further down, the demand zone between 26.15 and 26.56 is key in keeping the upward bias intact
By Orbex

- The US indices sell off amid renewed US-Iran clashes. Oil jumps by 7% Jul 30, 2026
- USD/JPY Temporary in Equilibrium: Multiple Factors in Focus Jul 30, 2026
- GBP/USD at Month’s Lows: The Outlook Remains Weak Jul 29, 2026
- Crude oil falls below $80 per barrel. Australia sees inflation slowdown Jul 29, 2026
- The US Tech sector hit by sell‑off. Oil prices decline on renewed negotiations Jul 28, 2026
- Gold Declines, Focus on Fed and Falling Oil Prices Jul 28, 2026
- This week will be one of the most crowded for central‑bank meetings Jul 27, 2026
- EUR/USD Ahead of a Key Week: Holding Near Lows Jul 27, 2026
- COT Metals Charts: Weekly Speculator Changes led by Copper Jul 26, 2026
- COT Bonds Charts: Speculator Bets led by SOFR 3-Months & 5-Year Bonds Jul 26, 2026