
By CountingPips.com COT Home | Data Tables | Data Downloads | Newsletter
Here are the latest charts and statistics for the Commitment of Traders (COT) data published by the Commodities Futures Trading Commission (CFTC).
The latest COT data is updated through Tuesday May 04 2021 and shows a quick view of how large traders (for-profit speculators and commercial entities) were positioned in the futures markets.
VIX Volatility Futures Futures:
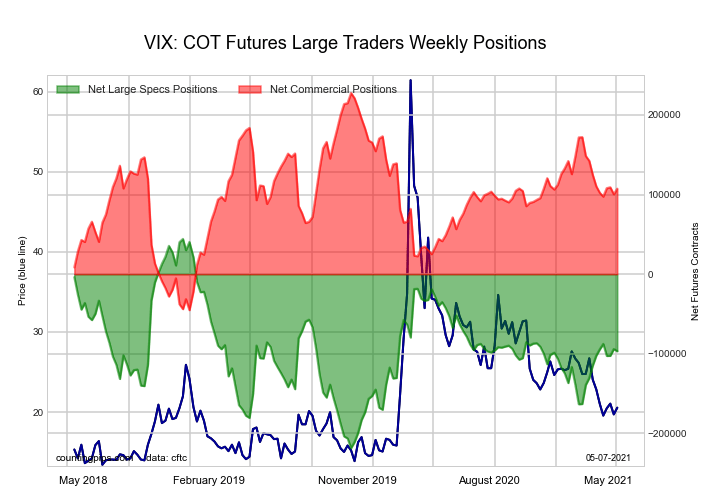
The VIX Volatility Futures large speculator standing this week totaled a net position of -96,698 contracts in the data reported through Tuesday. This was a weekly decrease of -2,669 contracts from the previous week which had a total of -94,029 net contracts.
This week’s current strength score (the trader positioning range over the past three years, measured from 0 to 100) shows the speculators are currently Bearish with a score of 46.3 percent. The commercials are Bullish with a score of 55.9 percent and the small traders (not shown in chart) are Bearish-Extreme with a score of 15.9 percent.
| VIX Volatility Futures Statistics | SPECULATORS | COMMERCIALS | SMALL TRADERS |
| – Percent of Open Interest Longs: | 18.5 | 57.8 | 5.7 |
| – Percent of Open Interest Shorts: | 45.4 | 28.0 | 8.6 |
| – Net Position: | -96,698 | 107,369 | -10,671 |
| – Gross Longs: | 66,733 | 208,054 | 20,409 |
| – Gross Shorts: | 163,431 | 100,685 | 31,080 |
| – Long to Short Ratio: | 0.4 to 1 | 2.1 to 1 | 0.7 to 1 |
| NET POSITION TREND: | |||
| – COT Index Score (3 Year Range Pct): | 46.3 | 55.9 | 15.9 |
| – COT Index Reading (3 Year Range): | Bearish | Bullish | Bearish-Extreme |
| NET POSITION MOVEMENT INDEX: | |||
| – 6-Week Change in Strength Index: | 2.1 | -1.1 | -9.9 |
Free Reports:
 Sign Up for Our Stock Market Newsletter – Get updated on News, Charts & Rankings of Public Companies when you join our Stocks Newsletter
 Get our Weekly Commitment of Traders Reports - See where the biggest traders (Hedge Funds and Commercial Hedgers) are positioned in the futures markets on a weekly basis.
S&P500 Mini Futures Futures:
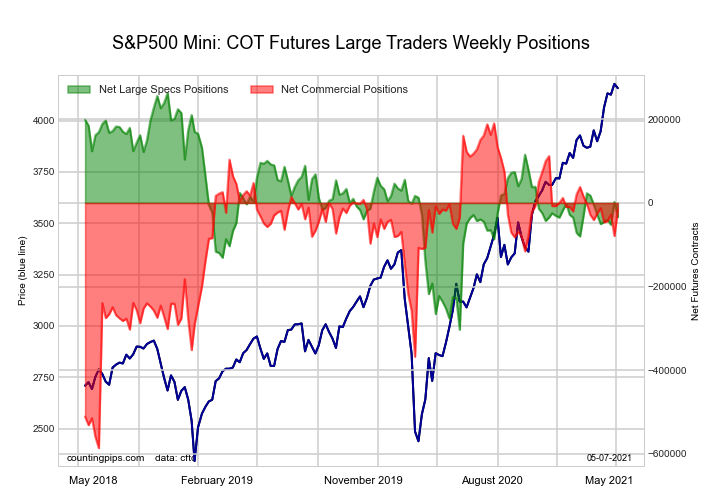
The S&P500 Mini Futures large speculator standing this week totaled a net position of -33,815 contracts in the data reported through Tuesday. This was a weekly fall of -36,099 contracts from the previous week which had a total of 2,284 net contracts.
This week’s current strength score (the trader positioning range over the past three years, measured from 0 to 100) shows the speculators are currently Bearish with a score of 47.6 percent. The commercials are Bullish with a score of 73.3 percent and the small traders (not shown in chart) are Bearish with a score of 32.4 percent.
| S&P500 Mini Futures Statistics | SPECULATORS | COMMERCIALS | SMALL TRADERS |
| – Percent of Open Interest Longs: | 13.8 | 72.9 | 10.9 |
| – Percent of Open Interest Shorts: | 15.1 | 73.5 | 9.1 |
| – Net Position: | -33,815 | -16,645 | 50,460 |
| – Gross Longs: | 373,636 | 1,971,499 | 295,639 |
| – Gross Shorts: | 407,451 | 1,988,144 | 245,179 |
| – Long to Short Ratio: | 0.9 to 1 | 1.0 to 1 | 1.2 to 1 |
| NET POSITION TREND: | |||
| – COT Index Score (3 Year Range Pct): | 47.6 | 73.3 | 32.4 |
| – COT Index Reading (3 Year Range): | Bearish | Bullish | Bearish |
| NET POSITION MOVEMENT INDEX: | |||
| – 6-Week Change in Strength Index: | -1.0 | 1.1 | -0.6 |
Dow Jones Mini Futures Futures:
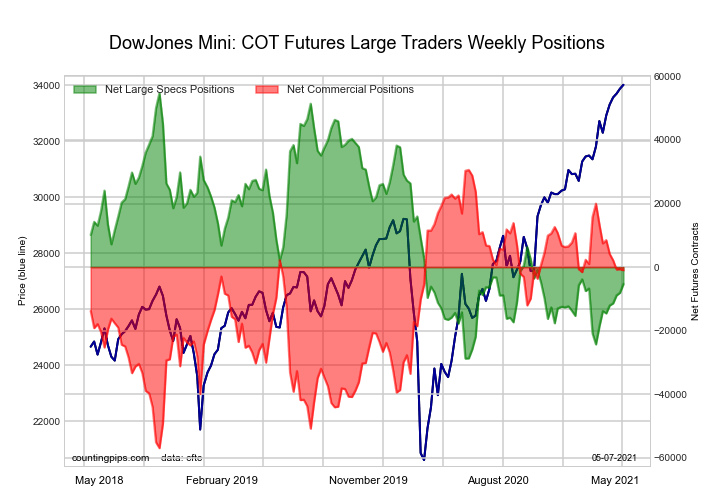
The Dow Jones Mini Futures large speculator standing this week totaled a net position of -5,294 contracts in the data reported through Tuesday. This was a weekly advance of 2,762 contracts from the previous week which had a total of -8,056 net contracts.
This week’s current strength score (the trader positioning range over the past three years, measured from 0 to 100) shows the speculators are currently Bearish with a score of 28.1 percent. The commercials are Bullish with a score of 64.0 percent and the small traders (not shown in chart) are Bullish with a score of 80.0 percent.
| Dow Jones Mini Futures Statistics | SPECULATORS | COMMERCIALS | SMALL TRADERS |
| – Percent of Open Interest Longs: | 30.4 | 46.1 | 20.9 |
| – Percent of Open Interest Shorts: | 36.1 | 47.1 | 14.1 |
| – Net Position: | -5,294 | -964 | 6,258 |
| – Gross Longs: | 27,923 | 42,372 | 19,238 |
| – Gross Shorts: | 33,217 | 43,336 | 12,980 |
| – Long to Short Ratio: | 0.8 to 1 | 1.0 to 1 | 1.5 to 1 |
| NET POSITION TREND: | |||
| – COT Index Score (3 Year Range Pct): | 28.1 | 64.0 | 80.0 |
| – COT Index Reading (3 Year Range): | Bearish | Bullish | Bullish |
| NET POSITION MOVEMENT INDEX: | |||
| – 6-Week Change in Strength Index: | 10.2 | -9.6 | -0.5 |
Nasdaq Mini Futures Futures:
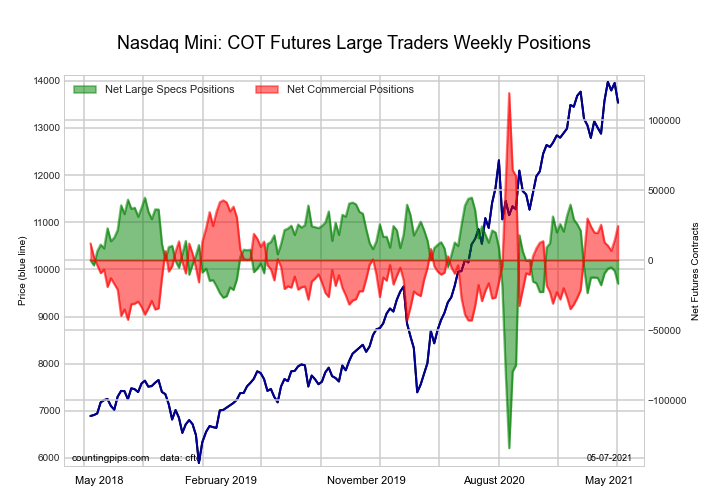
The Nasdaq Mini Futures large speculator standing this week totaled a net position of -16,803 contracts in the data reported through Tuesday. This was a weekly lowering of -9,045 contracts from the previous week which had a total of -7,758 net contracts.
This week’s current strength score (the trader positioning range over the past three years, measured from 0 to 100) shows the speculators are currently Bullish with a score of 65.6 percent. The commercials are Bearish with a score of 41.5 percent and the small traders (not shown in chart) are Bearish with a score of 27.0 percent.
| Nasdaq Mini Futures Statistics | SPECULATORS | COMMERCIALS | SMALL TRADERS |
| – Percent of Open Interest Longs: | 24.1 | 57.4 | 16.4 |
| – Percent of Open Interest Shorts: | 31.2 | 47.1 | 19.6 |
| – Net Position: | -16,803 | 24,388 | -7,585 |
| – Gross Longs: | 57,165 | 136,086 | 38,816 |
| – Gross Shorts: | 73,968 | 111,698 | 46,401 |
| – Long to Short Ratio: | 0.8 to 1 | 1.2 to 1 | 0.8 to 1 |
| NET POSITION TREND: | |||
| – COT Index Score (3 Year Range Pct): | 65.6 | 41.5 | 27.0 |
| – COT Index Reading (3 Year Range): | Bullish | Bearish | Bearish |
| NET POSITION MOVEMENT INDEX: | |||
| – 6-Week Change in Strength Index: | -2.3 | 3.1 | -2.1 |
Russell 2000 Mini Futures Futures:
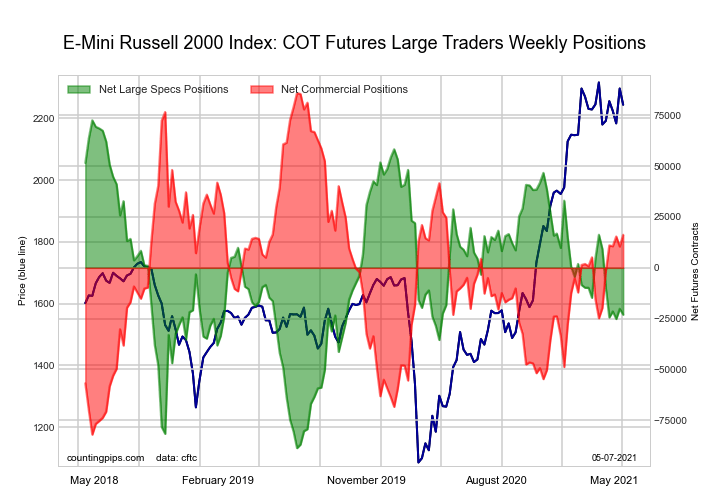
The Russell 2000 Mini Futures large speculator standing this week totaled a net position of -23,065 contracts in the data reported through Tuesday. This was a weekly decrease of -2,893 contracts from the previous week which had a total of -20,172 net contracts.
This week’s current strength score (the trader positioning range over the past three years, measured from 0 to 100) shows the speculators are currently Bearish with a score of 40.7 percent. The commercials are Bullish with a score of 58.5 percent and the small traders (not shown in chart) are Bullish with a score of 52.3 percent.
| Russell 2000 Mini Futures Statistics | SPECULATORS | COMMERCIALS | SMALL TRADERS |
| – Percent of Open Interest Longs: | 13.7 | 79.4 | 6.0 |
| – Percent of Open Interest Shorts: | 18.8 | 75.8 | 4.4 |
| – Net Position: | -23,065 | 16,230 | 6,835 |
| – Gross Longs: | 61,721 | 357,168 | 26,839 |
| – Gross Shorts: | 84,786 | 340,938 | 20,004 |
| – Long to Short Ratio: | 0.7 to 1 | 1.0 to 1 | 1.3 to 1 |
| NET POSITION TREND: | |||
| – COT Index Score (3 Year Range Pct): | 40.7 | 58.5 | 52.3 |
| – COT Index Reading (3 Year Range): | Bearish | Bullish | Bullish |
| NET POSITION MOVEMENT INDEX: | |||
| – 6-Week Change in Strength Index: | -20.0 | 21.4 | -10.3 |
Nikkei Stock Average (USD) Futures Futures:
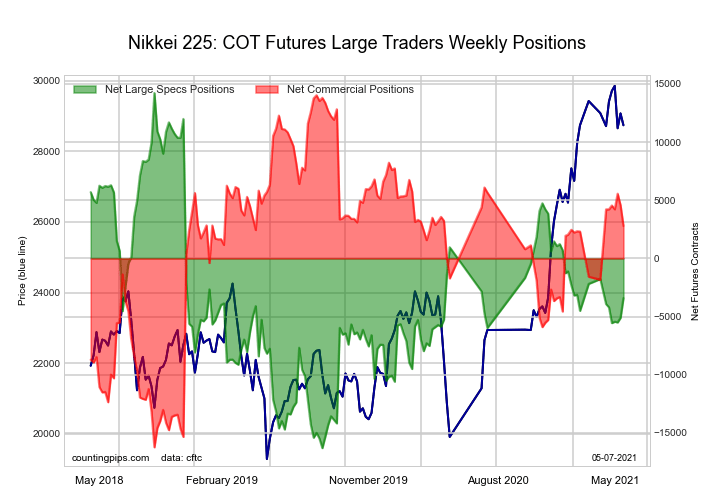
The Nikkei Stock Average (USD) Futures large speculator standing this week totaled a net position of -3,407 contracts in the data reported through Tuesday. This was a weekly gain of 1,695 contracts from the previous week which had a total of -5,102 net contracts.
This week’s current strength score (the trader positioning range over the past three years, measured from 0 to 100) shows the speculators are currently Bearish with a score of 42.2 percent. The commercials are Bullish with a score of 62.9 percent and the small traders (not shown in chart) are Bearish with a score of 25.7 percent.
| Nikkei Stock Average Futures Statistics | SPECULATORS | COMMERCIALS | SMALL TRADERS |
| – Percent of Open Interest Longs: | 14.0 | 60.3 | 25.7 |
| – Percent of Open Interest Shorts: | 36.1 | 42.1 | 21.7 |
| – Net Position: | -3,407 | 2,794 | 613 |
| – Gross Longs: | 2,156 | 9,286 | 3,954 |
| – Gross Shorts: | 5,563 | 6,492 | 3,341 |
| – Long to Short Ratio: | 0.4 to 1 | 1.4 to 1 | 1.2 to 1 |
| NET POSITION TREND: | |||
| – COT Index Score (3 Year Range Pct): | 42.2 | 62.9 | 25.7 |
| – COT Index Reading (3 Year Range): | Bearish | Bullish | Bearish |
| NET POSITION MOVEMENT INDEX: | |||
| – 6-Week Change in Strength Index: | 1.7 | -4.7 | 10.7 |
MSCI EAFE Mini Futures Futures:
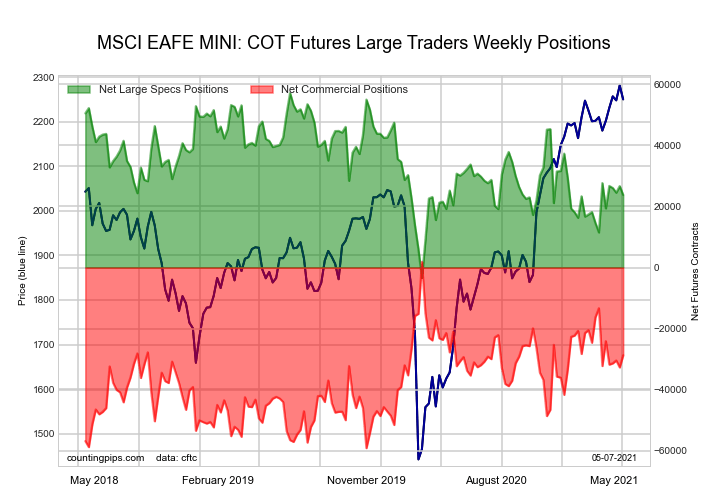
The MSCI EAFE Mini Futures large speculator standing this week totaled a net position of 23,788 contracts in the data reported through Tuesday. This was a weekly reduction of -2,884 contracts from the previous week which had a total of 26,672 net contracts.
This week’s current strength score (the trader positioning range over the past three years, measured from 0 to 100) shows the speculators are currently Bearish with a score of 44.9 percent. The commercials are Bearish with a score of 49.8 percent and the small traders (not shown in chart) are Bullish with a score of 60.9 percent.
| MSCI EAFE Mini Futures Statistics | SPECULATORS | COMMERCIALS | SMALL TRADERS |
| – Percent of Open Interest Longs: | 8.8 | 88.4 | 2.6 |
| – Percent of Open Interest Shorts: | 3.0 | 95.4 | 1.3 |
| – Net Position: | 23,788 | -28,749 | 4,961 |
| – Gross Longs: | 36,067 | 361,342 | 10,427 |
| – Gross Shorts: | 12,279 | 390,091 | 5,466 |
| – Long to Short Ratio: | 2.9 to 1 | 0.9 to 1 | 1.9 to 1 |
| NET POSITION TREND: | |||
| – COT Index Score (3 Year Range Pct): | 44.9 | 49.8 | 60.9 |
| – COT Index Reading (3 Year Range): | Bearish | Bearish | Bullish |
| NET POSITION MOVEMENT INDEX: | |||
| – 6-Week Change in Strength Index: | -6.4 | 5.8 | 3.1 |
MSCI Emerging Mkts Mini Futures Futures:
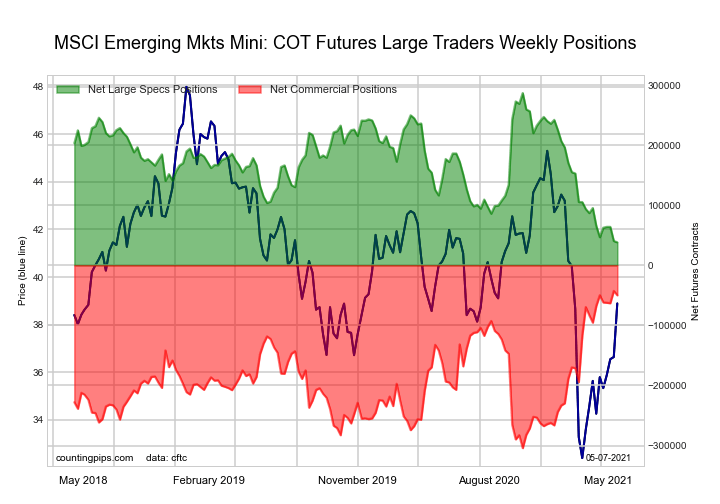
The MSCI Emerging Mkts Mini Futures large speculator standing this week totaled a net position of 38,211 contracts in the data reported through Tuesday. This was a weekly lowering of -2,219 contracts from the previous week which had a total of 40,430 net contracts.
This week’s current strength score (the trader positioning range over the past three years, measured from 0 to 100) shows the speculators are currently Bearish-Extreme with a score of 0.0 percent. The commercials are Bullish-Extreme with a score of 97.2 percent and the small traders (not shown in chart) are Bearish with a score of 40.4 percent.
| MSCI Emerging Mkts Mini Futures Statistics | SPECULATORS | COMMERCIALS | SMALL TRADERS |
| – Percent of Open Interest Longs: | 14.3 | 82.2 | 2.4 |
| – Percent of Open Interest Shorts: | 11.0 | 86.5 | 1.3 |
| – Net Position: | 38,211 | -49,886 | 11,675 |
| – Gross Longs: | 165,150 | 950,685 | 27,250 |
| – Gross Shorts: | 126,939 | 1,000,571 | 15,575 |
| – Long to Short Ratio: | 1.3 to 1 | 1.0 to 1 | 1.7 to 1 |
| NET POSITION TREND: | |||
| – COT Index Score (3 Year Range Pct): | 0.0 | 97.2 | 40.4 |
| – COT Index Reading (3 Year Range): | Bearish-Extreme | Bullish-Extreme | Bearish |
| NET POSITION MOVEMENT INDEX: | |||
| – 6-Week Change in Strength Index: | -11.0 | 6.8 | 7.3 |
Article By CountingPips.com – Receive our weekly COT Reports by Email
*COT Report: The COT data, released weekly to the public each Friday, is updated through the most recent Tuesday (data is 3 days old) and shows a quick view of how large speculators or non-commercials (for-profit traders) were positioned in the futures markets.
The CFTC categorizes trader positions according to commercial hedgers (traders who use futures contracts for hedging as part of the business), non-commercials (large traders who speculate to realize trading profits) and nonreportable traders (usually small traders/speculators).
Find CFTC criteria here: (http://www.cftc.gov/MarketReports/CommitmentsofTraders/ExplanatoryNotes/index.htm).

- The US introduces new import tariffs for 60 countries. Brent crude surpasses $100 per barrel Jul 24, 2026
- USD/JPY Breaks Records: Nothing Slows the Yen’s Decline Jul 24, 2026
- Oil prices reached a 6‑week high. The AUD strengthened on the back of a strong labor‑market report Jul 23, 2026
- EUR/USD Recovers as Dollar Weakens Jul 23, 2026
- Bitcoin rose to $66,000. The New Zealand dollar continues to strengthen Jul 22, 2026
- Inflationary pressure is easing in Canada. In New Zealand, on the contrary, inflation is rising Jul 21, 2026
- GBP/USD Falls After Cabinet Changes Jul 21, 2026
- Geopolitical and macroeconomic conditions continue to pressure market sentiment Jul 20, 2026
- USD/JPY Poised to Continue Gains as Expensive Oil and Lack of Support Weigh on Yen Jul 20, 2026
- COT Metals Charts: Weekly Speculator Bets led by Copper & Steel Jul 18, 2026