By CountingPips.com COT Home | Data Tables | Data Downloads | Newsletter
Here are the latest charts and statistics for the Commitment of Traders (COT) data published by the Commodities Futures Trading Commission (CFTC).
The latest COT data is updated through Tuesday April 27 2021 and shows a quick view of how large traders (for-profit speculators and commercial entities) were positioned in the futures markets.
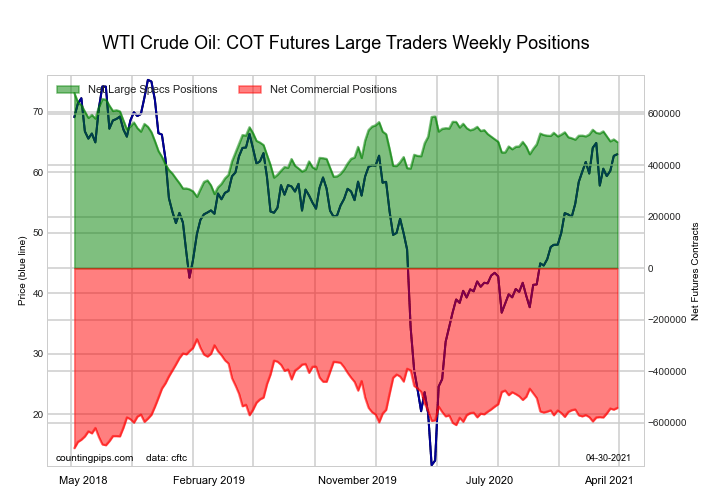
The WTI Crude Oil Futures large speculator standing this week recorded a net position of 489,711 contracts in the data reported through Tuesday. This was a weekly decrease of -10,272 contracts from the previous week which had a total of 499,983 net contracts.
This week’s current strength score (the trader positioning range over the past three years, measured from 0 to 100) shows the speculators are currently Bullish with a score of 52.8 percent. The commercials are Bearish with a score of 36.9 percent and the small traders (not shown in chart) are Bullish-Extreme with a score of 89.2 percent.
| WTI Crude Oil Futures Statistics | SPECULATORS | COMMERCIALS | SMALL TRADERS |
| – Percent of Open Interest Longs: | 27.6 | 35.5 | 4.5 |
| – Percent of Open Interest Shorts: | 6.8 | 58.5 | 2.2 |
| – Net Position: | 489,711 | -542,141 | 52,430 |
| – Gross Longs: | 650,300 | 835,304 | 104,889 |
| – Gross Shorts: | 160,589 | 1,377,445 | 52,459 |
| – Long to Short Ratio: | 4.0 to 1 | 0.6 to 1 | 2.0 to 1 |
| NET POSITION TREND: | |||
| – COT Index Score (3 Year Range Pct): | 52.8 | 36.9 | 89.2 |
| – COT Index Reading (3 Year Range): | Bullish | Bearish | Bullish-Extreme |
| NET POSITION MOVEMENT INDEX: | |||
| – 6-Week Change in Strength Index: | -8.9 | 8.8 | -1.9 |
Free Reports:
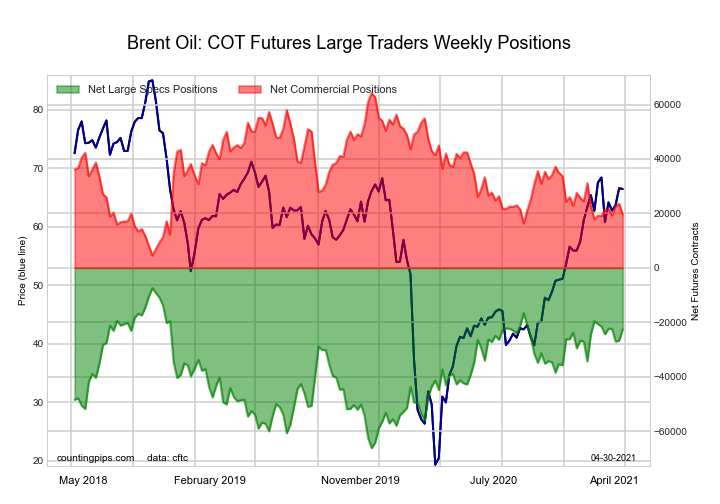
The Brent Crude Oil Futures large speculator standing this week recorded a net position of -22,572 contracts in the data reported through Tuesday. This was a weekly advance of 4,139 contracts from the previous week which had a total of -26,711 net contracts.
This week’s current strength score (the trader positioning range over the past three years, measured from 0 to 100) shows the speculators are currently Bullish with a score of 74.2 percent. The commercials are Bearish with a score of 25.4 percent and the small traders (not shown in chart) are Bearish with a score of 42.5 percent.
| Brent Crude Oil Futures Statistics | SPECULATORS | COMMERCIALS | SMALL TRADERS |
| – Percent of Open Interest Longs: | 18.2 | 47.0 | 4.6 |
| – Percent of Open Interest Shorts: | 29.1 | 37.4 | 3.2 |
| – Net Position: | -22,572 | 19,651 | 2,921 |
| – Gross Longs: | 37,280 | 96,548 | 9,475 |
| – Gross Shorts: | 59,852 | 76,897 | 6,554 |
| – Long to Short Ratio: | 0.6 to 1 | 1.3 to 1 | 1.4 to 1 |
| NET POSITION TREND: | |||
| – COT Index Score (3 Year Range Pct): | 74.2 | 25.4 | 42.5 |
| – COT Index Reading (3 Year Range): | Bullish | Bearish | Bearish |
| NET POSITION MOVEMENT INDEX: | |||
| – 6-Week Change in Strength Index: | -1.8 | 1.0 | 2.9 |
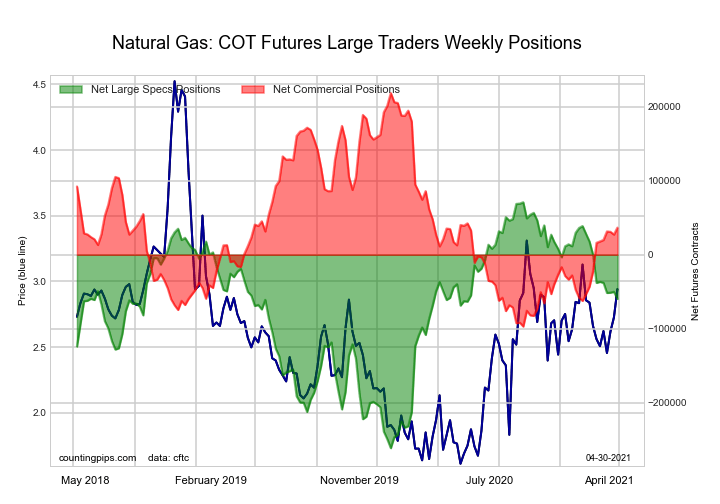
The Natural Gas Futures large speculator standing this week recorded a net position of -59,616 contracts in the data reported through Tuesday. This was a weekly fall of -9,534 contracts from the previous week which had a total of -50,082 net contracts.
This week’s current strength score (the trader positioning range over the past three years, measured from 0 to 100) shows the speculators are currently Bullish with a score of 60.7 percent. The commercials are Bearish with a score of 42.3 percent and the small traders (not shown in chart) are Bearish with a score of 21.0 percent.
| Natural Gas Futures Statistics | SPECULATORS | COMMERCIALS | SMALL TRADERS |
| – Percent of Open Interest Longs: | 21.9 | 42.9 | 5.1 |
| – Percent of Open Interest Shorts: | 27.1 | 39.8 | 3.1 |
| – Net Position: | -59,616 | 36,620 | 22,996 |
| – Gross Longs: | 254,462 | 497,900 | 58,925 |
| – Gross Shorts: | 314,078 | 461,280 | 35,929 |
| – Long to Short Ratio: | 0.8 to 1 | 1.1 to 1 | 1.6 to 1 |
| NET POSITION TREND: | |||
| – COT Index Score (3 Year Range Pct): | 60.7 | 42.3 | 21.0 |
| – COT Index Reading (3 Year Range): | Bullish | Bearish | Bearish |
| NET POSITION MOVEMENT INDEX: | |||
| – 6-Week Change in Strength Index: | -6.5 | 6.5 | 3.6 |
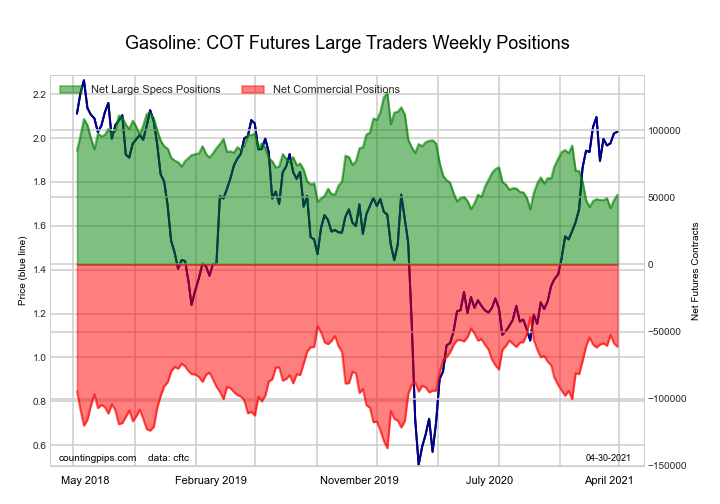
The Gasoline Blendstock Futures large speculator standing this week recorded a net position of 51,905 contracts in the data reported through Tuesday. This was a weekly rise of 3,884 contracts from the previous week which had a total of 48,021 net contracts.
This week’s current strength score (the trader positioning range over the past three years, measured from 0 to 100) shows the speculators are currently Bearish-Extreme with a score of 12.4 percent. The commercials are Bullish with a score of 77.5 percent and the small traders (not shown in chart) are Bullish with a score of 67.2 percent.
| Nasdaq Mini Futures Statistics | SPECULATORS | COMMERCIALS | SMALL TRADERS |
| – Percent of Open Interest Longs: | 25.4 | 47.1 | 6.0 |
| – Percent of Open Interest Shorts: | 11.6 | 63.3 | 3.5 |
| – Net Position: | 51,905 | -61,214 | 9,309 |
| – Gross Longs: | 95,520 | 177,190 | 22,612 |
| – Gross Shorts: | 43,615 | 238,404 | 13,303 |
| – Long to Short Ratio: | 2.2 to 1 | 0.7 to 1 | 1.7 to 1 |
| NET POSITION TREND: | |||
| – COT Index Score (3 Year Range Pct): | 12.4 | 77.5 | 67.2 |
| – COT Index Reading (3 Year Range): | Bearish-Extreme | Bullish | Bullish |
| NET POSITION MOVEMENT INDEX: | |||
| – 6-Week Change in Strength Index: | 3.7 | 0.6 | -22.7 |
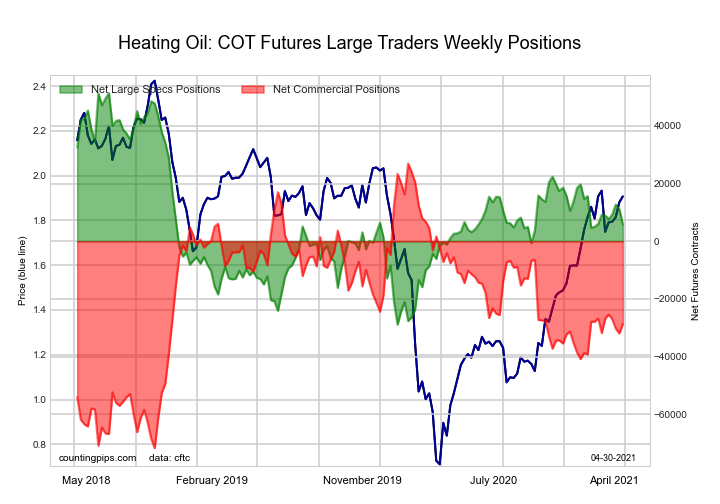
The #2 Heating Oil NY-Harbor Futures large speculator standing this week recorded a net position of 5,828 contracts in the data reported through Tuesday. This was a weekly decline of -5,329 contracts from the previous week which had a total of 11,157 net contracts.
This week’s current strength score (the trader positioning range over the past three years, measured from 0 to 100) shows the speculators are currently Bearish with a score of 43.2 percent. The commercials are Bearish with a score of 43.6 percent and the small traders (not shown in chart) are Bullish-Extreme with a score of 95.2 percent.
| Heating Oil Futures Statistics | SPECULATORS | COMMERCIALS | SMALL TRADERS |
| – Percent of Open Interest Longs: | 15.4 | 48.2 | 11.8 |
| – Percent of Open Interest Shorts: | 13.9 | 55.5 | 6.0 |
| – Net Position: | 5,828 | -28,658 | 22,830 |
| – Gross Longs: | 60,455 | 188,877 | 46,223 |
| – Gross Shorts: | 54,627 | 217,535 | 23,393 |
| – Long to Short Ratio: | 1.1 to 1 | 0.9 to 1 | 2.0 to 1 |
| NET POSITION TREND: | |||
| – COT Index Score (3 Year Range Pct): | 43.2 | 43.6 | 95.2 |
| – COT Index Reading (3 Year Range): | Bearish | Bearish | Bullish-Extreme |
| NET POSITION MOVEMENT INDEX: | |||
| – 6-Week Change in Strength Index: | -4.1 | 3.2 | 0.7 |
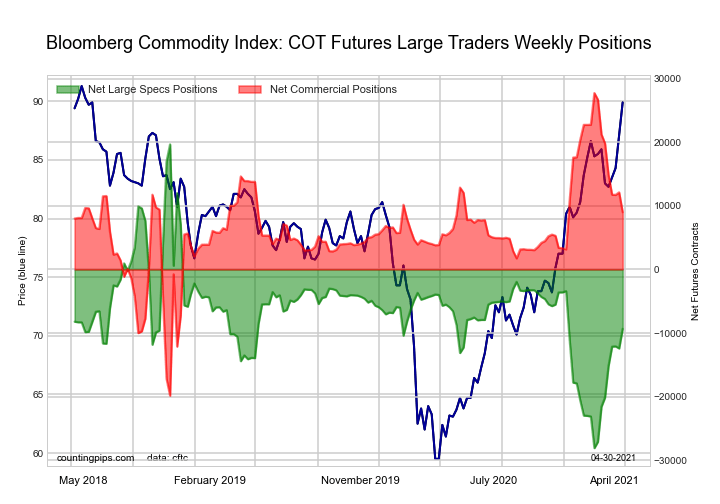
The Bloomberg Commodity Index Futures large speculator standing this week recorded a net position of -9,343 contracts in the data reported through Tuesday. This was a weekly rise of 3,083 contracts from the previous week which had a total of -12,426 net contracts.
This week’s current strength score (the trader positioning range over the past three years, measured from 0 to 100) shows the speculators are currently Bearish with a score of 39.3 percent. The commercials are Bullish with a score of 60.6 percent and the small traders (not shown in chart) are Bullish with a score of 67.1 percent.
| Bloomberg Index Futures Statistics | SPECULATORS | COMMERCIALS | SMALL TRADERS |
| – Percent of Open Interest Longs: | 56.5 | 41.6 | 1.3 |
| – Percent of Open Interest Shorts: | 86.3 | 12.9 | 0.2 |
| – Net Position: | -9,343 | 9,003 | 340 |
| – Gross Longs: | 17,722 | 13,043 | 410 |
| – Gross Shorts: | 27,065 | 4,040 | 70 |
| – Long to Short Ratio: | 0.7 to 1 | 3.2 to 1 | 5.9 to 1 |
| NET POSITION TREND: | |||
| – COT Index Score (3 Year Range Pct): | 39.3 | 60.6 | 67.1 |
| – COT Index Reading (3 Year Range): | Bearish | Bullish | Bullish |
| NET POSITION MOVEMENT INDEX: | |||
| – 6-Week Change in Strength Index: | 25.7 | -25.7 | -1.7 |
Article By CountingPips.com – Receive our weekly COT Reports by Email
*COT Report: The COT data, released weekly to the public each Friday, is updated through the most recent Tuesday (data is 3 days old) and shows a quick view of how large speculators or non-commercials (for-profit traders) were positioned in the futures markets.
The CFTC categorizes trader positions according to commercial hedgers (traders who use futures contracts for hedging as part of the business), non-commercials (large traders who speculate to realize trading profits) and nonreportable traders (usually small traders/speculators).
Find CFTC criteria here: (http://www.cftc.gov/MarketReports/CommitmentsofTraders/ExplanatoryNotes/index.htm).
By Jeffrey Young, Georgia Institute of Technology You’ve probably heard artificial intelligence models described as…
Source: Barry Dawes (7/23/26) Barry Dawes of Martin Place Securities shares his analysis of the…
By JustMarkets The US stock indices ended Thursday’s session with a notable decline amid a…
By Analytical Department RoboForex USD/JPY soared to 163.81 on Friday, marking a new 40-year high.…
By JustMarkets The US equities ended Wednesday’s session lower amid investor caution ahead of the…
By Analytical Department RoboForex EUR/USD rose to 1.1429 on Thursday, with the US dollar continuing…
This website uses cookies.