
Article By RoboForex.com
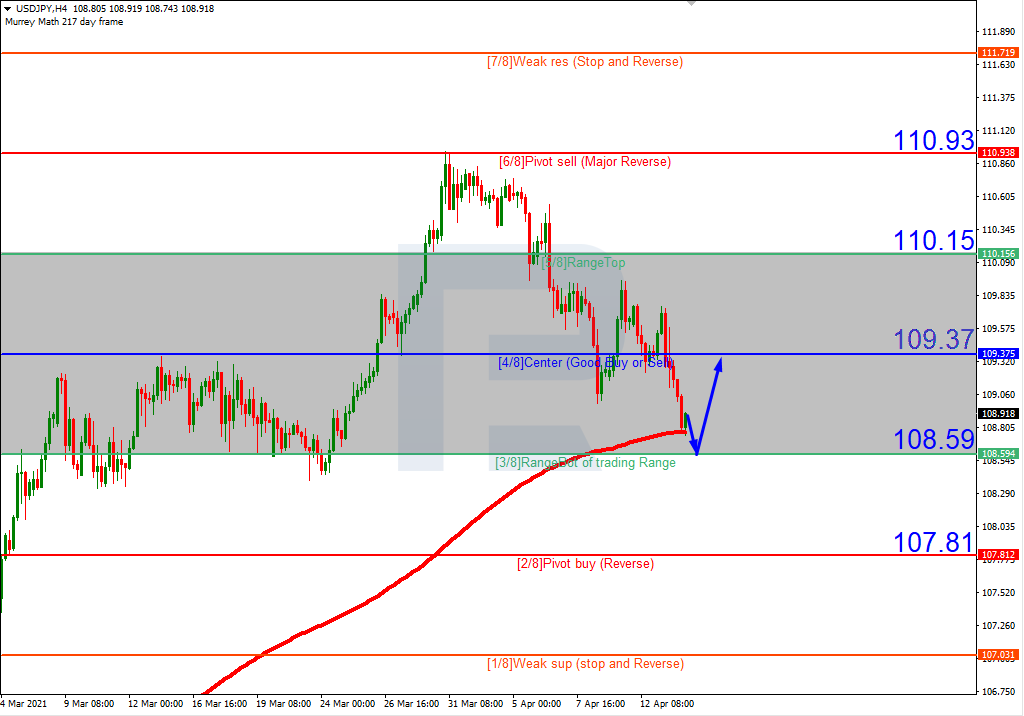
USDJPY, “US Dollar vs. Japanese Yen”
In the H4 chart, USDJPY is consolidating between 3/8 and 5/8. In this case, the price is expected to test 3/8, rebound from it, and then resume growing to reach the resistance at 4/8. However, this scenario may no longer be valid if the price breaks 3/8 to the downside. After that, the instrument may continue falling towards the next support at 2/8.

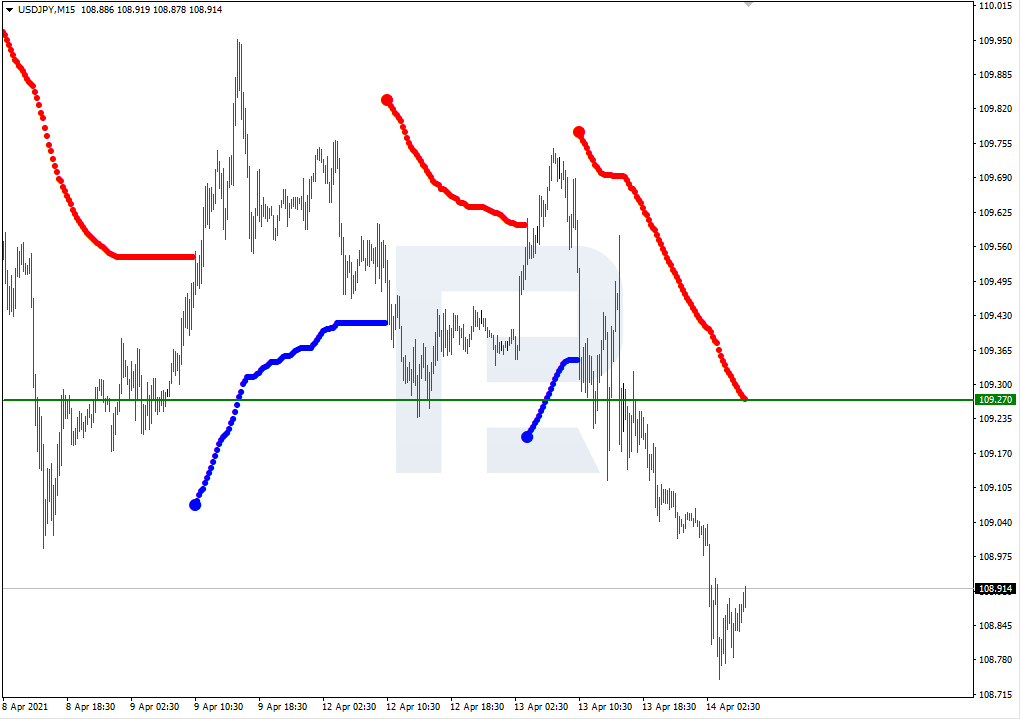
As we can see in the M15 chart, the upside line of the VoltyChannel indicator is pretty far away from the price, that’s why the pair may resume the ascending tendency only after rebounding from 3/8 from the H4 chart.
Free Reports:
 Get our Weekly Commitment of Traders Reports - See where the biggest traders (Hedge Funds and Commercial Hedgers) are positioned in the futures markets on a weekly basis.
 Download Our Metatrader 4 Indicators – Put Our Free MetaTrader 4 Custom Indicators on your charts when you join our Weekly Newsletter
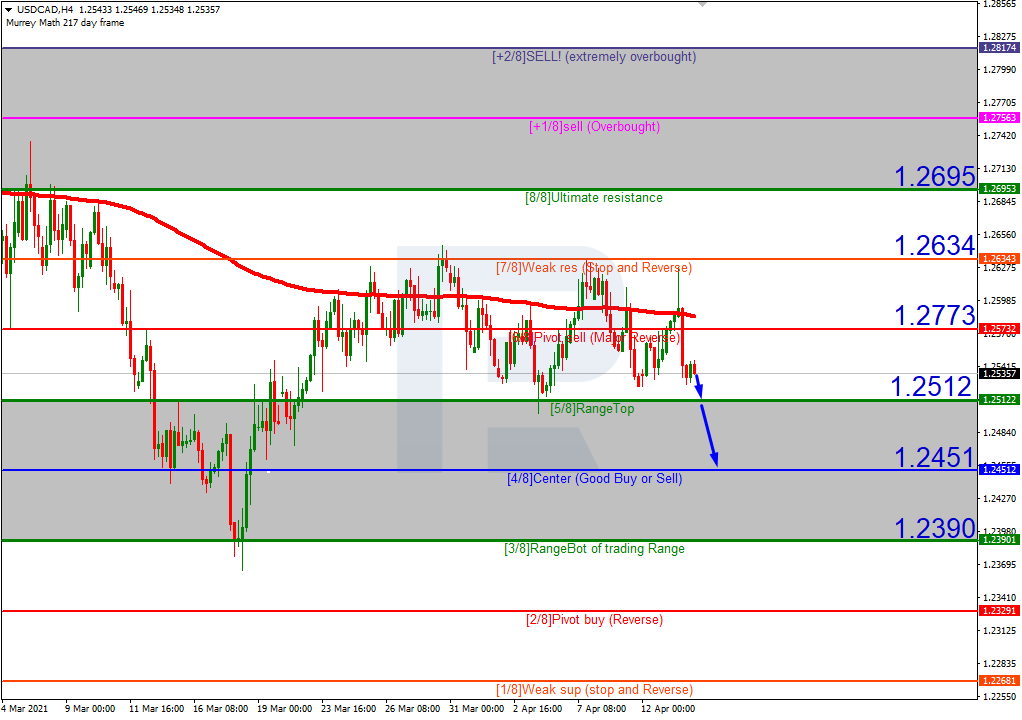
USDCAD, “US Dollar vs Canadian Dollar”
In the H4 chart, after rebounding from the 200-day Moving Average, USDCAD is trading below it, thus indicating a descending tendency. In this case, the price is expected to break 5/8 and continue the descending tendency to reach the support at 4/8. Still, this scenario may no longer be valid if the price breaks 6/8 to the upside. After that, the instrument may reverse and resume growing towards the resistance at 8/8.
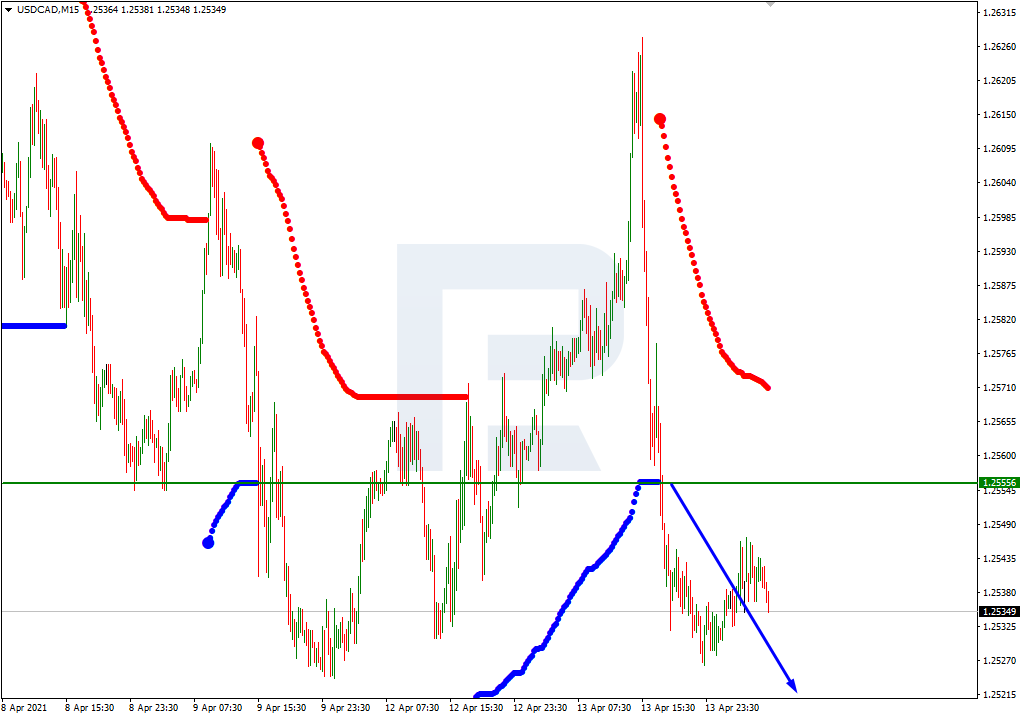
As we can see in the M15 chart, the pair has broken the downside line of the VoltyChannel indicator and, as a result, may continue trading downwards.
Article By RoboForex.com
Attention!
Forecasts presented in this section only reflect the author’s private opinion and should not be considered as guidance for trading. RoboForex LP bears no responsibility for trading results based on trading recommendations described in these analytical reviews.

- The US introduces new import tariffs for 60 countries. Brent crude surpasses $100 per barrel Jul 24, 2026
- USD/JPY Breaks Records: Nothing Slows the Yen’s Decline Jul 24, 2026
- Oil prices reached a 6‑week high. The AUD strengthened on the back of a strong labor‑market report Jul 23, 2026
- EUR/USD Recovers as Dollar Weakens Jul 23, 2026
- Bitcoin rose to $66,000. The New Zealand dollar continues to strengthen Jul 22, 2026
- Inflationary pressure is easing in Canada. In New Zealand, on the contrary, inflation is rising Jul 21, 2026
- GBP/USD Falls After Cabinet Changes Jul 21, 2026
- Geopolitical and macroeconomic conditions continue to pressure market sentiment Jul 20, 2026
- USD/JPY Poised to Continue Gains as Expensive Oil and Lack of Support Weigh on Yen Jul 20, 2026
- COT Metals Charts: Weekly Speculator Bets led by Copper & Steel Jul 18, 2026