
Article By RoboForex.com
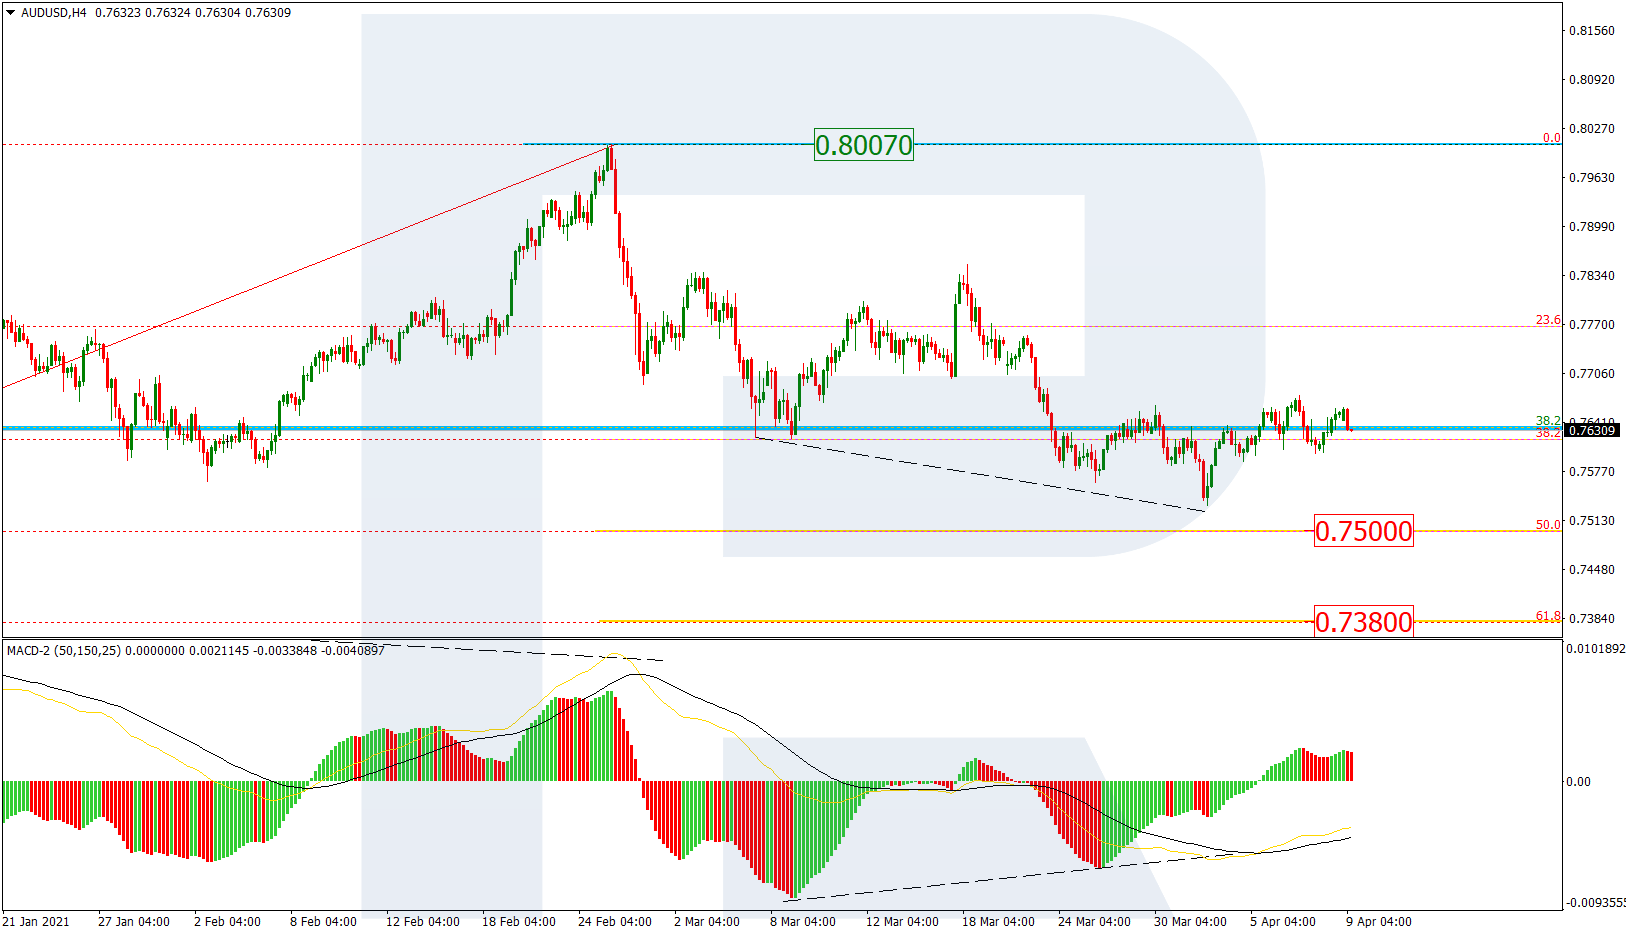
AUDUSD, “Australian Dollar vs US Dollar”
On H4, the wave of correctional growth after the convergence did not demonstrate any impressive move. Further growth is not excluded, but the priority is further development of the downtrend to 50.0% (0.7500) and 61.8% (0.7380) Fibo. The resistance is still at the high of 0.8007.

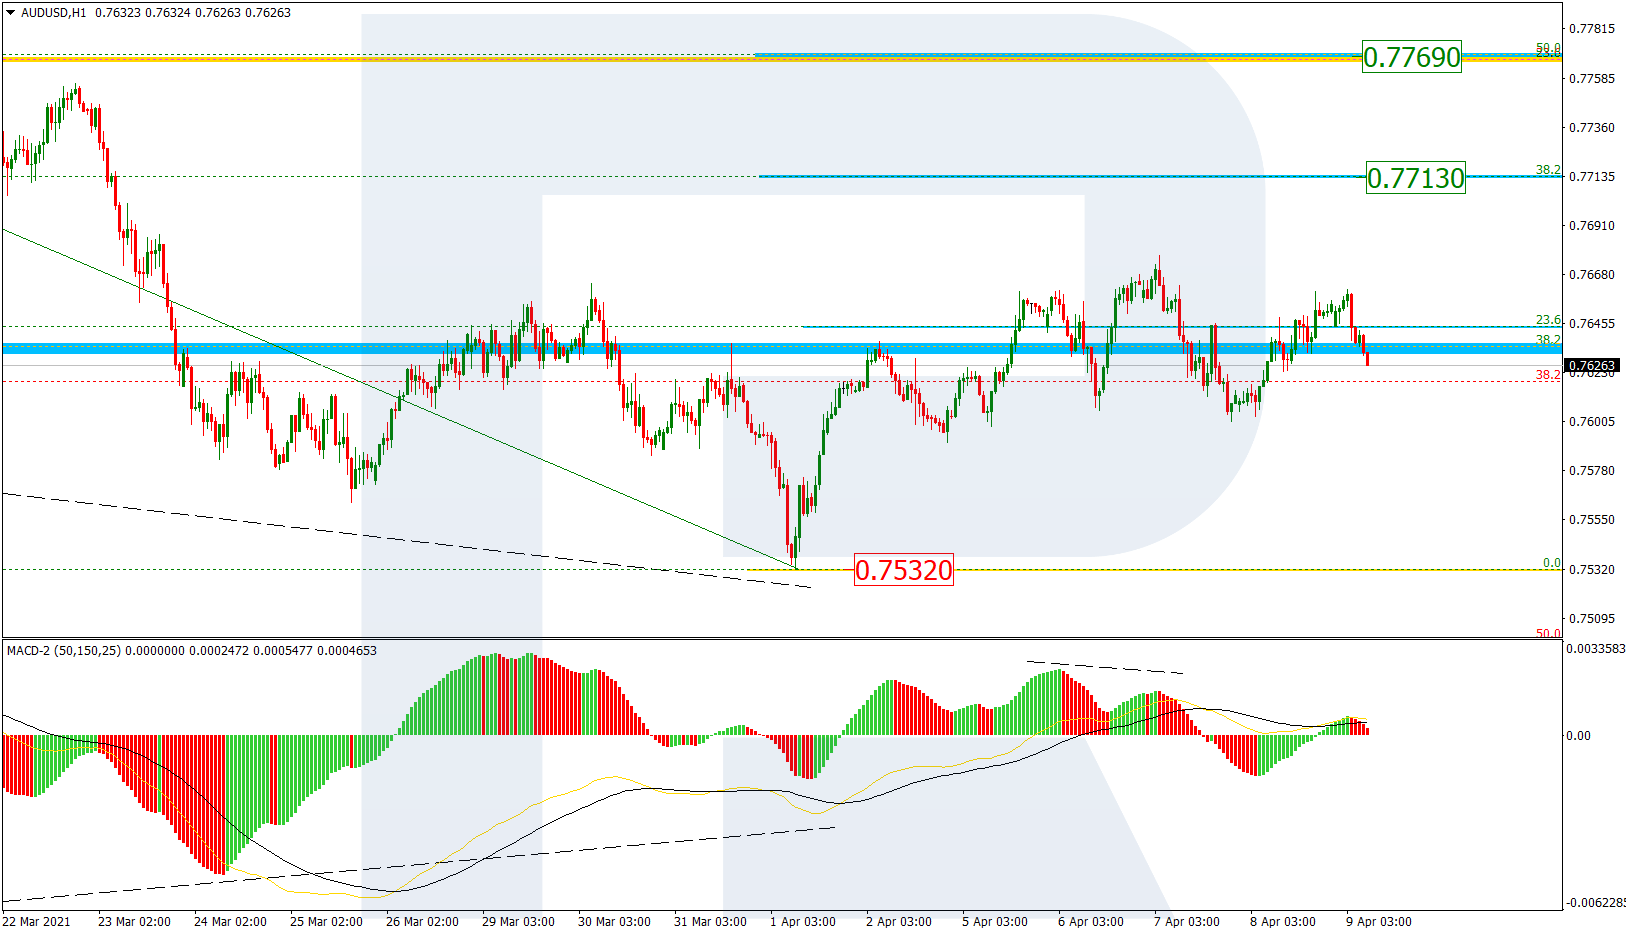
On H1, the correctional growth reached just 23.6% Fibo. After a local divergence, the decline will head for 0.7532, and a breakaway here will signal further development of the medium-term downtrend. However, in case of a bounce, the wave of growth will head for 38.2% (0.7713) and 50.0% (0.7769).
Free Reports:
 Download Our Metatrader 4 Indicators – Put Our Free MetaTrader 4 Custom Indicators on your charts when you join our Weekly Newsletter
 Get our Weekly Commitment of Traders Reports - See where the biggest traders (Hedge Funds and Commercial Hedgers) are positioned in the futures markets on a weekly basis.
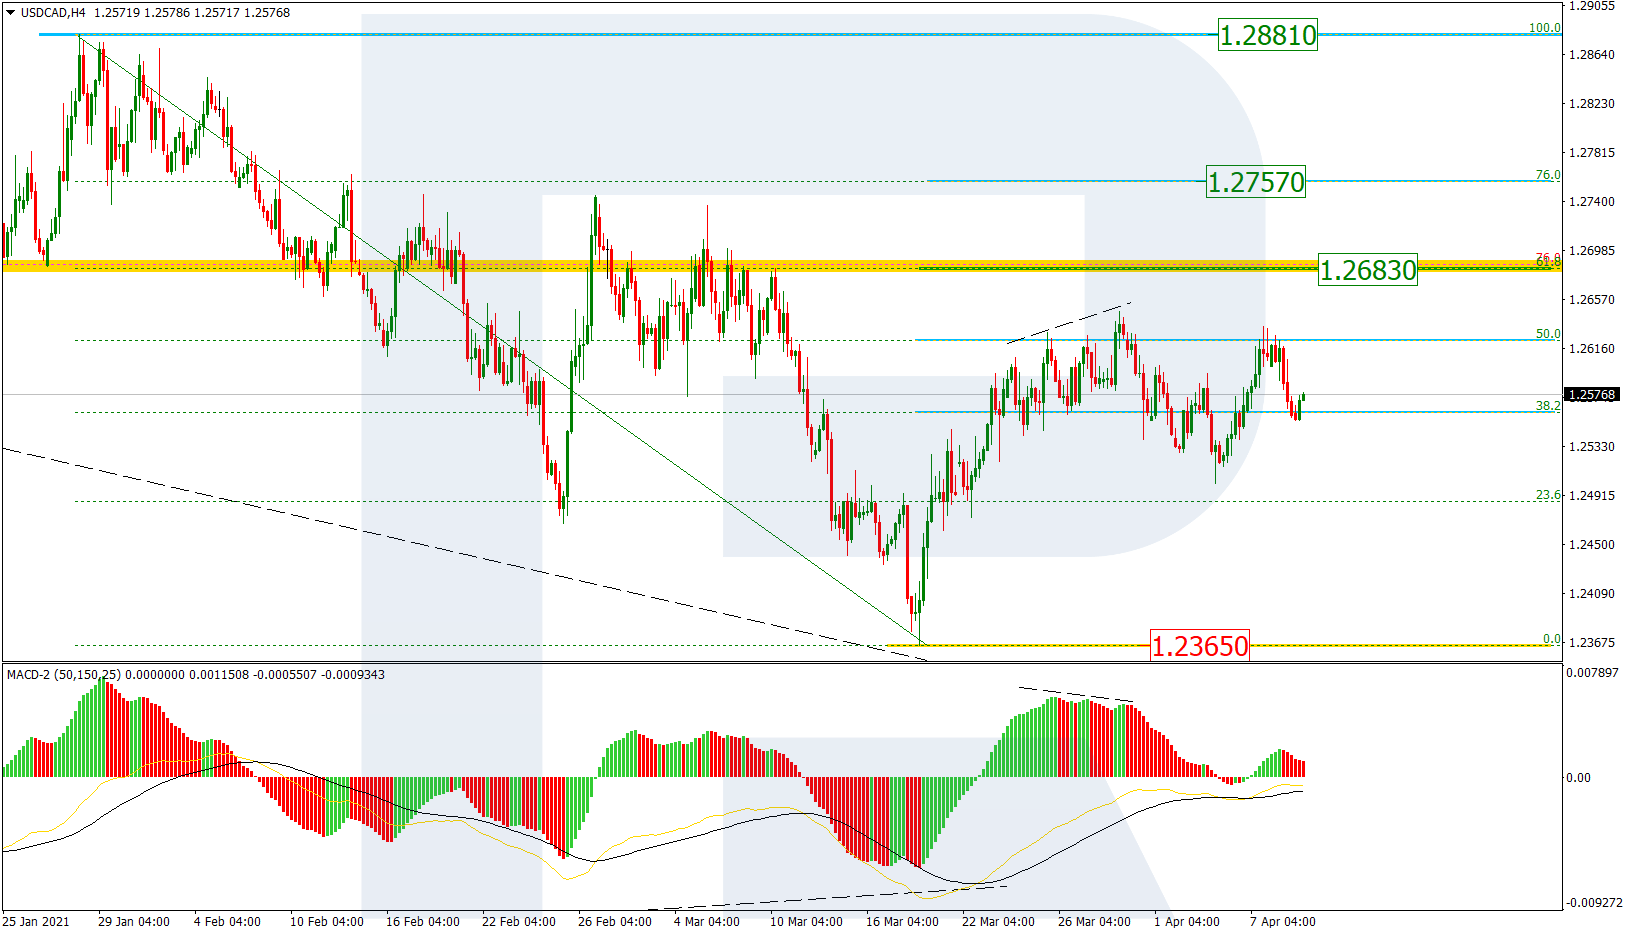
USDCAD, “US Dollar vs Canadian Dollar’
On H4, the market remains in the correctional phase after a wave of growth to 50.0% Fibo. The fact that the declining wave has not dropped to the low and support at 1.2365 might mean that buyers are strong. When the correctional phase is over, growth might continue to 61.8% (1.2683) and 76.0% (1.2757), but the main goal is the local high of 1.2881.
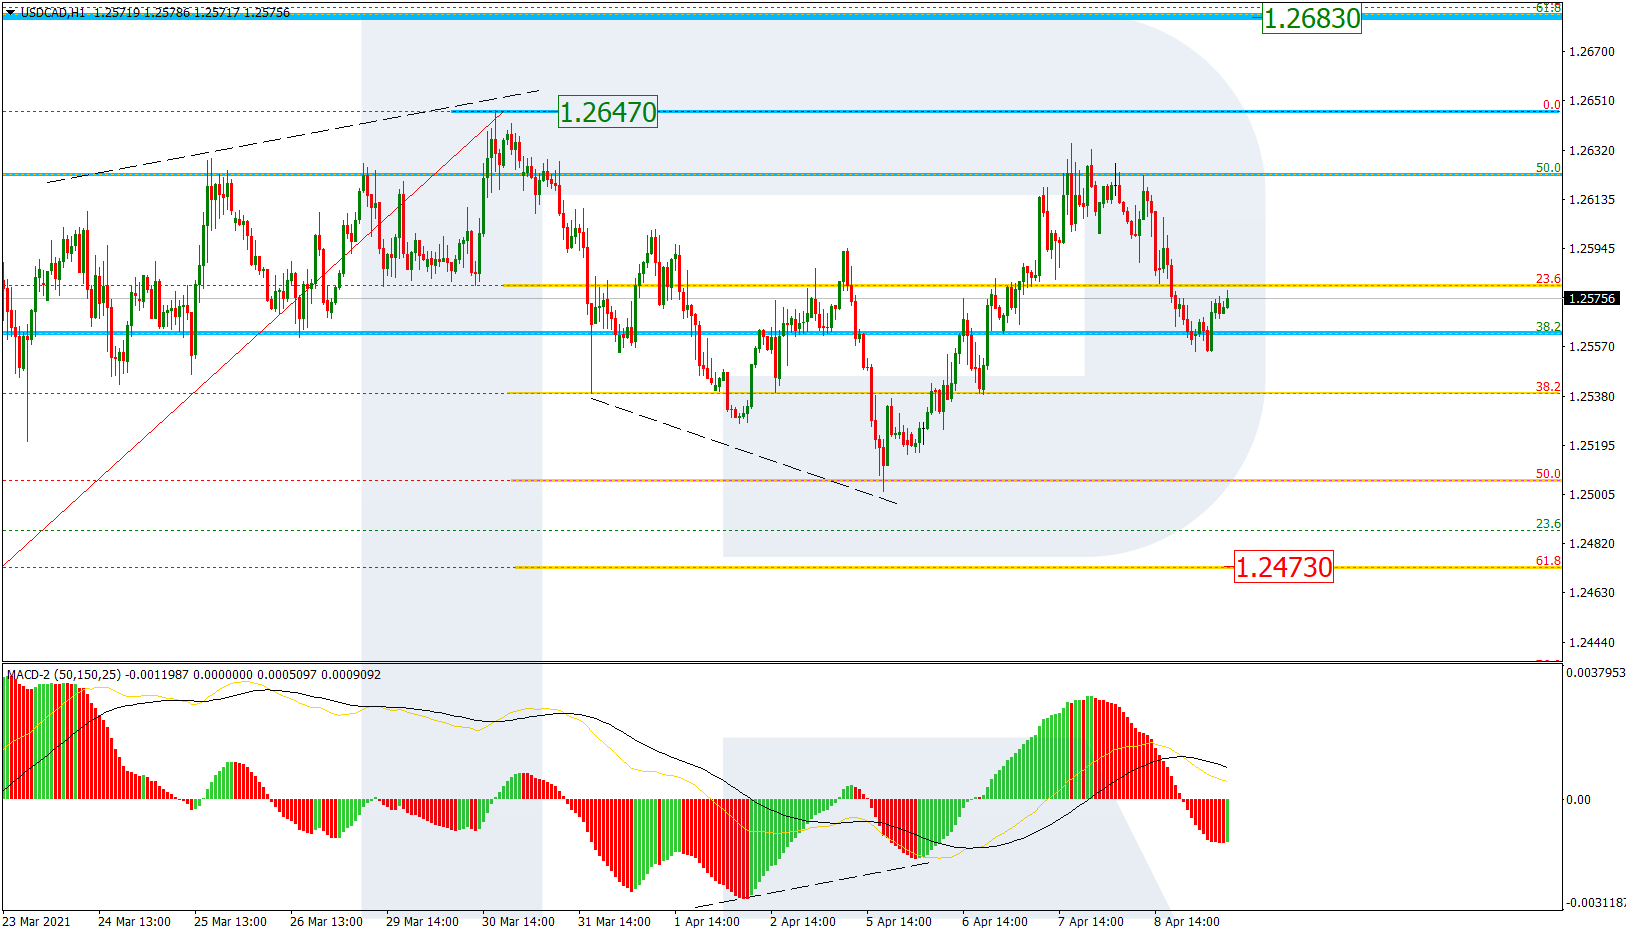
On H1, one can see the inner construction of the correctional phase. The declining wave has reached 50.0% and finished in a convergence. Subsequent growth did not break through 1.2647, which might mean a possible decline to 61.8% (1.2473). However, if the high is broken away, an impulse of rapid growth might form.
Article By RoboForex.com
Attention!
Forecasts presented in this section only reflect the author’s private opinion and should not be considered as guidance for trading. RoboForex LP bears no responsibility for trading results based on trading recommendations described in these analytical reviews.

- The US introduces new import tariffs for 60 countries. Brent crude surpasses $100 per barrel Jul 24, 2026
- USD/JPY Breaks Records: Nothing Slows the Yen’s Decline Jul 24, 2026
- Oil prices reached a 6‑week high. The AUD strengthened on the back of a strong labor‑market report Jul 23, 2026
- EUR/USD Recovers as Dollar Weakens Jul 23, 2026
- Bitcoin rose to $66,000. The New Zealand dollar continues to strengthen Jul 22, 2026
- Inflationary pressure is easing in Canada. In New Zealand, on the contrary, inflation is rising Jul 21, 2026
- GBP/USD Falls After Cabinet Changes Jul 21, 2026
- Geopolitical and macroeconomic conditions continue to pressure market sentiment Jul 20, 2026
- USD/JPY Poised to Continue Gains as Expensive Oil and Lack of Support Weigh on Yen Jul 20, 2026
- COT Metals Charts: Weekly Speculator Bets led by Copper & Steel Jul 18, 2026