
Article By RoboForex.com
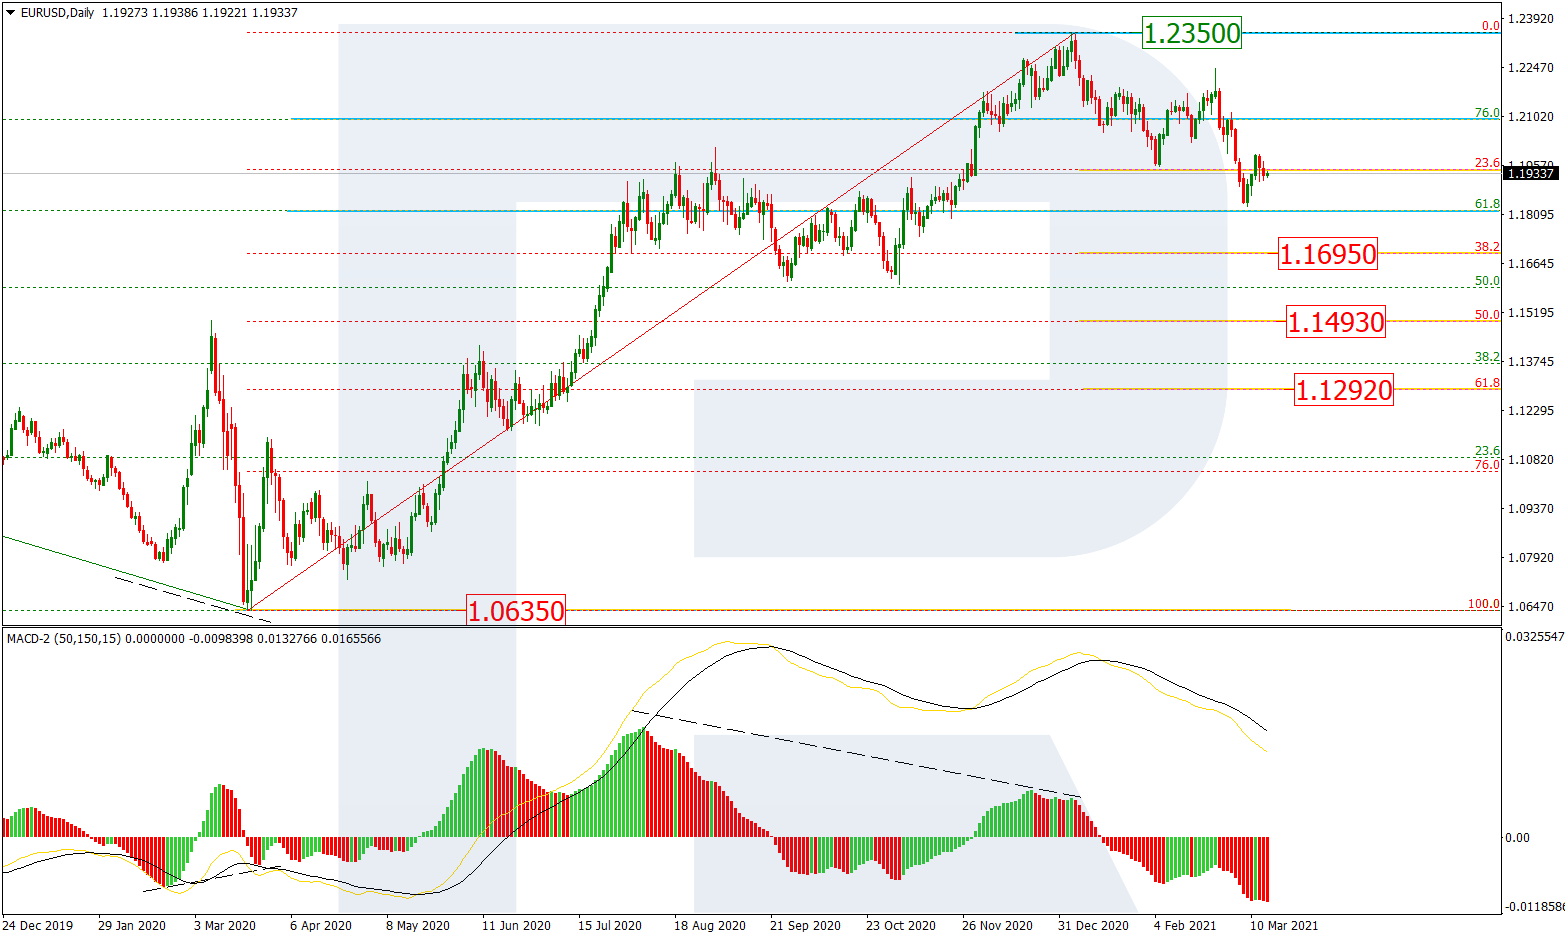
EURUSD, “Euro vs US Dollar”
As we can see in the daily chart, the asset continues the “bearish” phase after a divergence on MACD. After falling and reaching 23.6% fibo, the pair has started a new pullback, which may be over quite soon. In this case, EURUSD may resume falling towards 38.2%, 50.0%, and 61.8% fibo at 1.1695, 1.1493, and 1.1292 respectively. The key resistance remains at the high at 1.2350.

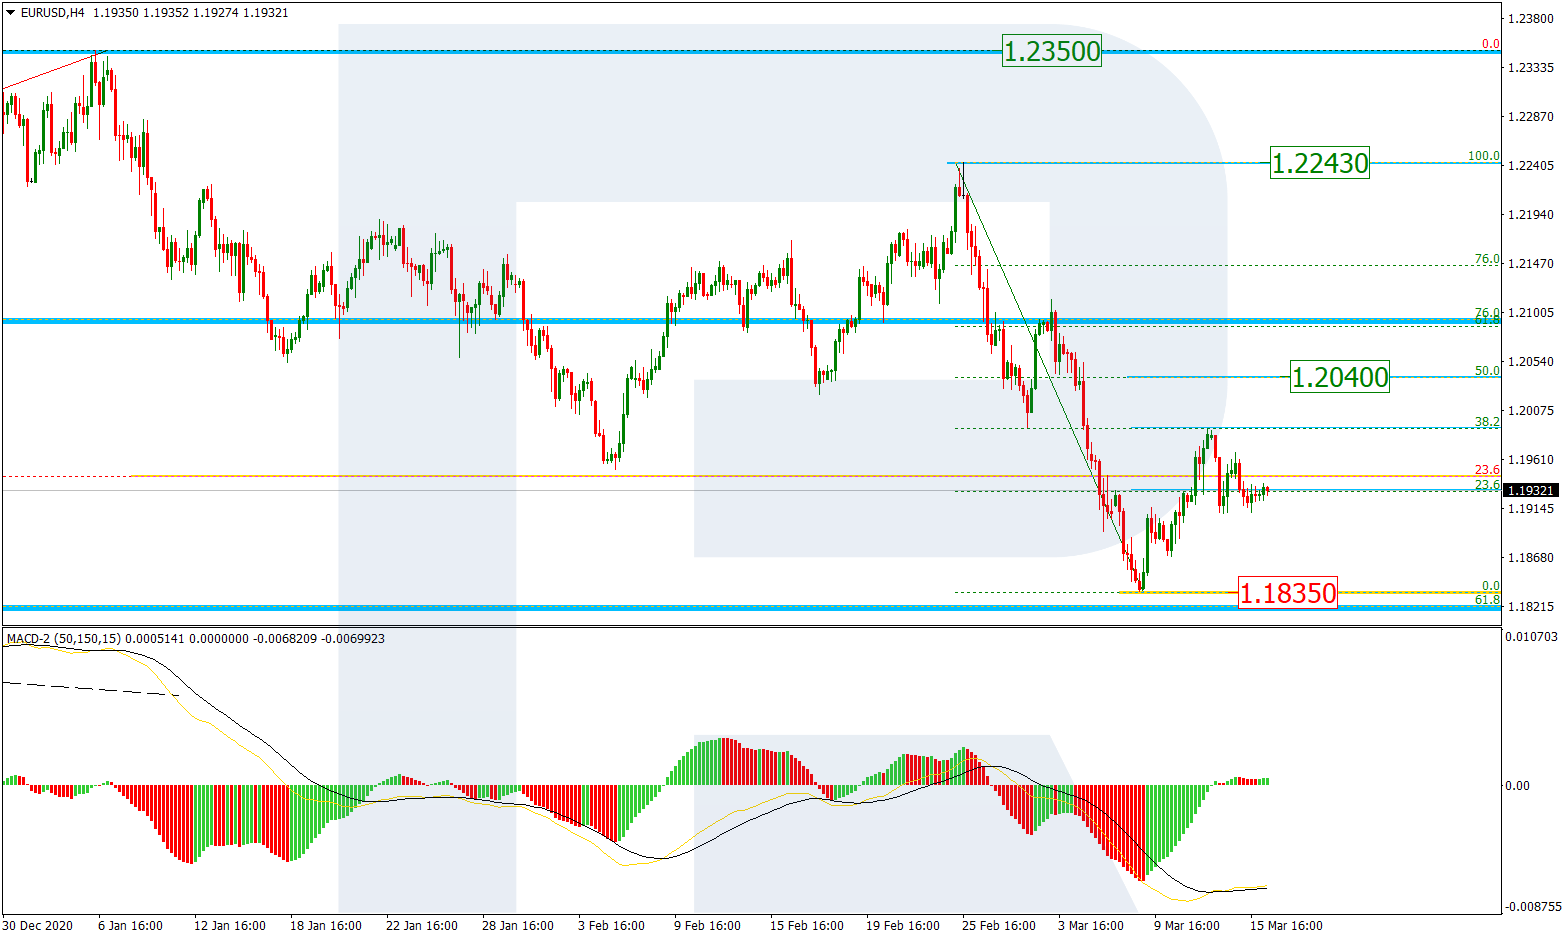
The H4 chart shows a more detailed structure of the current short-term correction after the previous descending impulse, which has already reached 38.2% fibo and may yet continue towards 50.0% fibo at 1.2040. After finishing the correction, the asset may resume falling to reach and break the low at 1.1835. The mid-term resistance is the fractal high at 1.2243.
Free Reports:
 Get our Weekly Commitment of Traders Reports - See where the biggest traders (Hedge Funds and Commercial Hedgers) are positioned in the futures markets on a weekly basis.
 Download Our Metatrader 4 Indicators – Put Our Free MetaTrader 4 Custom Indicators on your charts when you join our Weekly Newsletter
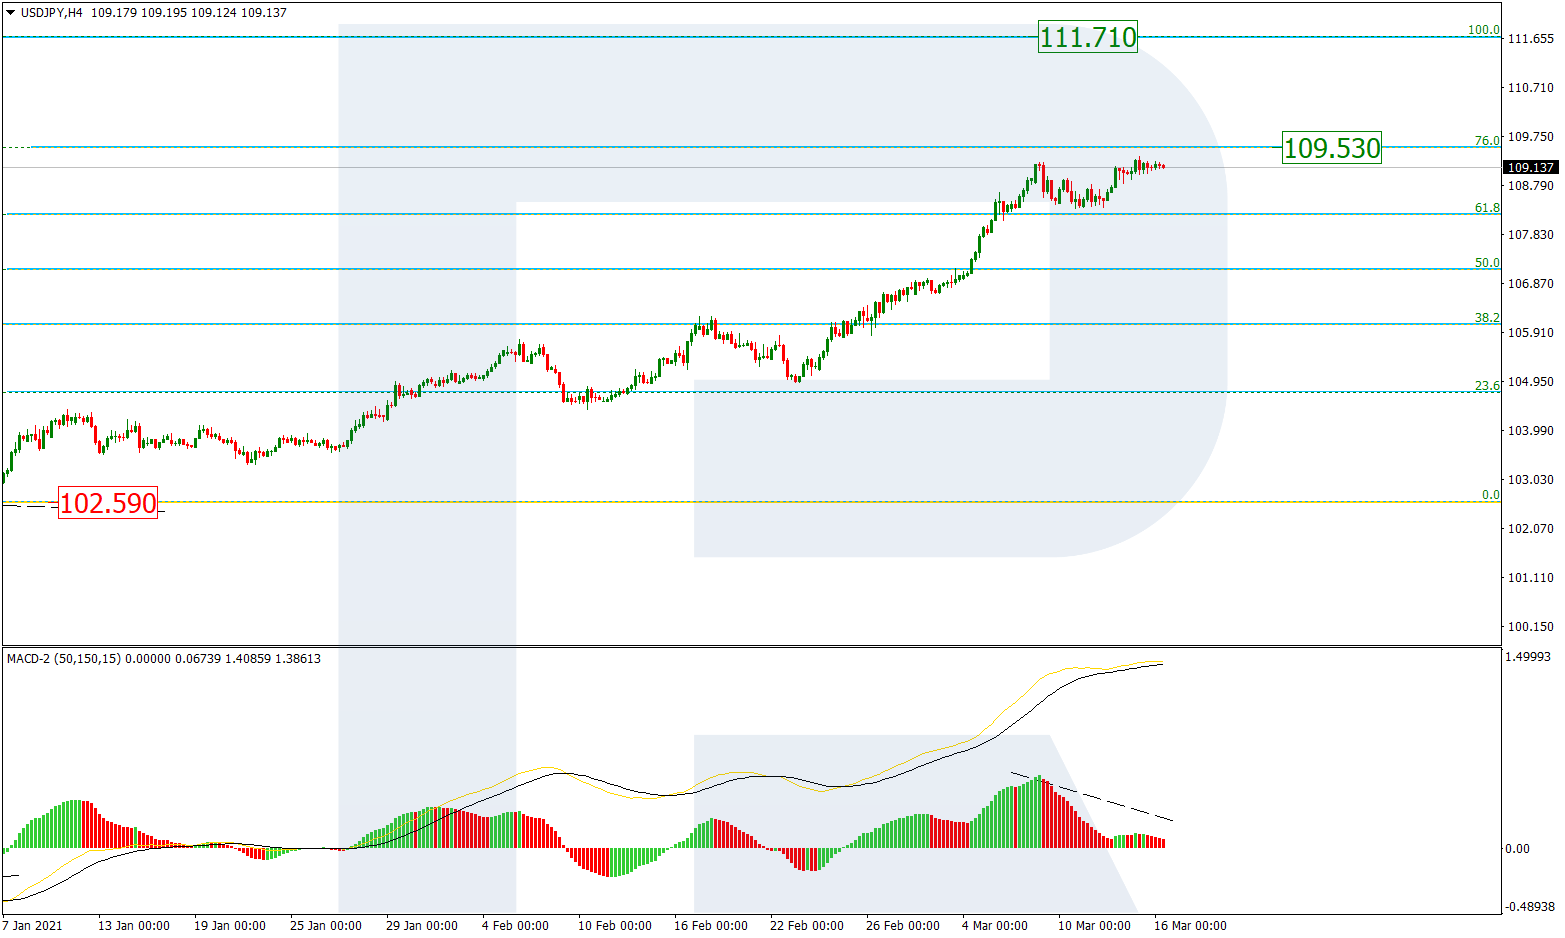
USDJPY, “US Dollar vs. Japanese Yen”
As we can see in the H4 chart, the stable uptrend continues. After breaking 61.8% fibo, USDJPY is heading towards 76.0% fibo at 109.53. After breaking the latter level, the pair may continue growing to reach the long-term fractal high at 111.71. However, there is a divergence on MACD, which says that the pair may correct downwards before attacking the high.
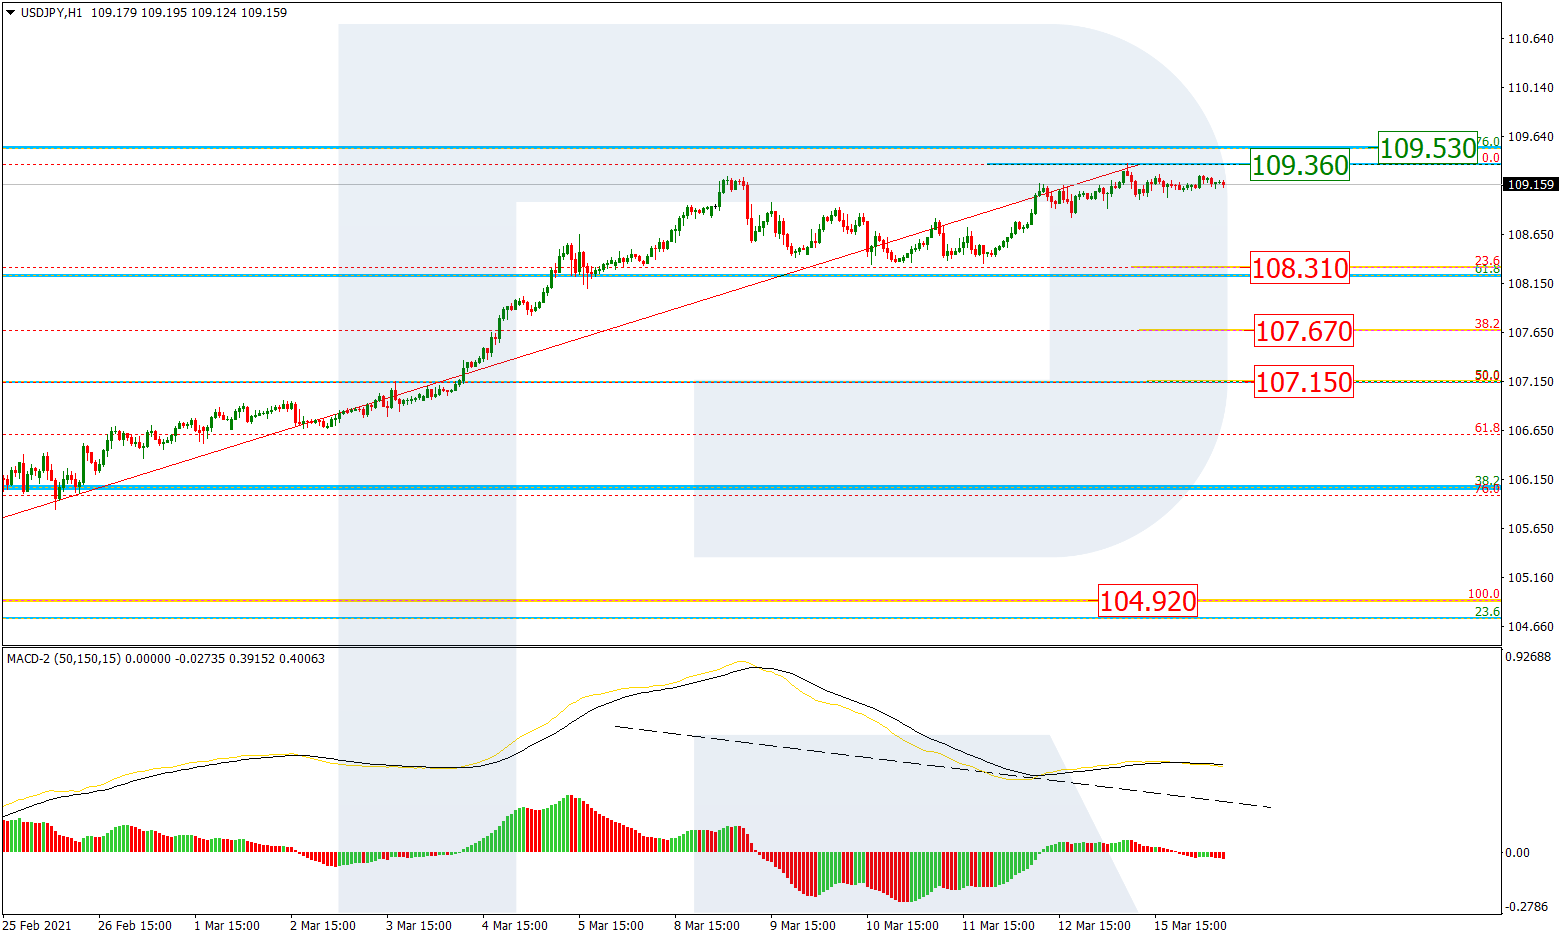
In the H1 chart, USDJPY is correcting to the downside and may reach 23.6, 38.2%, and 50.0% fibo at 108.31, 107.67, and 107.15 respectively. A breakout of the current high at 109.36 may complete the correction.
Article By RoboForex.com
Attention!
Forecasts presented in this section only reflect the author’s private opinion and should not be considered as guidance for trading. RoboForex LP bears no responsibility for trading results based on trading recommendations described in these analytical reviews.

- This week will be one of the most crowded for central‑bank meetings Jul 27, 2026
- EUR/USD Ahead of a Key Week: Holding Near Lows Jul 27, 2026
- COT Metals Charts: Weekly Speculator Changes led by Copper Jul 26, 2026
- COT Bonds Charts: Speculator Bets led by SOFR 3-Months & 5-Year Bonds Jul 26, 2026
- COT Energy Charts: Weekly Speculator Bets led by WTI Crude & Natural Gas Jul 26, 2026
- COT Soft Commodities Charts: Weekly Speculator Bets led by Corn & Soybeans Jul 26, 2026
- The US introduces new import tariffs for 60 countries. Brent crude surpasses $100 per barrel Jul 24, 2026
- USD/JPY Breaks Records: Nothing Slows the Yen’s Decline Jul 24, 2026
- Oil prices reached a 6‑week high. The AUD strengthened on the back of a strong labor‑market report Jul 23, 2026
- EUR/USD Recovers as Dollar Weakens Jul 23, 2026