
Article By RoboForex.com
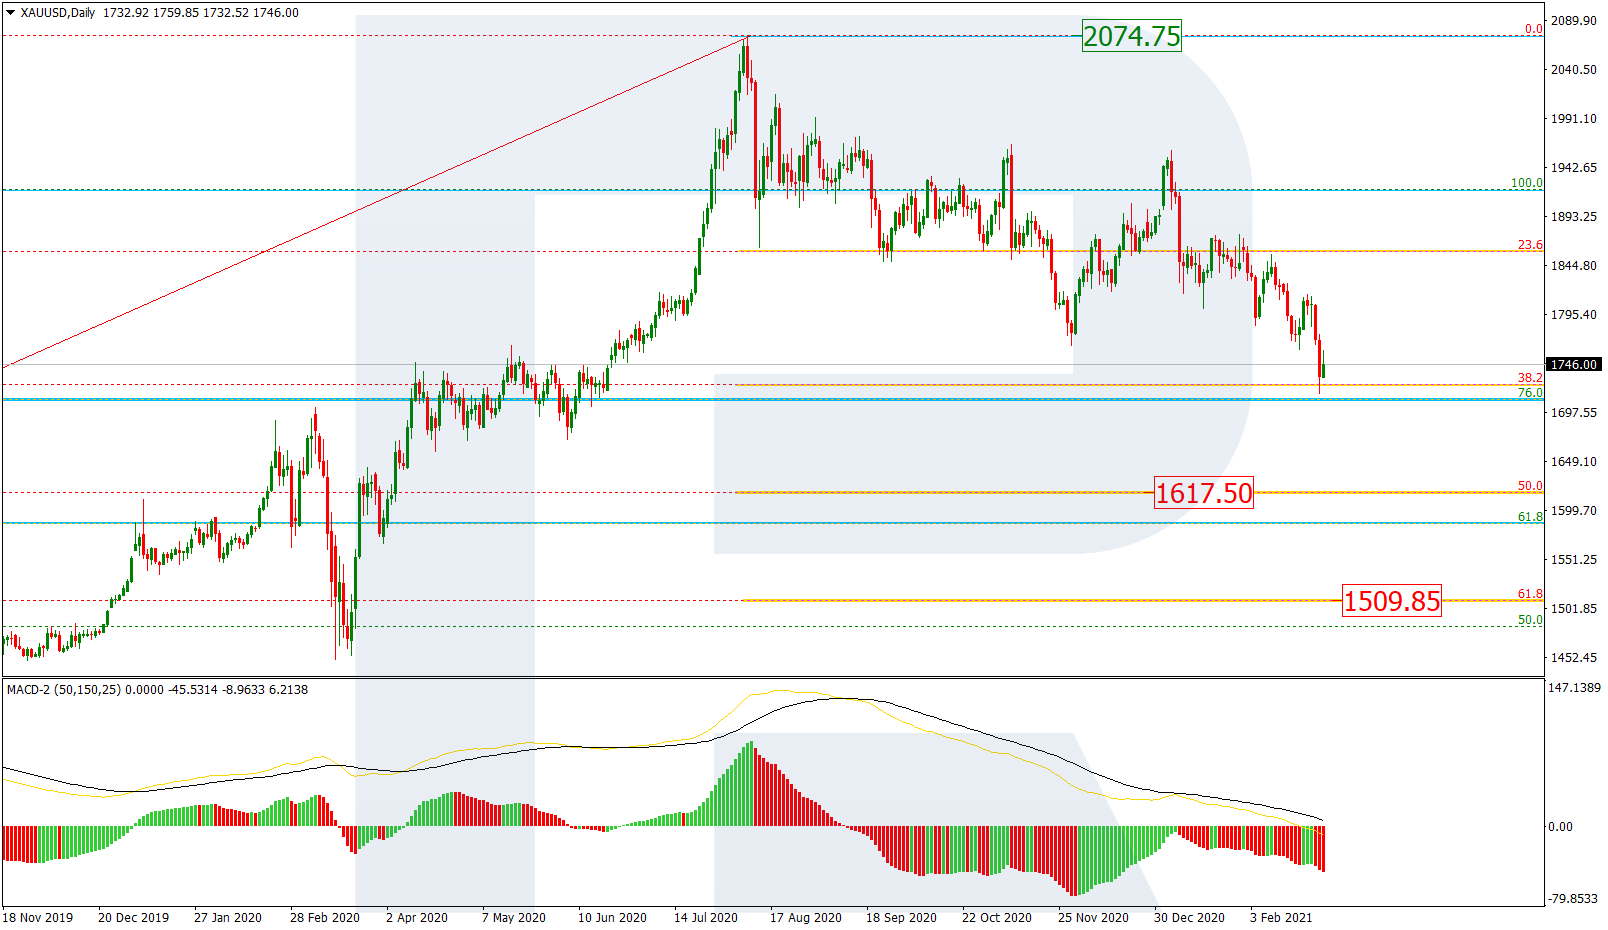
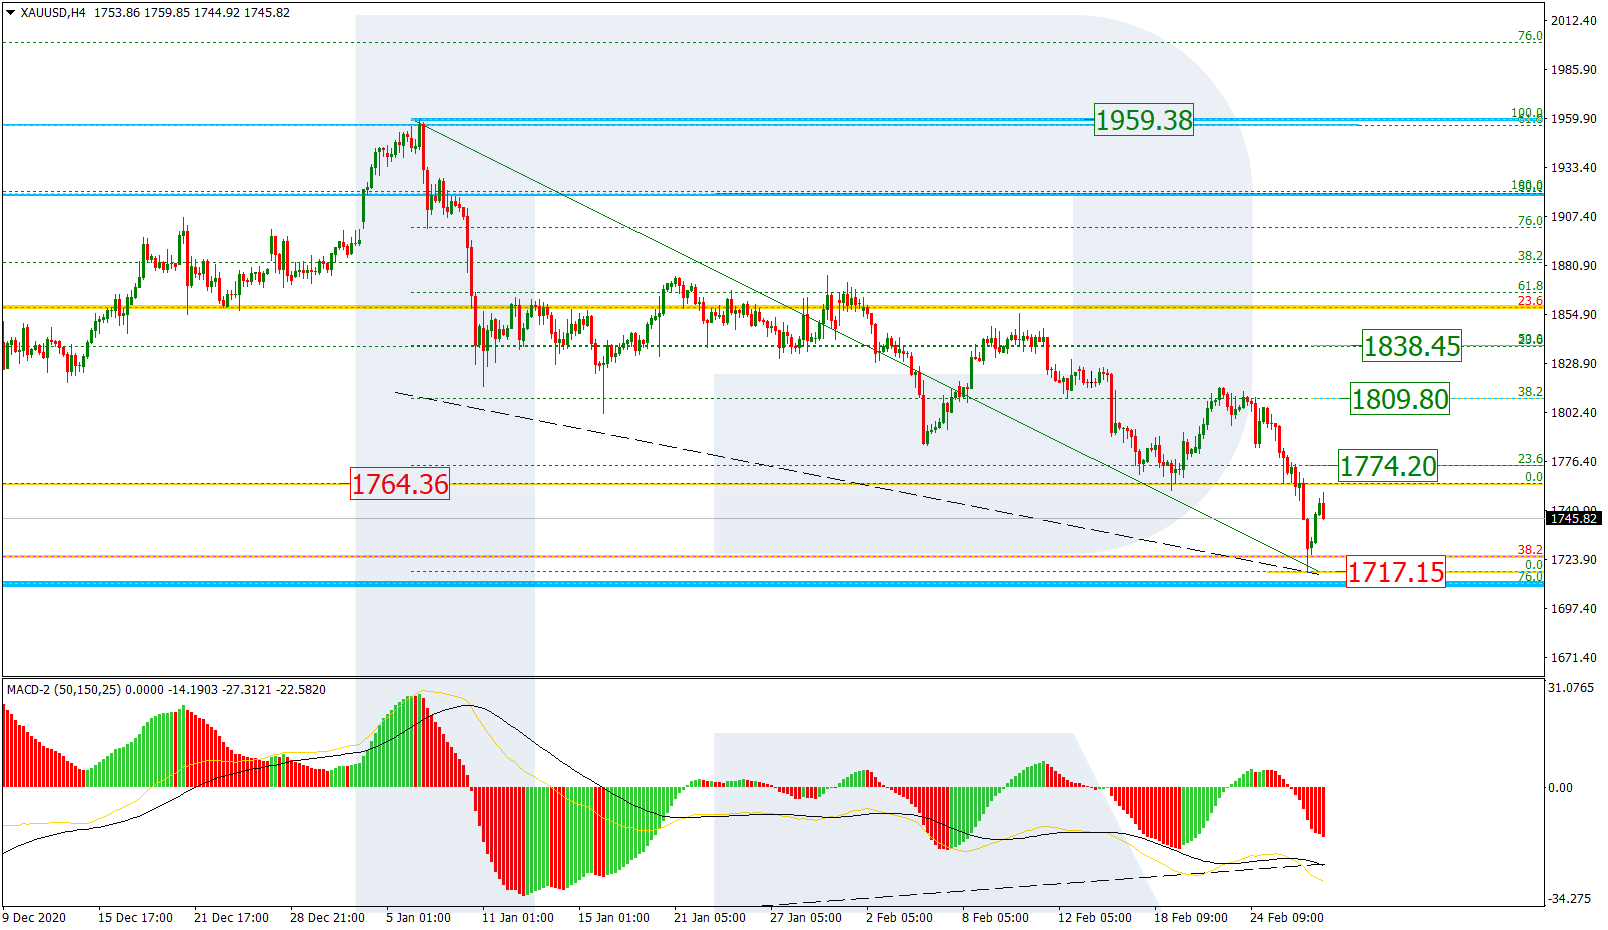
XAUUSD, “Gold vs US Dollar”
In the daily chart, the long-term correction continues; the previous descending impulse has reached 38.2% fibo. After a slight pullback, the price may continue falling towards 50.0% and 61.8% fibo at 1617.50 and 1509.85 respectively. However, there is a convergence on MACD, which may hint at a possible reversal and a new ascending wave after the instrument reaches one of its key downside targets. The key resistance is the high at 2074.75.

In the H4 chart, a local convergence made the pair start a new pullback after reaching the long-term 38.2% fibo. The possible correctional targets are 23.6%, 38.2%, and 50.0% fibo at 1774.20, 1809.80, and 1838.45 respectively. However, if the price breaks the local low at 1717.15, XAUUSD may continue falling to reach the long-term 50.0% fibo at 1617.50.
Free Reports:
 Get our Weekly Commitment of Traders Reports - See where the biggest traders (Hedge Funds and Commercial Hedgers) are positioned in the futures markets on a weekly basis.
 Download Our Metatrader 4 Indicators – Put Our Free MetaTrader 4 Custom Indicators on your charts when you join our Weekly Newsletter
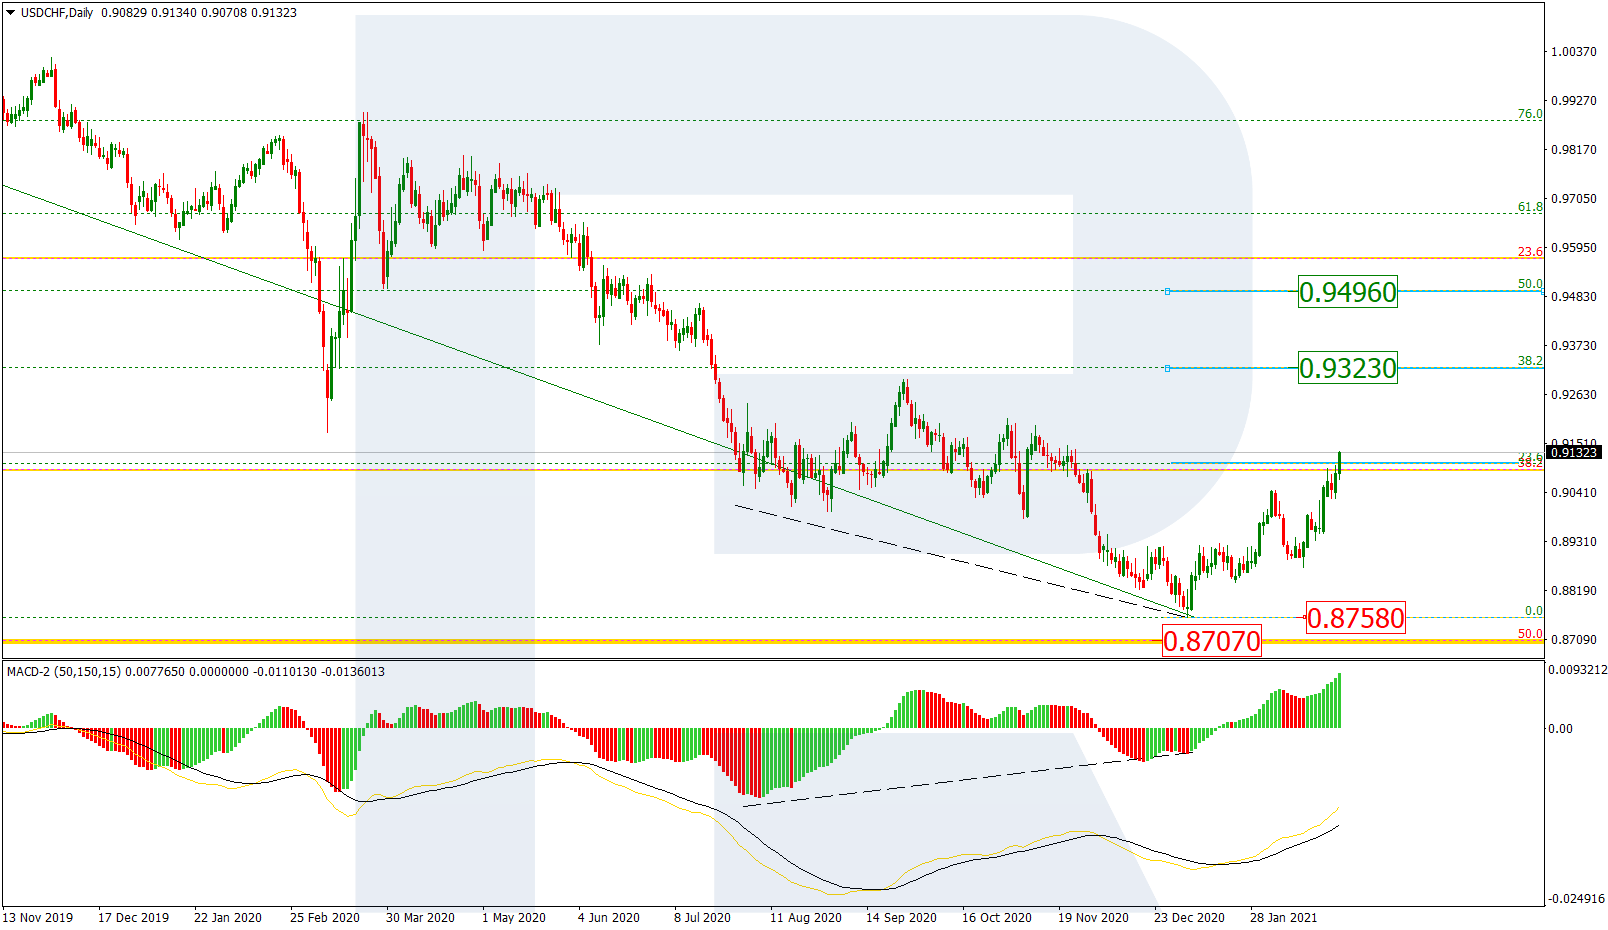
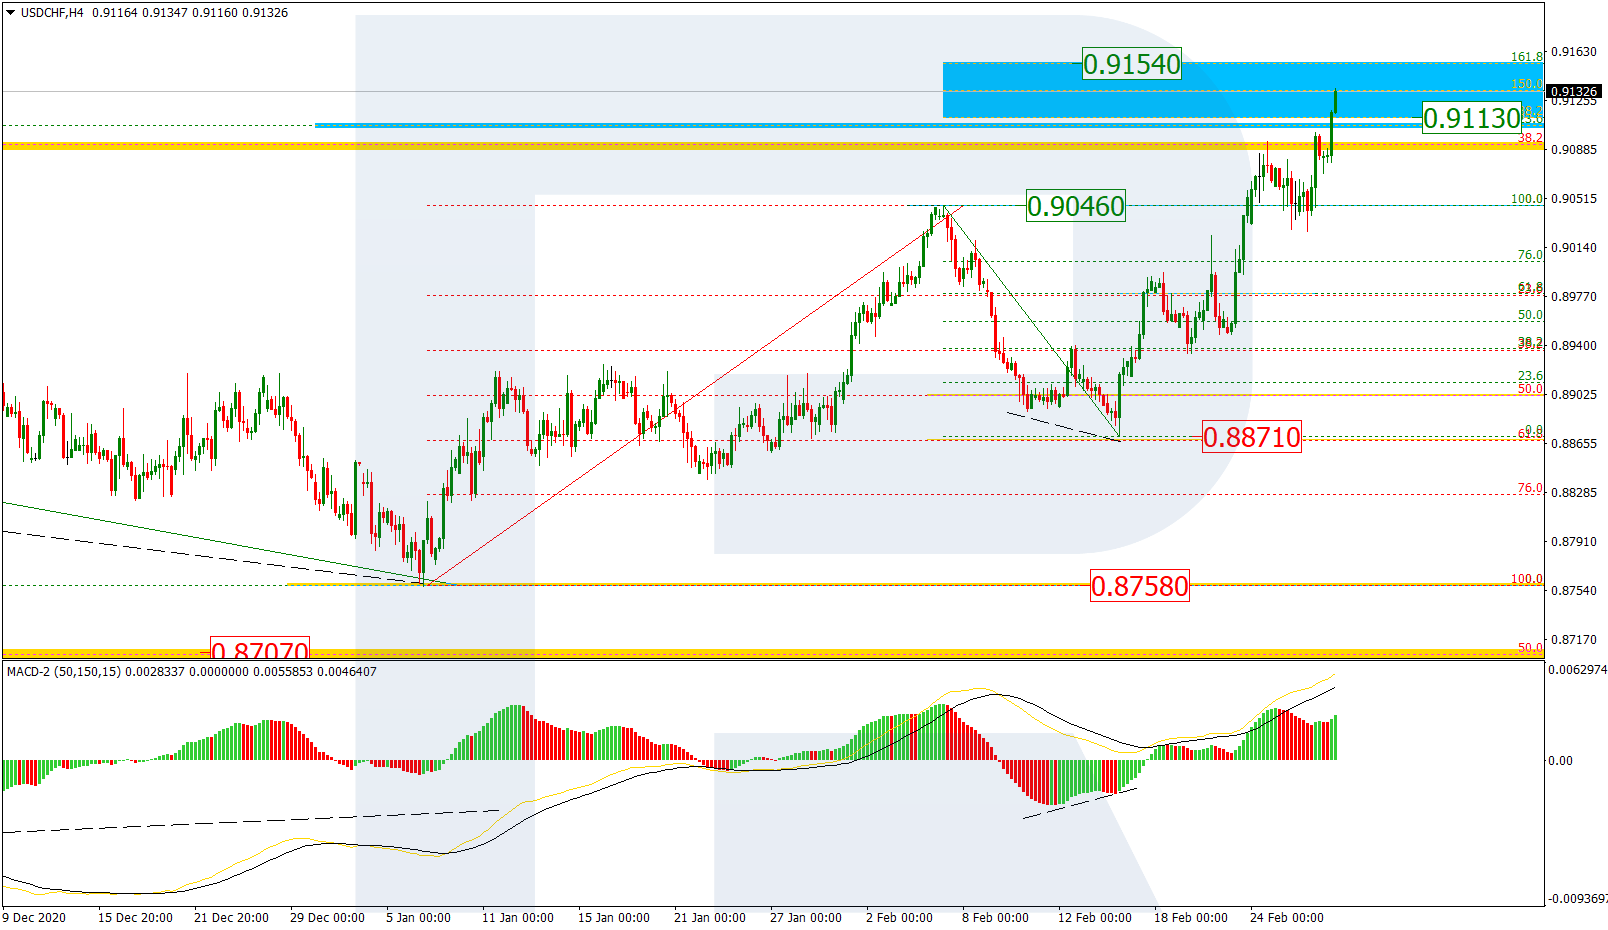
USDCHF, “US Dollar vs Swiss Franc”
The daily chart shows that a convergence made start a new rising wave, which has already broken 23.6% fibo and may later continue growing to reach 38.2% fibo at 0.9323. The key upside target is 50.0% fibo at 0.9496. However, if the asset breaks the support at 0.8758, the correction may be over.
As we can see in the H4 chart, after correcting by almost 50.0%, USDCHF has broken the high 0.9046 to enter the post-correctional extension area between 138.2% and 161.8% fibo at 0.9113 and 0.9154 respectively. the support is the local low at 0.8871.
Article By RoboForex.com
Attention!
Forecasts presented in this section only reflect the author’s private opinion and should not be considered as guidance for trading. RoboForex LP bears no responsibility for trading results based on trading recommendations described in these analytical reviews.

- This week will be one of the most crowded for central‑bank meetings Jul 27, 2026
- EUR/USD Ahead of a Key Week: Holding Near Lows Jul 27, 2026
- COT Metals Charts: Weekly Speculator Changes led by Copper Jul 26, 2026
- COT Bonds Charts: Speculator Bets led by SOFR 3-Months & 5-Year Bonds Jul 26, 2026
- COT Energy Charts: Weekly Speculator Bets led by WTI Crude & Natural Gas Jul 26, 2026
- COT Soft Commodities Charts: Weekly Speculator Bets led by Corn & Soybeans Jul 26, 2026
- The US introduces new import tariffs for 60 countries. Brent crude surpasses $100 per barrel Jul 24, 2026
- USD/JPY Breaks Records: Nothing Slows the Yen’s Decline Jul 24, 2026
- Oil prices reached a 6‑week high. The AUD strengthened on the back of a strong labor‑market report Jul 23, 2026
- EUR/USD Recovers as Dollar Weakens Jul 23, 2026