
Author: Dmitriy Gurkovskiy, Chief Analyst at RoboForex
On Monday, March 15th, EUR/USD is looking rather confusing: it seems like there are no compelling reasons for the USD to get stronger but the Euro remains under pressure. The pair is mostly trading at 1.1931.
The fact that the $1.9 trillion stimulus package to help the American economy was completely approved made investors quite happy – no one expected the plan to fail but the final approval was still extremely positive. The money flow intended to support businesses and the social sphere will boost the country’s economic recovery and in the long-term, it’s very good for the “greenback”.
At the same time, social restrictions that remain in effect in European countries put pressure on the European currency. It’s not quite clear yet when such countries as Germany and France will cancel their lockdowns.
This week, there will be few statistical reports from Europe, so financial markets will have to rest upon the good stimulus-relating news from the USA.
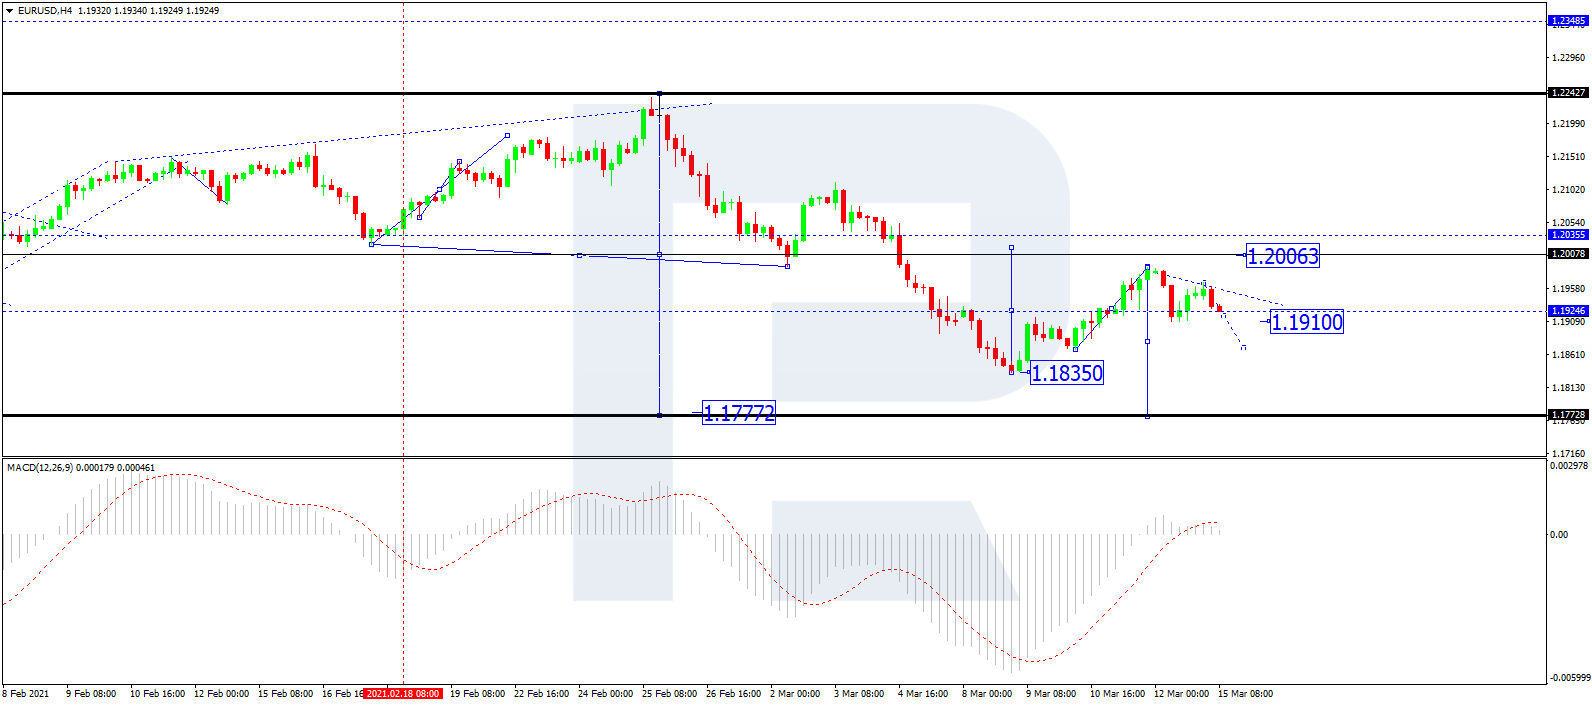
In the H4 chart, after reaching the downside target at 1.1835, EUR/USD is forming another rising wave with the target at 1.2020; it has already completed the correctional structure towards 1.1930 and may later continue growing to reach the above-mentioned target. However, if the price continues falling to break 1.1900 and forms a downside continuation pattern, the pair may form one more descending structure towards 1.1777 and then resume trading upwards to reach 1.2000. From the technical point of view, this scenario is confirmed by MACD Oscillator: its signal line has broken 0 to the upside, thus implying a further ascending movement on the price chart. The asset may start another decline on the price chart only if the signal line steadily breaks 0 to the downside.
Free Reports:
 Sign Up for Our Stock Market Newsletter – Get updated on News, Charts & Rankings of Public Companies when you join our Stocks Newsletter
 Get our Weekly Commitment of Traders Reports - See where the biggest traders (Hedge Funds and Commercial Hedgers) are positioned in the futures markets on a weekly basis.
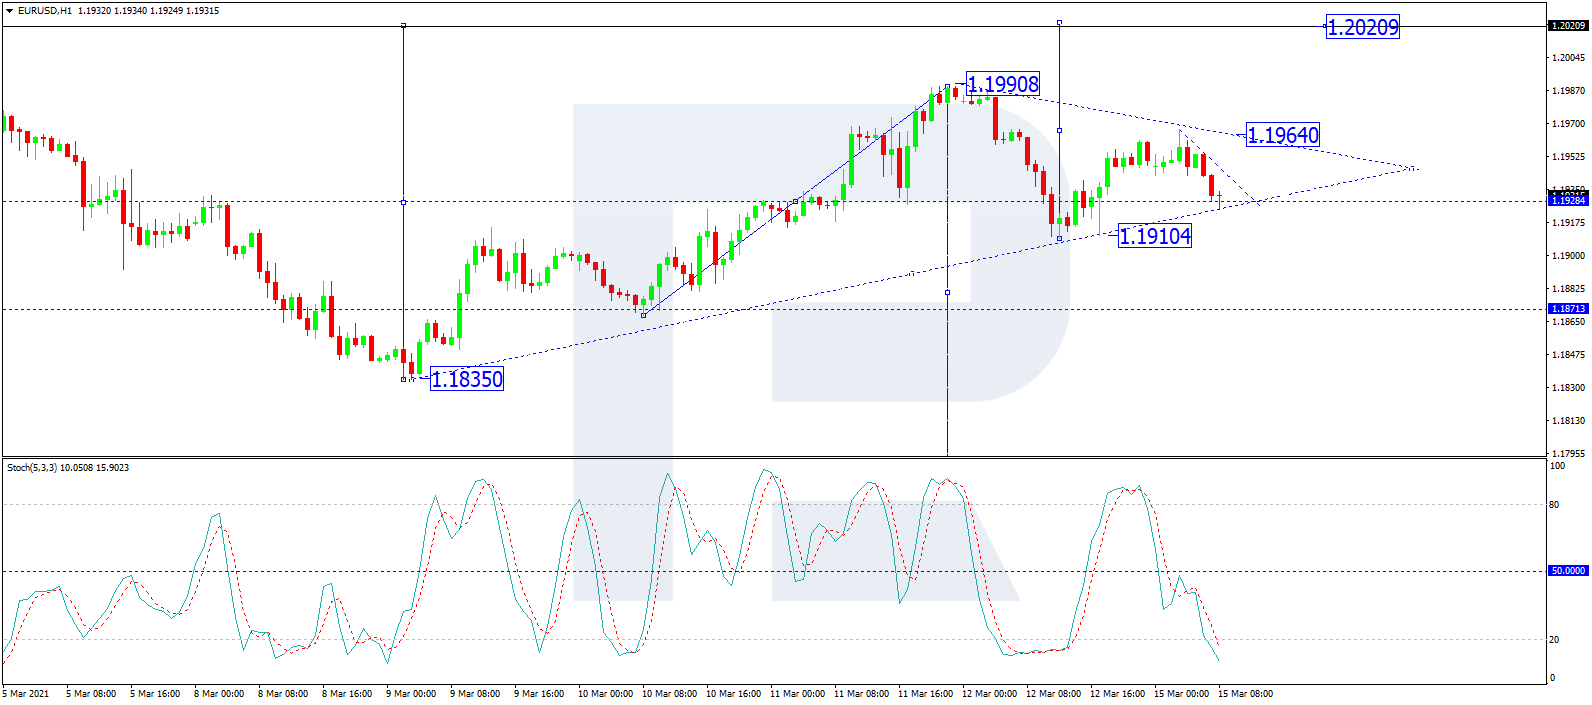
As we can see in the H1 chart, after completing the correction at 1.1910 along with the ascending impulse to reach 1.1964, EUR/USD has finished another correction towards 1.1930. the key scenario implies a new rising wave towards 1.1960, a breakout of which may result in a further uptrend with the target at 1.2020. From the technical point of view, this scenario is confirmed by the Stochastic Oscillator: its signal line is moving below 20, thus implying that the market is trading within the “oversold area” and may start a new structure to the upside on the price chart. The indicator line is expected to grow and break 50, thus confirming a boost in the uptrend on the price chart.
Disclaimer
Any forecasts contained herein are based on the author’s particular opinion. This analysis may not be treated as trading advice. RoboForex bears no responsibility for trading results based on trading recommendations and reviews contained herein.

- This week will be one of the most crowded for central‑bank meetings Jul 27, 2026
- EUR/USD Ahead of a Key Week: Holding Near Lows Jul 27, 2026
- COT Metals Charts: Weekly Speculator Changes led by Copper Jul 26, 2026
- COT Bonds Charts: Speculator Bets led by SOFR 3-Months & 5-Year Bonds Jul 26, 2026
- COT Energy Charts: Weekly Speculator Bets led by WTI Crude & Natural Gas Jul 26, 2026
- COT Soft Commodities Charts: Weekly Speculator Bets led by Corn & Soybeans Jul 26, 2026
- The US introduces new import tariffs for 60 countries. Brent crude surpasses $100 per barrel Jul 24, 2026
- USD/JPY Breaks Records: Nothing Slows the Yen’s Decline Jul 24, 2026
- Oil prices reached a 6‑week high. The AUD strengthened on the back of a strong labor‑market report Jul 23, 2026
- EUR/USD Recovers as Dollar Weakens Jul 23, 2026