
Author: Dmitriy Gurkovskiy, Chief Analyst at RoboForex
On Monday, February 1st, the golds price is rising as the troy ounce is trading at $1,863 USD. At the same time, the asset is moving within a wide sideways channel and there must be a very serious catalyst to break its upside border.
The current positive situation in gold is directly connected to a local correction in the USD. Even considering a new stimulus package in the USA, the “greenback” remains pretty strong, that’s why the demand for gold remains rather limited.
However, the situation may change quickly if market players require “safe haven” assets. It may happen due to the repricing of risks and investors’ needs in “safe haven” assets with Gold being one of them. In this case, the channel’s borders may be broken, thus making the trend in the instrument more stable.
So far, market players are quite positive about the future despite several problems. That’s what’s keeping Gold under pressure.
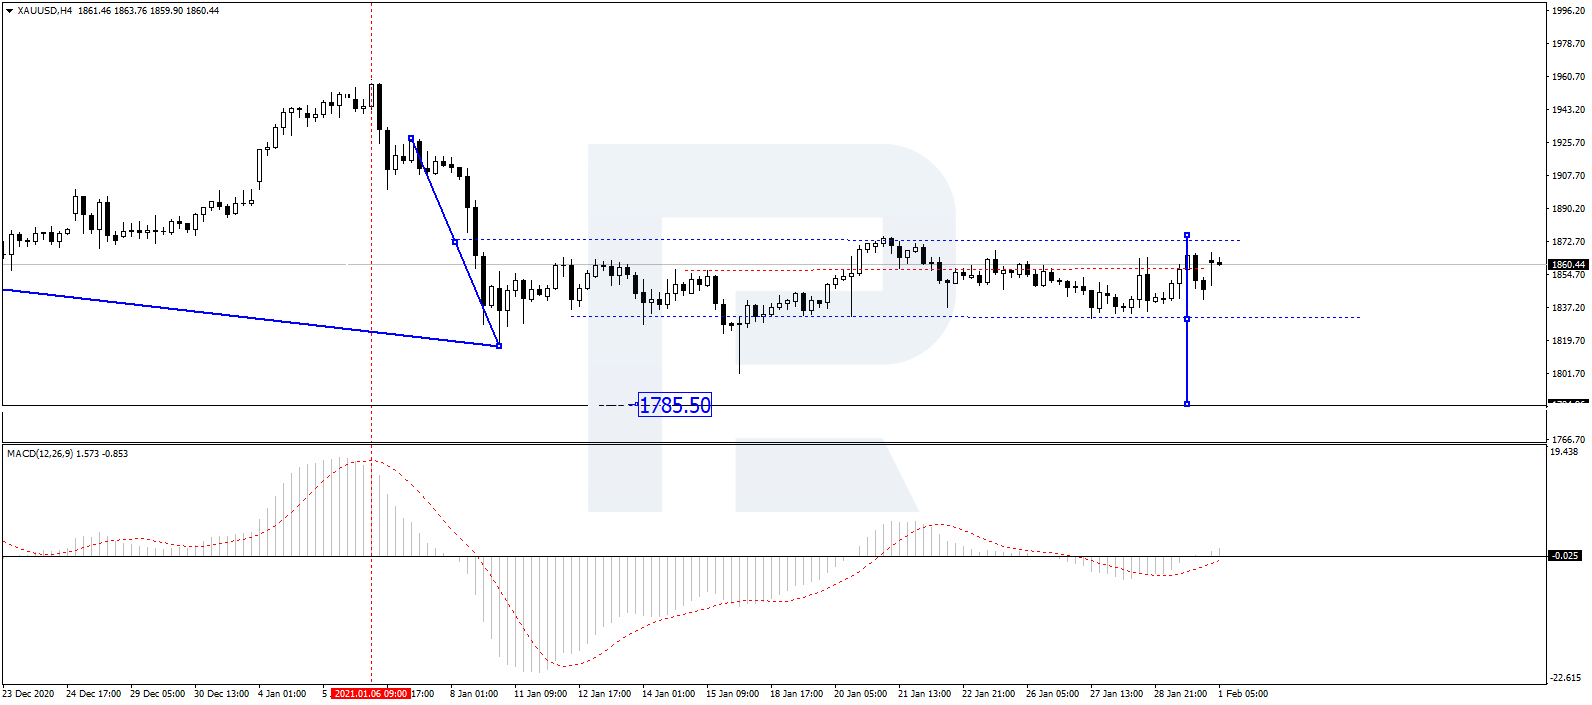
As we can see in the H4 chart, XAU/USD is consolidating below 1874.00. Possibly, the metal may fall towards the downside border at 1833.00. If later the price breaks the range to the upside, the market may resume growing towards 1900.00; if to the downside – form a new descending structure with the target at 1785.50. From the technical point of view, this scenario is confirmed by MACD Oscillator: its signal line is moving below 0, thus implying a further descending movement on the price chart.
Free Reports:
 Download Our Metatrader 4 Indicators – Put Our Free MetaTrader 4 Custom Indicators on your charts when you join our Weekly Newsletter
 Get our Weekly Commitment of Traders Reports - See where the biggest traders (Hedge Funds and Commercial Hedgers) are positioned in the futures markets on a weekly basis.
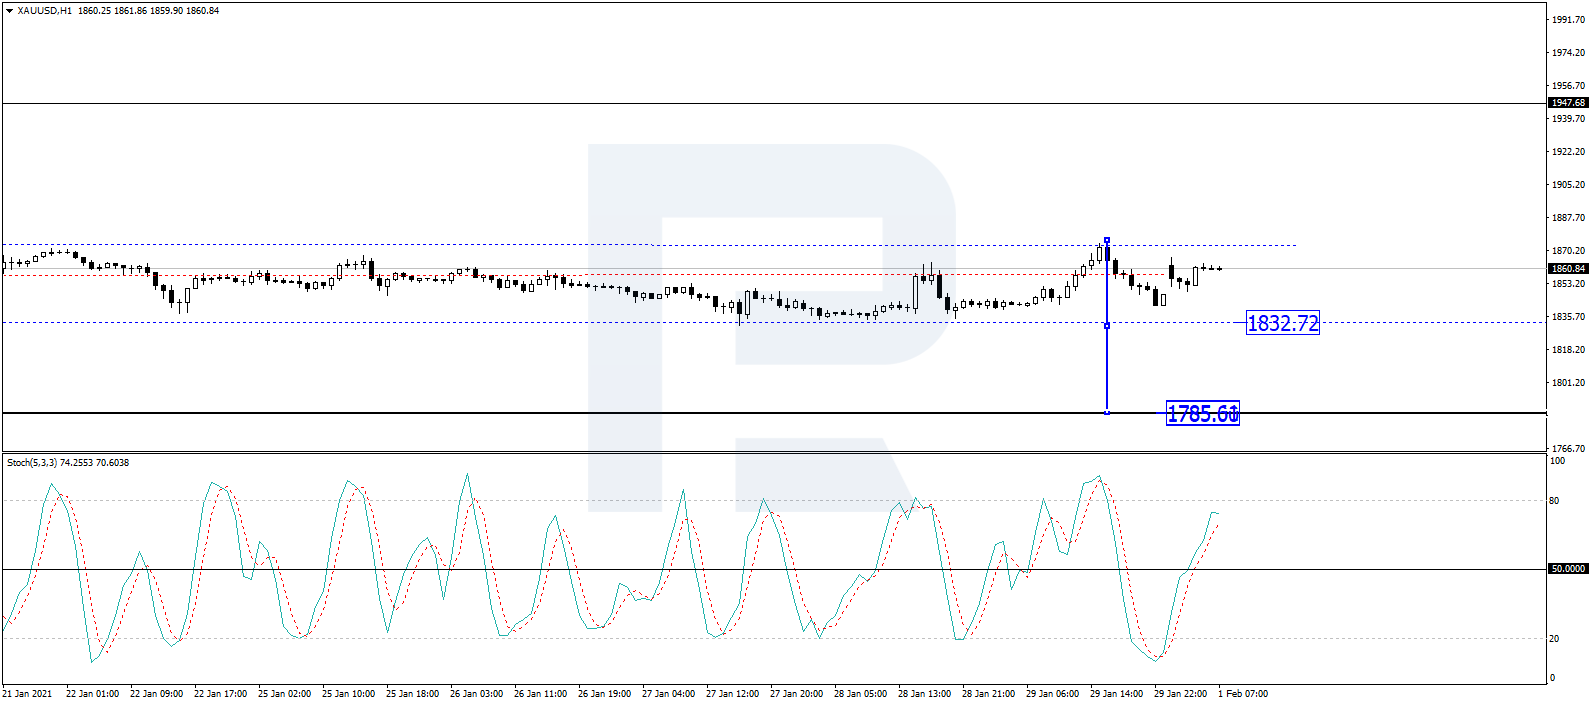
In the H1 chart, XAU/USD is growing towards 1876.10. Possibly, the pair may rebound from this level to the downside and then resume trading within the downtrend with the target at 1832.72. From the technical point of view, this scenario is confirmed by the Stochastic Oscillator: its signal is approaching 80. Later, the line is expected to rebound from this level and move downwards to break 50 as well, thus implying that the asset may continue its decline.
Disclaimer
Any forecasts contained herein are based on the author’s particular opinion. This analysis may not be treated as trading advice. RoboForex bears no responsibility for trading results based on trading recommendations and reviews contained herein.

- COT Metals Charts: Weekly Speculator Bets led by Copper & Steel Jul 18, 2026
- COT Bonds Charts: Weekly Speculator Bets led by 2-Year, SOFR 3M & 5-Year Bonds Jul 18, 2026
- COT Energy Charts: Weekly Speculator Bets led by Brent Oil & Heating Oil Jul 18, 2026
- COT Soft Commodities Charts: Weekly Speculator Bets led by Wheat, Corn & Soybean Meal Jul 18, 2026
- The Bank of Canada kept its interest rate unchanged. Platinum prices reached a three‑week high Jul 16, 2026
- Stock indices rose after the release of US inflation data. China’s GDP slowed sharply Jul 15, 2026
- GBP/USD Awaits Political News: What Will Happen Next Jul 15, 2026
- USD/JPY Holds at Highs: Pressure Lingers on Yen Jul 14, 2026
- Oil prices jumped 4% amid a new wave of escalation between the US and Iran Jul 13, 2026
- EUR/USD: US Inflation Will Determine Everything Jul 13, 2026