
Article By RoboForex.com
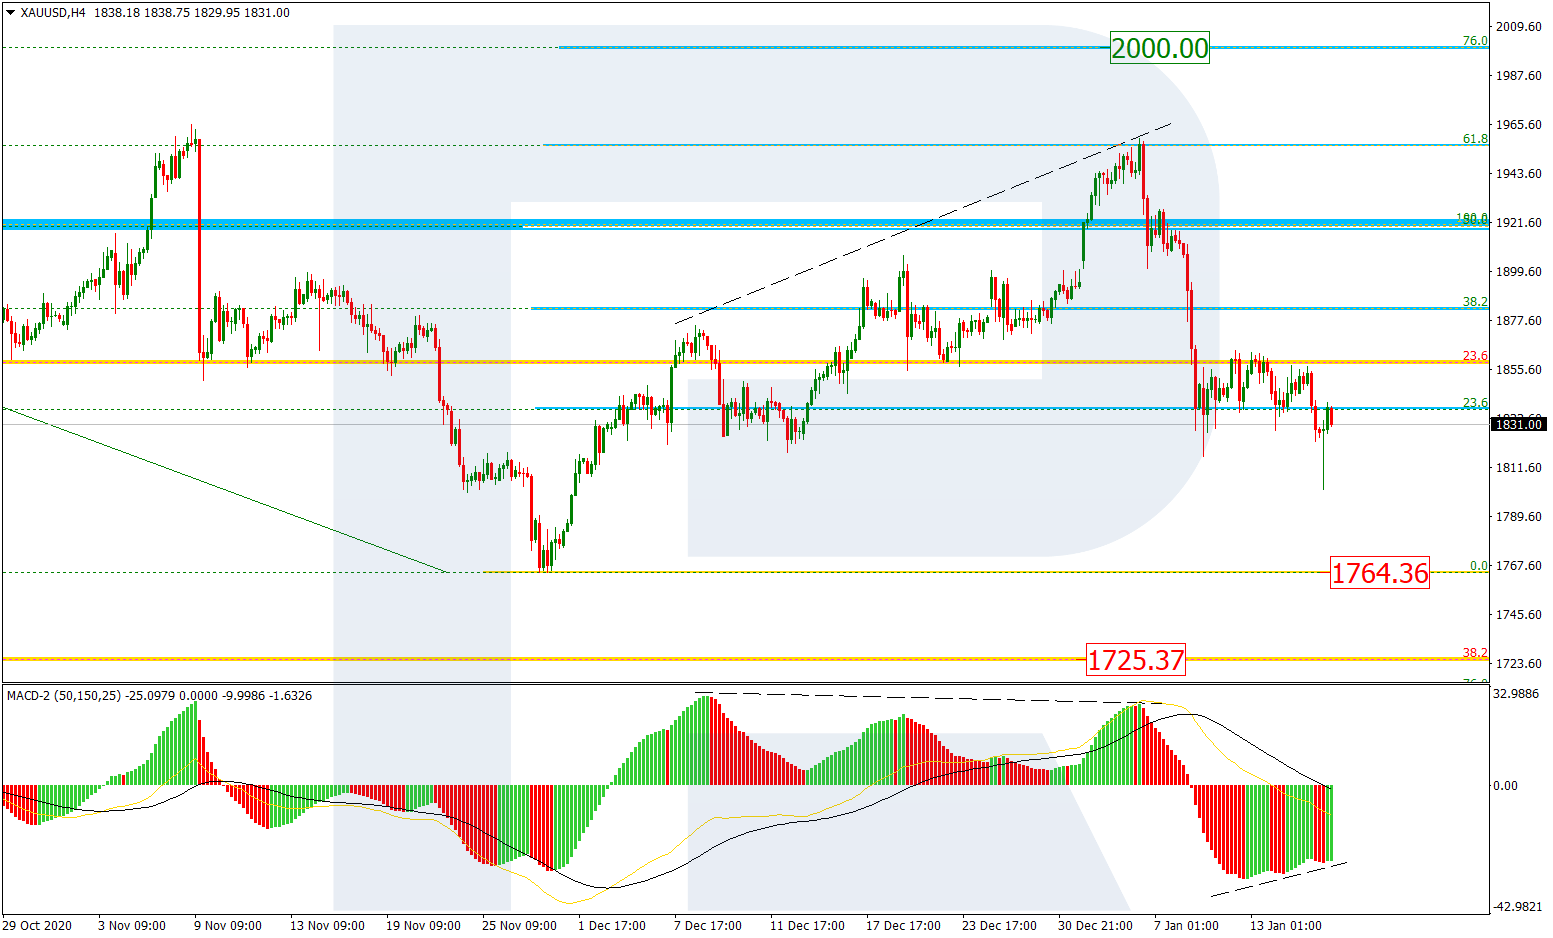
XAUUSD, “Gold vs US Dollar”
In the H4 chart, a divergence on MACD made the pair return to 23.6% fibo but after updating the low the pair started a new pullback. After finishing the short-term correction, the instrument may start another descending impulse to reach the previous low at 1764.36, a breakout of which will lead to further long-term downtrend towards 38.2% at 1725.37. However, one shouldn’t exclude a possibility that the pullback may transform into a new wave to the upside to reach 76.0% fibo at 2000.00.

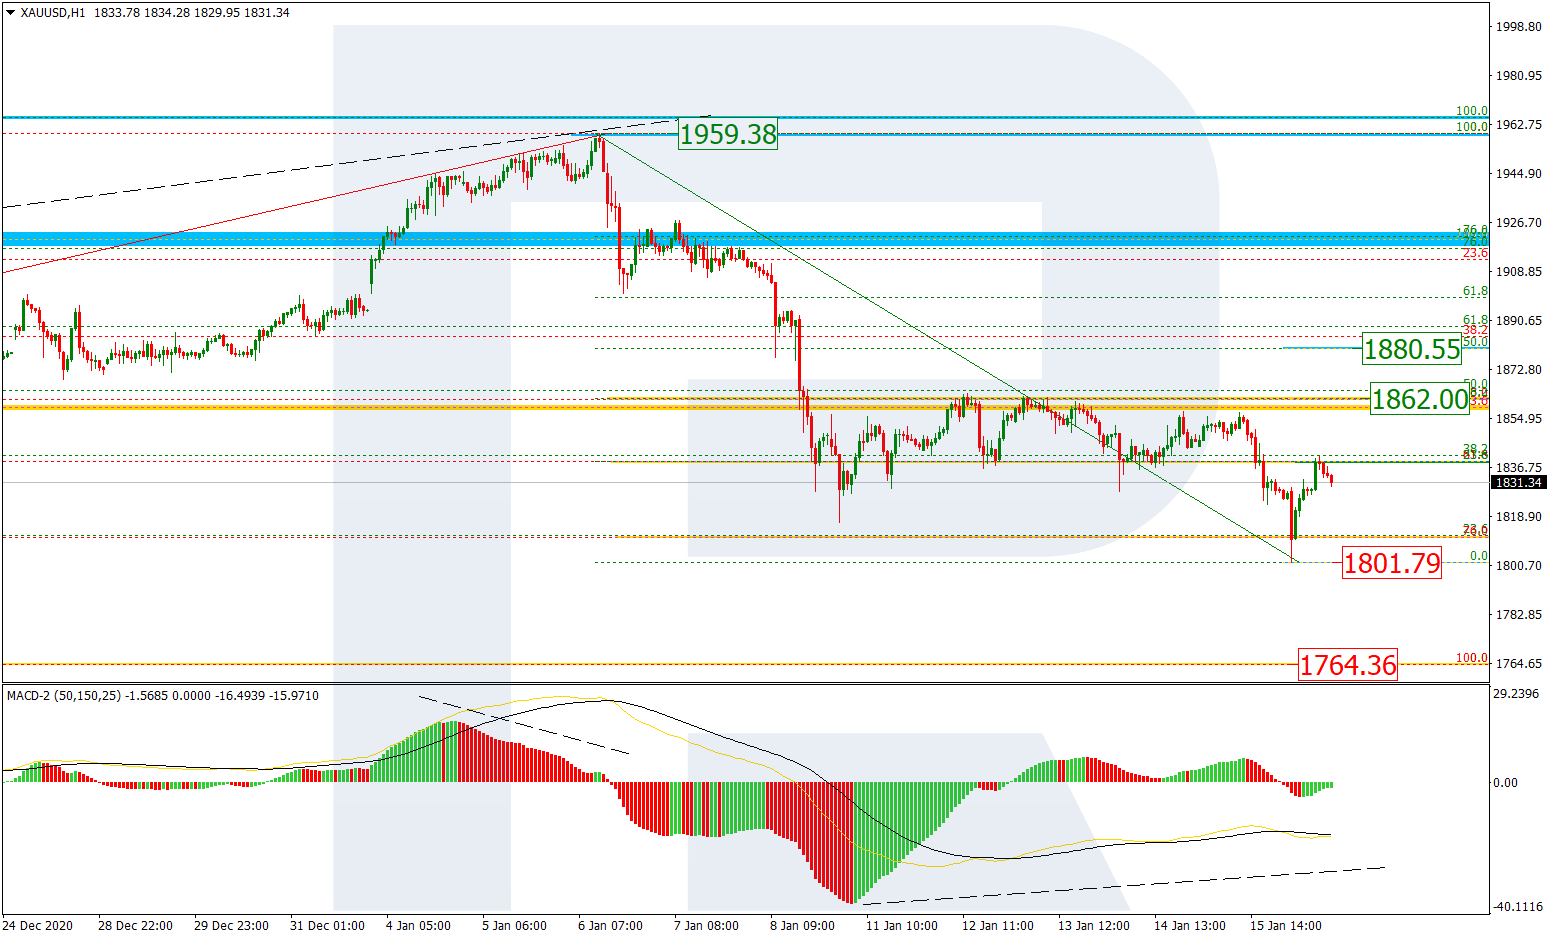
As we can see in the H1 chart, the correctional uptrend has reached 23.6% fibo and may later continue towards 38.2% and 50.0% fibo at 1862.00 and 1880.55 respectively. A breakout of the local low at 1801.79 will result in further downtrend to reach the key low at 1764.36.
Free Reports:
 Get our Weekly Commitment of Traders Reports - See where the biggest traders (Hedge Funds and Commercial Hedgers) are positioned in the futures markets on a weekly basis.
 Download Our Metatrader 4 Indicators – Put Our Free MetaTrader 4 Custom Indicators on your charts when you join our Weekly Newsletter
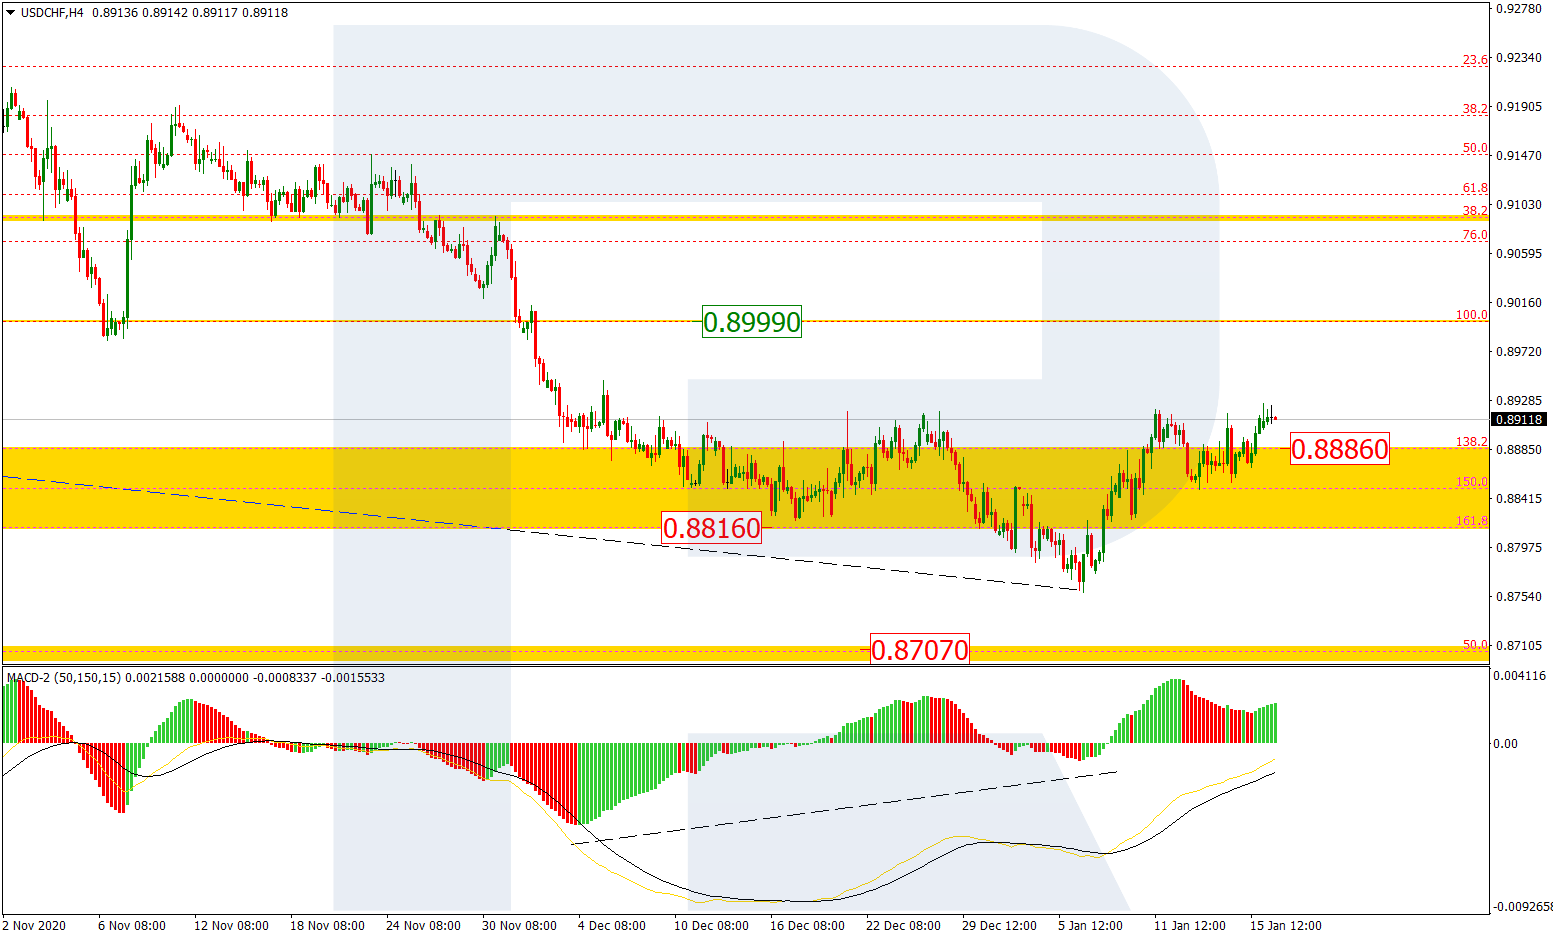
USDCHF, “US Dollar vs Swiss Franc”
As we can see in the H4 chart, after a convergence on MACD, USDCHF has tested the upside border of the post-correctional extension area between 138.2% and 161.8% fibo at 0.8886 and 0.8816 respectively. this growth should be considered as the continuation of the mid-term pullback. The key correctional target is the resistance at 0.8999.
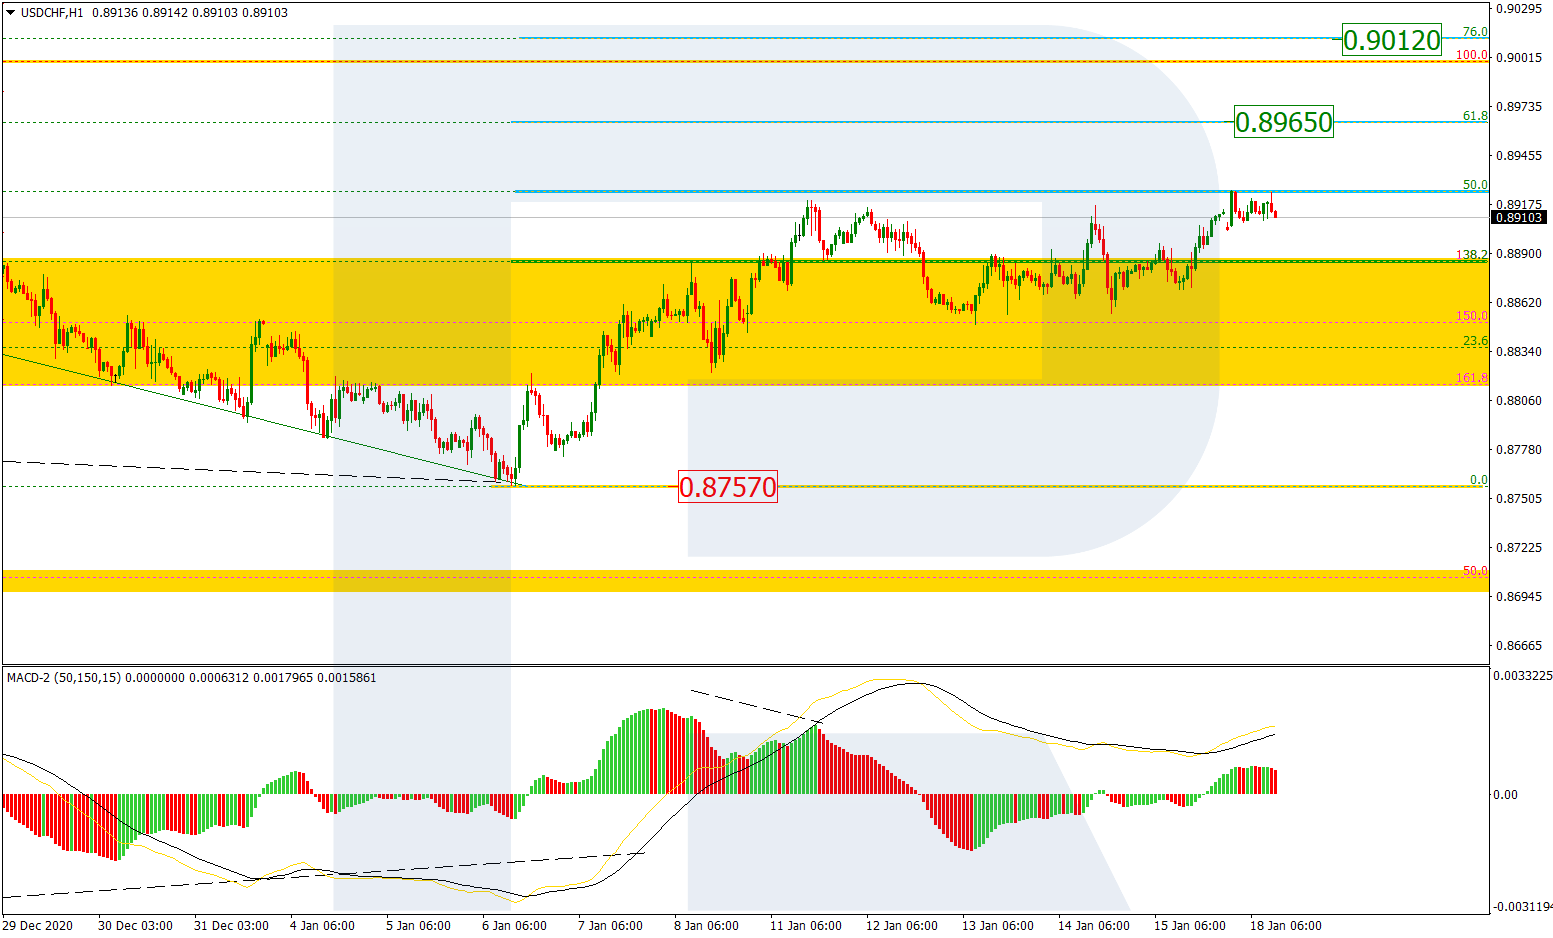
The H1 chart shows a more detailed structure of the correctional trend. The asset has reached 50.0% fibo and, after breaking it, may continue moving towards 61.8% and 76.0% fibo at 0.8965 and 0.9012 respectively. A breakout of the support at 0.8757 will complete this correction and resume the downtrend.
Article By RoboForex.com
Attention!
Forecasts presented in this section only reflect the author’s private opinion and should not be considered as guidance for trading. RoboForex LP bears no responsibility for trading results based on trading recommendations described in these analytical reviews.

- Geopolitical and macroeconomic conditions continue to pressure market sentiment Jul 20, 2026
- USD/JPY Poised to Continue Gains as Expensive Oil and Lack of Support Weigh on Yen Jul 20, 2026
- COT Metals Charts: Weekly Speculator Bets led by Copper & Steel Jul 18, 2026
- COT Bonds Charts: Weekly Speculator Bets led by 2-Year, SOFR 3M & 5-Year Bonds Jul 18, 2026
- COT Energy Charts: Weekly Speculator Bets led by Brent Oil & Heating Oil Jul 18, 2026
- COT Soft Commodities Charts: Weekly Speculator Bets led by Wheat, Corn & Soybean Meal Jul 18, 2026
- The Bank of Canada kept its interest rate unchanged. Platinum prices reached a three‑week high Jul 16, 2026
- Stock indices rose after the release of US inflation data. China’s GDP slowed sharply Jul 15, 2026
- GBP/USD Awaits Political News: What Will Happen Next Jul 15, 2026
- USD/JPY Holds at Highs: Pressure Lingers on Yen Jul 14, 2026