
Author: Dmitriy Gurkovskiy, Chief Analyst at RoboForex
Despite falling slowly, the oil price remains quite high on Monday, December 28th. Brent is trading at $51.16 – investors are back to the market after a Christmas break and fully prepared to respond to the external background.
On one hand, a new aggressive strain of the coronavirus in the United Kingdom, Japan, and then other Asian countries, does not give much ground for optimism in the matter of the prospective demand for energies. Moreover, if this new strain is more dangerous and mobile, the world may face new closures of borders and lockdowns everywhere, in which case the global economy won’t recover anytime soon.
On the other hand, the media reports that the sector of cargo-carrying operations by sea has been extremely active during the final weeks. Of course, it might just be a local surge in activity before New Year, which will die down in January. However, everything is looking very good so far as the above-mentioned operations create an excellent demand for energies – what else does the oil need?
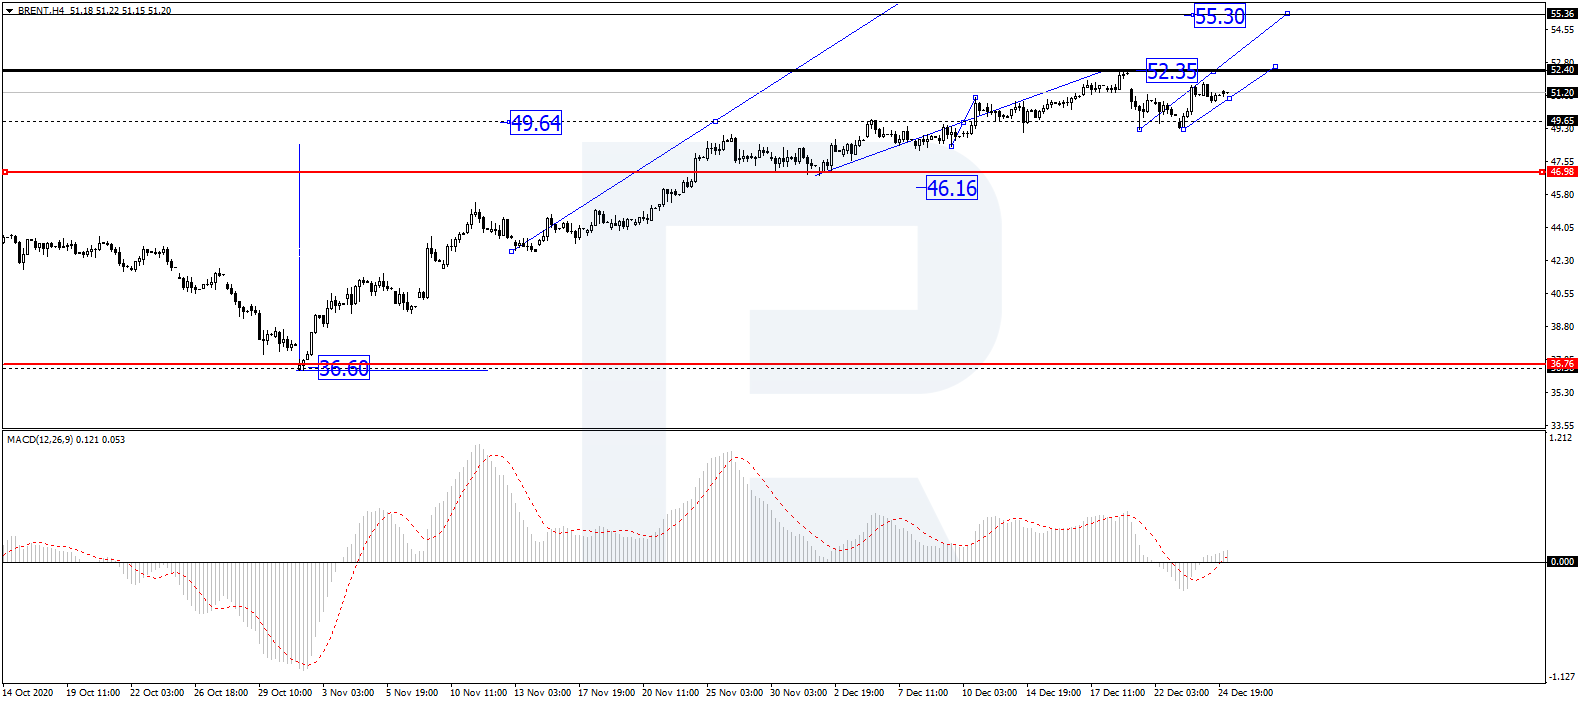
In the H4 chart, after finishing the ascending wave at 52.35 along with the correction towards 49.65, Brent is growing to break 51.11. Possibly, the asset may form another ascending wave to break 52.35 and then continue trading upwards with the short-term target at 55.30. From the technical point of view, this scenario is confirmed by MACD Oscillator: after leaving the histogram area, its signal line has broken 0 to the upside. Later, the line is expected to continue moving to the upside.
Free Reports:
 Sign Up for Our Stock Market Newsletter – Get updated on News, Charts & Rankings of Public Companies when you join our Stocks Newsletter
 Get our Weekly Commitment of Traders Reports - See where the biggest traders (Hedge Funds and Commercial Hedgers) are positioned in the futures markets on a weekly basis.
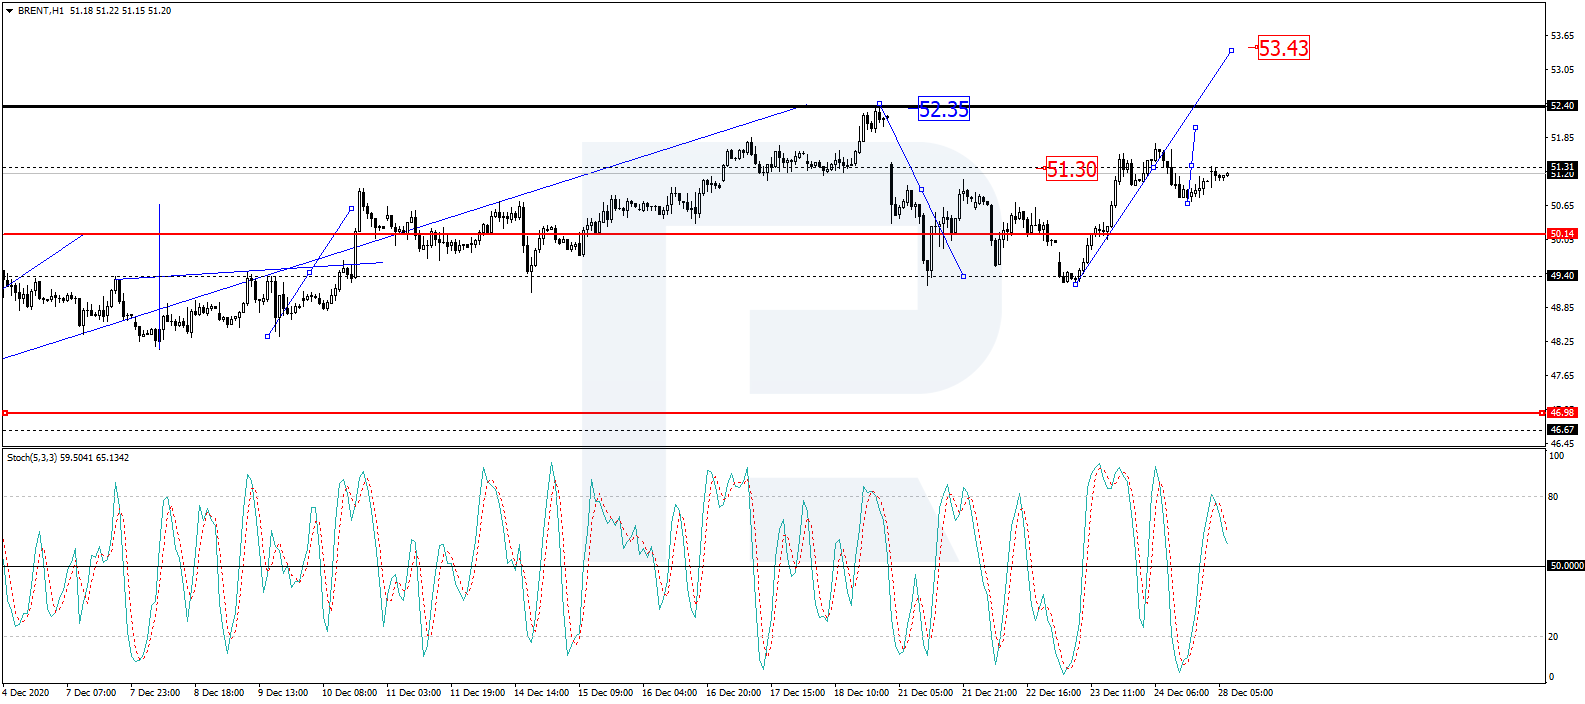
As we can see in the H1 chart, after completing the ascending wave at 51.30, Brent is consolidating below this level. If later the price breaks this range to the downside, the market may start a new correction to reach 50.10; if to the upside – resume trading upwards to break 52.50 and then continue growing with the target at 55.30. From the technical point of view, this idea is confirmed by Stochastic Oscillator: after breaking 50 to the upside, its signal line continues moving towards 80. After that, the line is expected to rebound from 80 and resume falling to return to 50. Later, there might be another rebound from 50 to the upside, which may lead to further growth towards 80 or even higher.
Disclaimer
Any forecasts contained herein are based on the author’s particular opinion. This analysis may not be treated as trading advice. RoboForex bears no responsibility for trading results based on trading recommendations and reviews contained herein.

- Iran wants to maintain the blockade of the Strait of Hormuz until the United States closes all its bases in the Middle East Mar 13, 2026
- USD/JPY at Highest Since July 2024: Market Awaits BoJ Intervention Mar 13, 2026
- Oil continues to rise despite record strategic reserve releases by the IEA Mar 12, 2026
- Gold Moderately Lower as Market Pressures Intensify Mar 12, 2026
- IEA deploys strategic reserves to halt soaring oil prices Mar 11, 2026
- GBP/USD Managed to Rise, but Pressure Factors Remain in Place Mar 11, 2026
- Trump signals de-escalation in the Middle East; China’s trade surplus hits a new record Mar 10, 2026
- EUR/USD in Turbulence: Market Questions When Conflict Over Iran Will End Mar 10, 2026
- Prices push oil above $100 per barrel Mar 9, 2026
- COT Metals Charts: Speculator Bets led by Silver, Gold & Platinum Mar 7, 2026