
Article By RoboForex.com
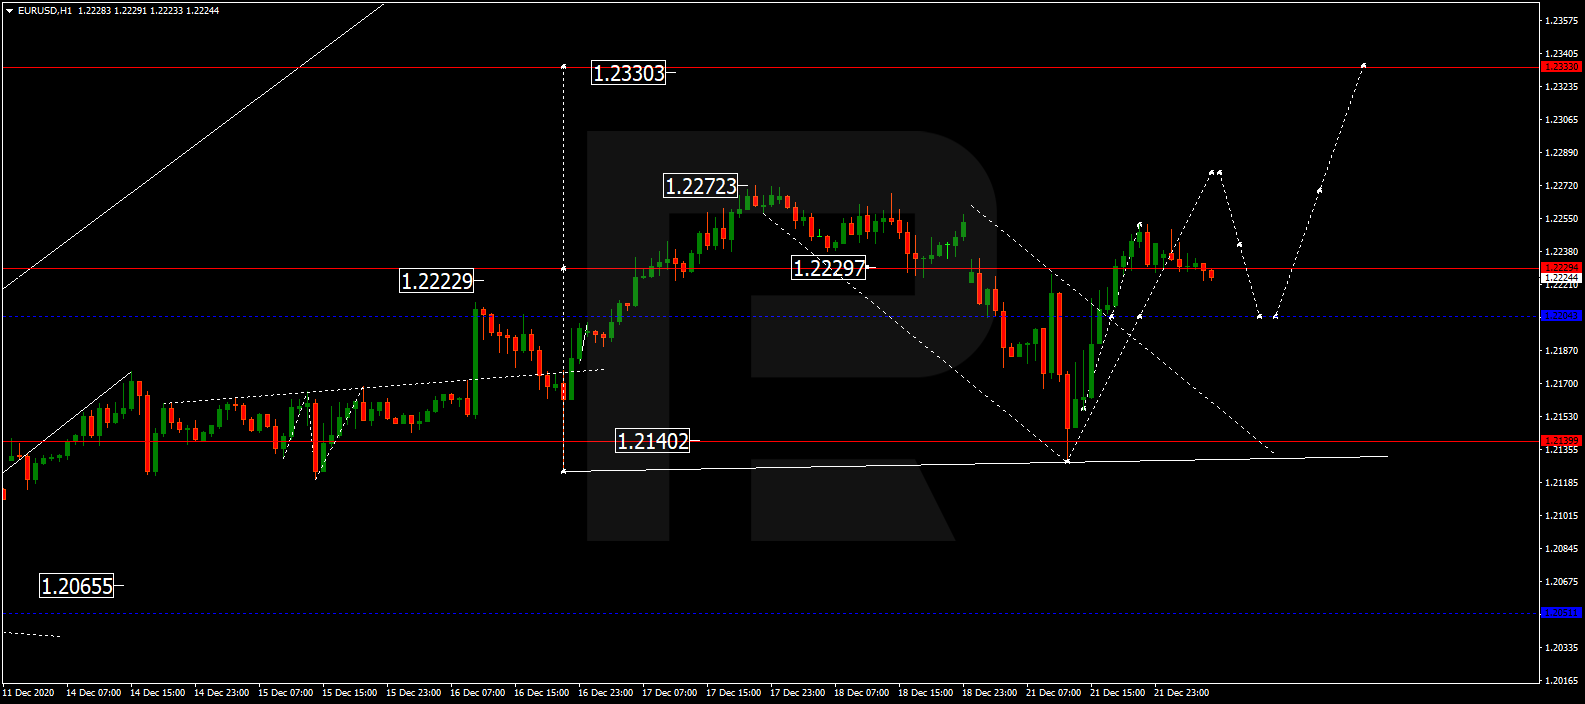
EURUSD, “Euro vs US Dollar”
After completing the descending wave at 1.2140 and then breaking 1.2200 to the upside, EURUSD has reached the short-term upside target at 1.2249; right now, it is falling to test 1,2200 from above and may later form one more ascending structure towards 1.2277. However, if the price breaks 1.2190 to the downside, the market may continue the correction to reach 1.2050 and then start another growth with the target at 1.2330.

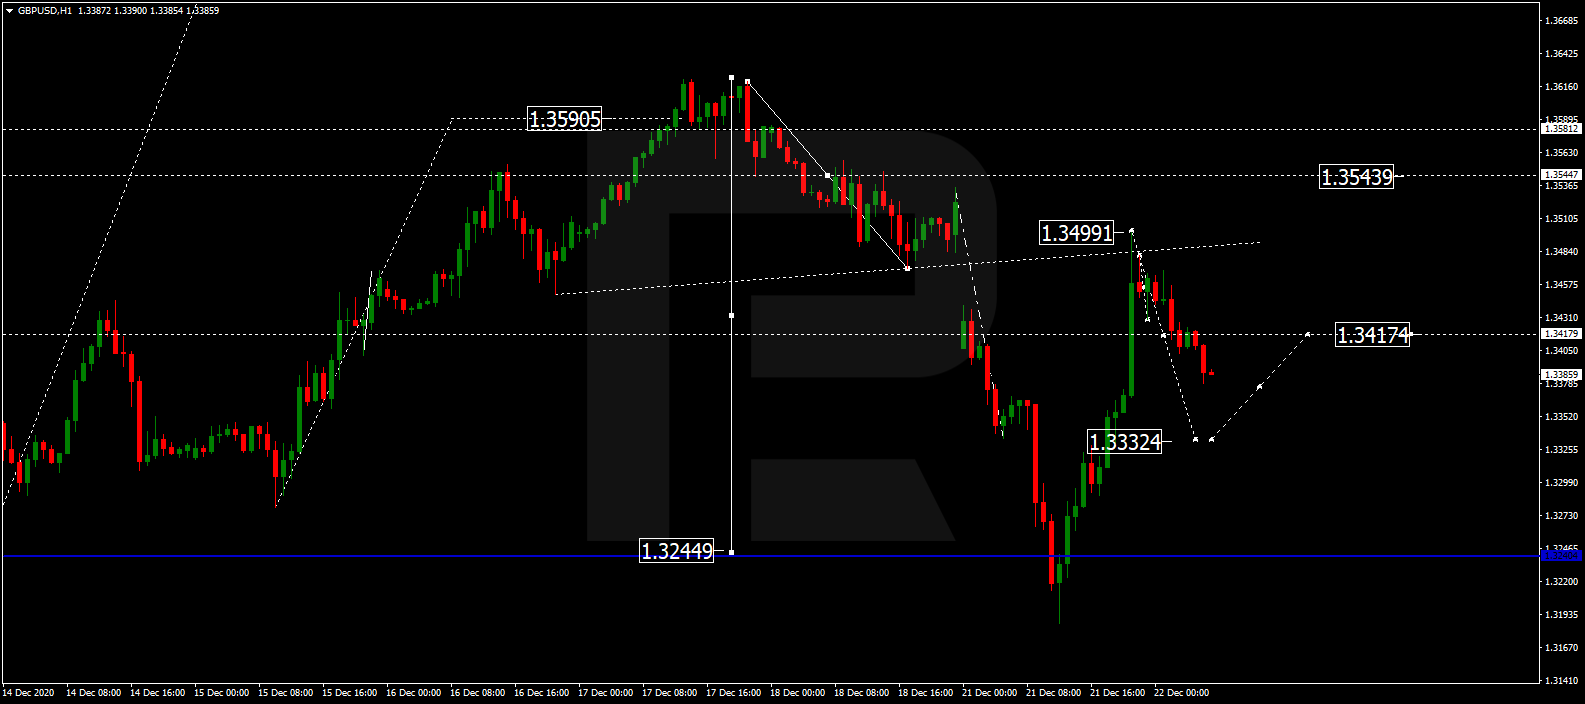
GBPUSD, “Great Britain Pound vs US Dollar”
After finishing the descending wave at 1.3230 and then breaking 1.3330 to the upside, GBPUSD has reached the short-term target at 1.3499; right now, it is falling to test 1.3330 from above and may later start another growth towards 1.3544. However, if the price breaks 1.3320 to the downside, the instrument may continue trading downwards with the target at 1.3200.
Free Reports:
 Download Our Metatrader 4 Indicators – Put Our Free MetaTrader 4 Custom Indicators on your charts when you join our Weekly Newsletter
 Get our Weekly Commitment of Traders Reports - See where the biggest traders (Hedge Funds and Commercial Hedgers) are positioned in the futures markets on a weekly basis.
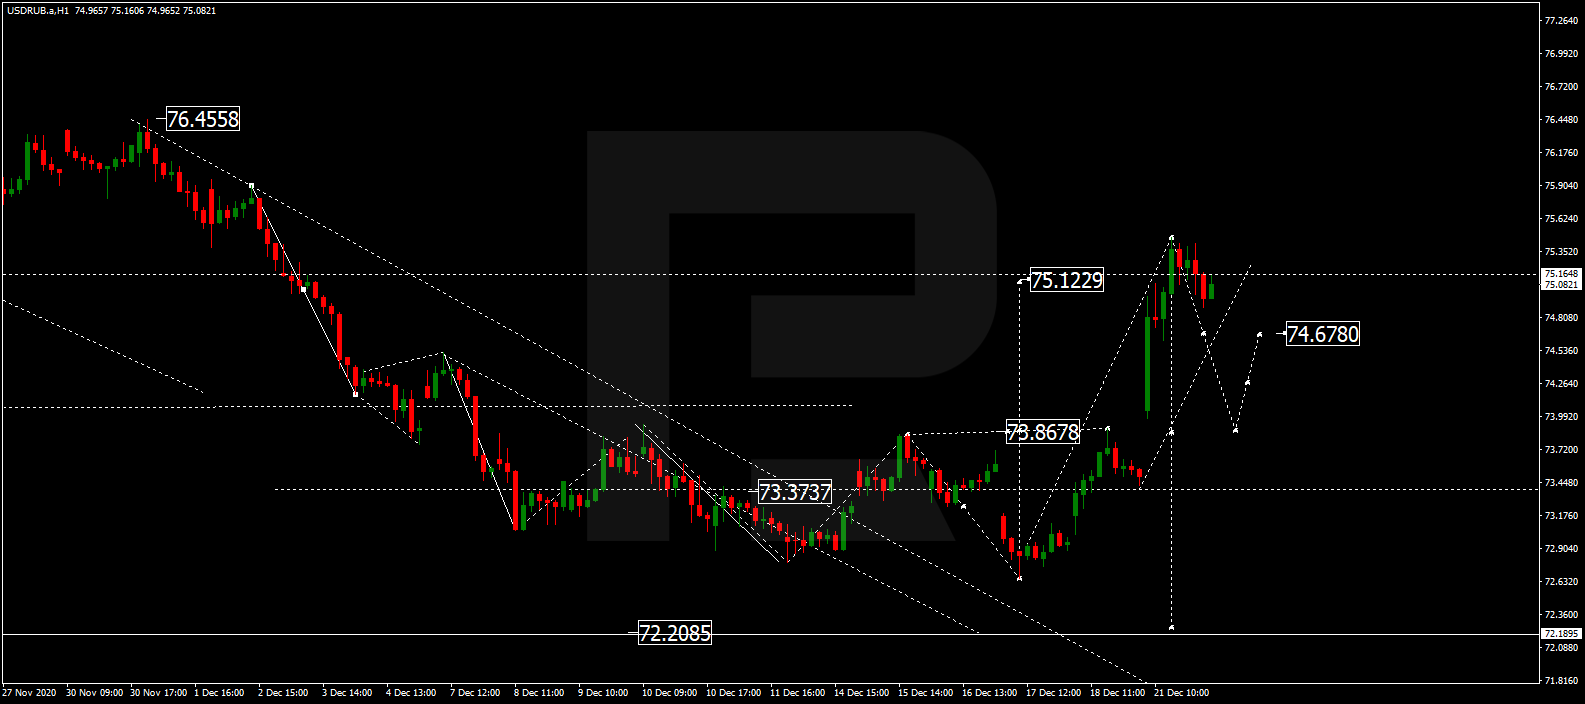
USDRUB, “US Dollar vs Russian Ruble”
After breaking 73.83 to the upside and then completing the ascending structure at 75.12, USDRUB is expected to test 73.83 from above and may later form one more ascending structure towards 74.67, thus forming a new consolidation range between two latter levels. If later the price breaks this range to the upside, the market may start another growth to reach 76.76; if to the downside – resume trading downwards with the target at 72.20.
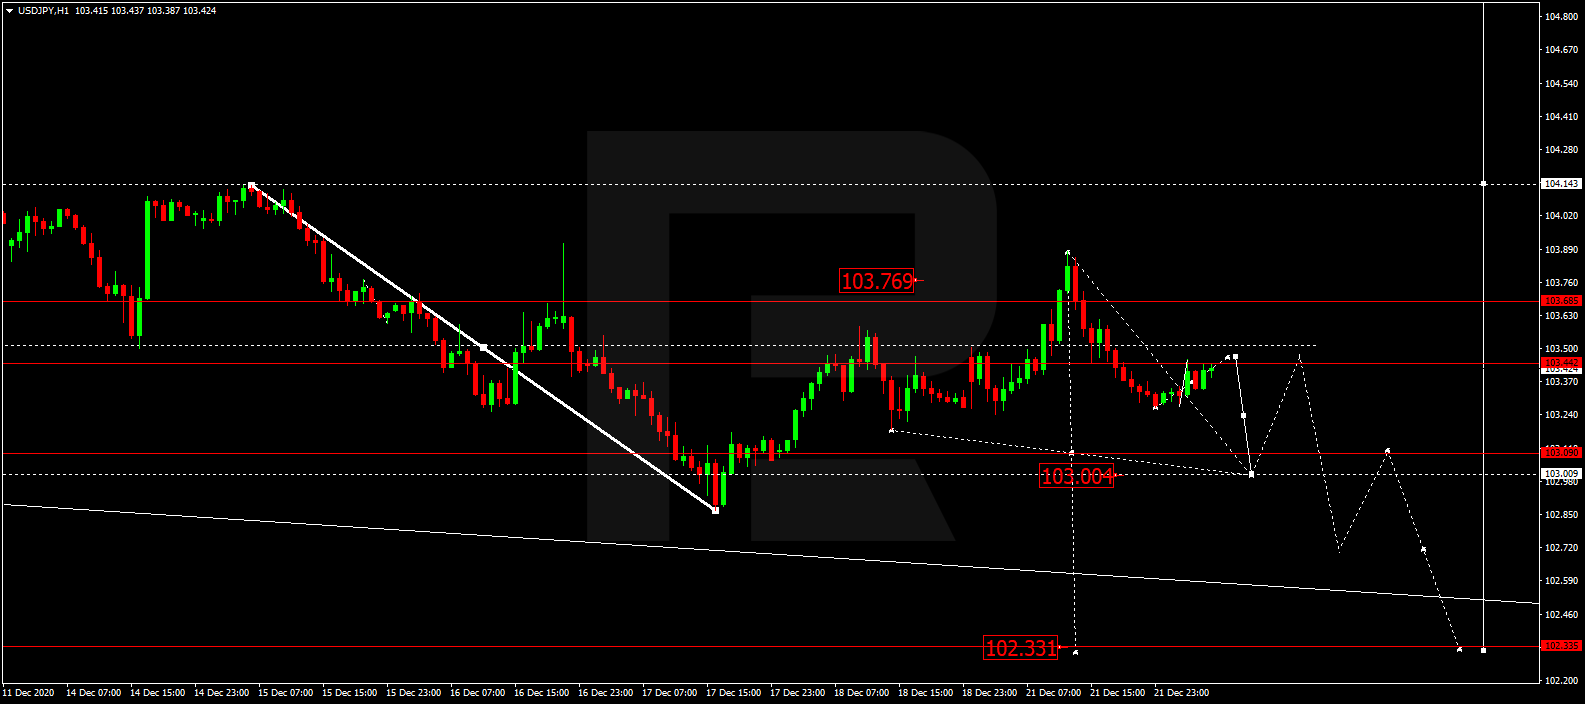
USDJPY, “US Dollar vs Japanese Yen”
After finishing the ascending wave at 103.77, USDJPY is falling towards 103.00. After that, the instrument may grow to reach 103.40 and then start another decline to break 102.70. Later, the market may form a new descending structure with the closest target at 102.50.
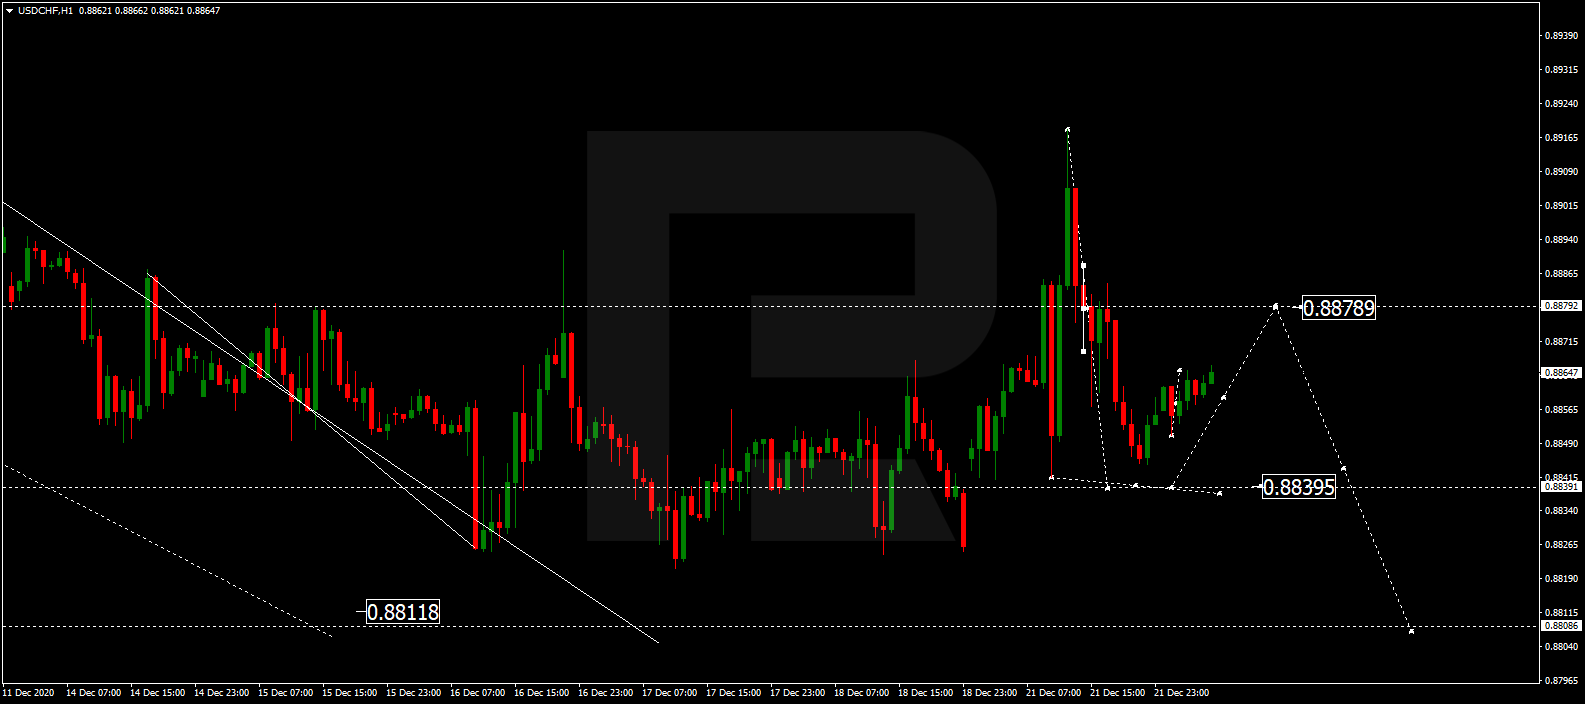
USDCHF, “US Dollar vs Swiss Franc”
After finishing the ascending structure at 0.8900, then reaching 0.8880, and forming a new consolidation range there, USDCHF has broken this range to the downside to reach the short-term target at 0.8844; right now, it is correcting to test 0.8877 from below. After that, the instrument may start another decline with the target at 0.8839.
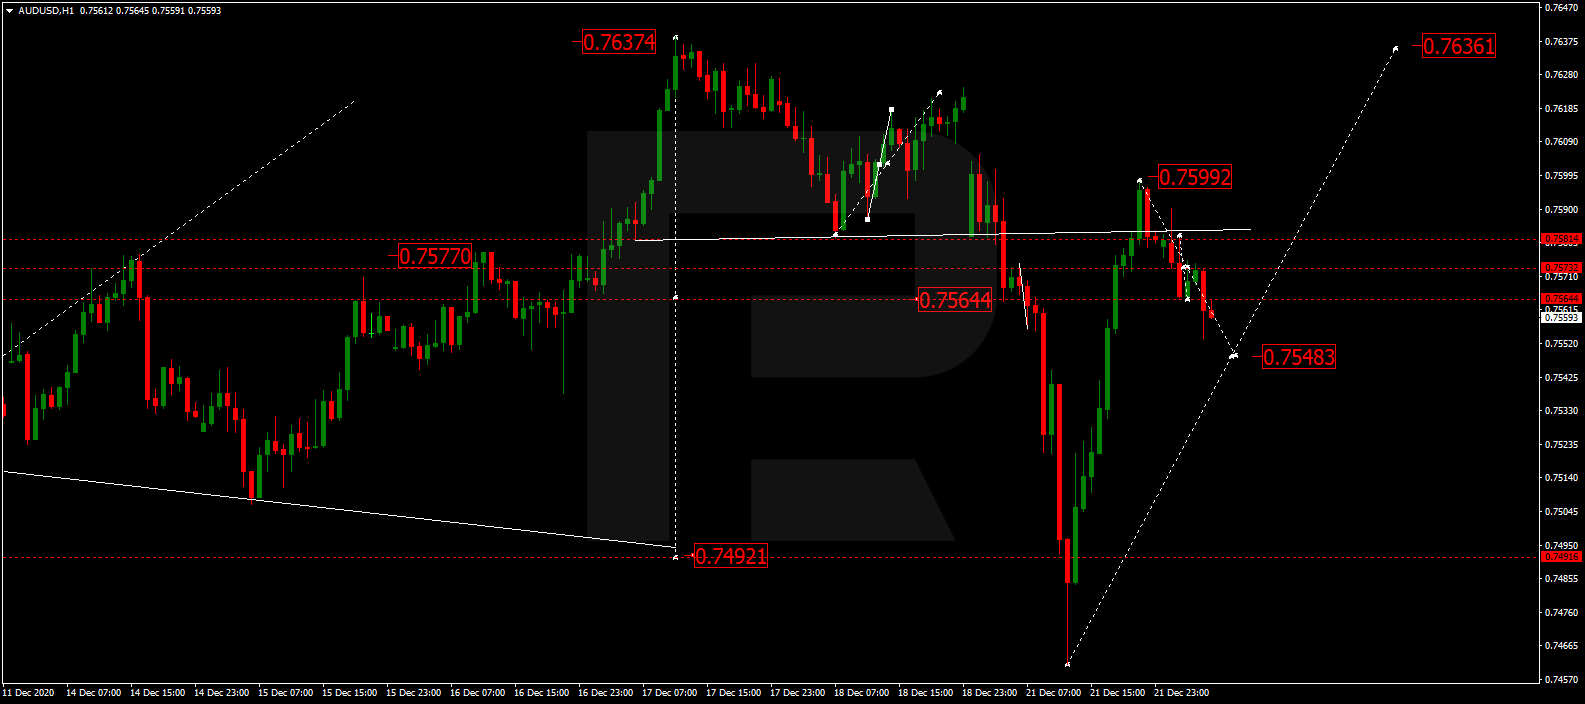
AUDUSD, “Australian Dollar vs US Dollar”
After completing the descending wave at 0.7490 along with the correction towards 0.7599, AUDUSD is trading downwards to reach 0.7548. Later, the market may start a new growth with the target at 0.7636.
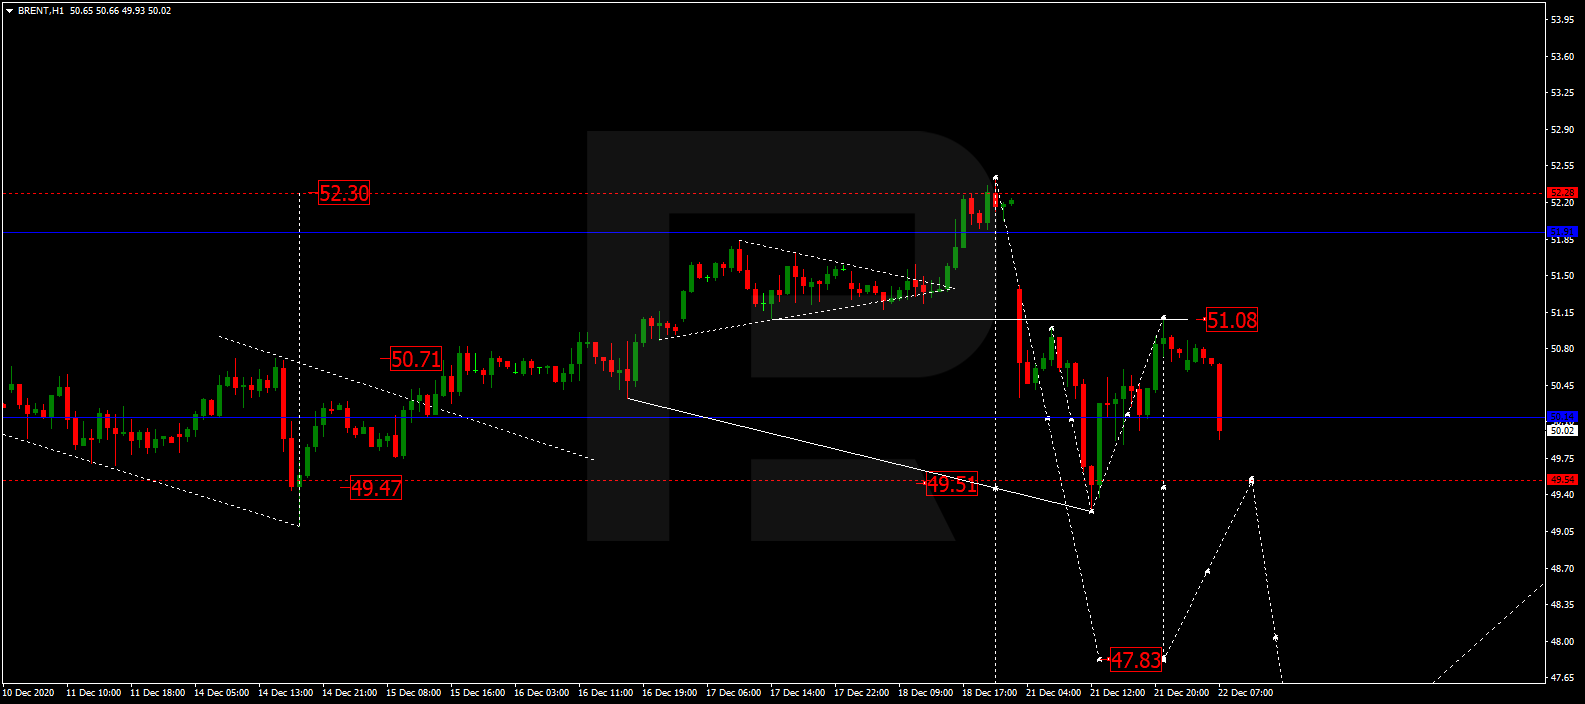
BRENT
After completing another descending structure at 49.50, Brent has tested 51.08 from below and may later fall towards 50.00, thus forming a new consolidation range between these two levels. If later the price breaks this range to the downside; the market may continue the correction to reach 47.84; if to the upside – resume trading upwards to break 52.85 and then continue growing with the target at 55.00.
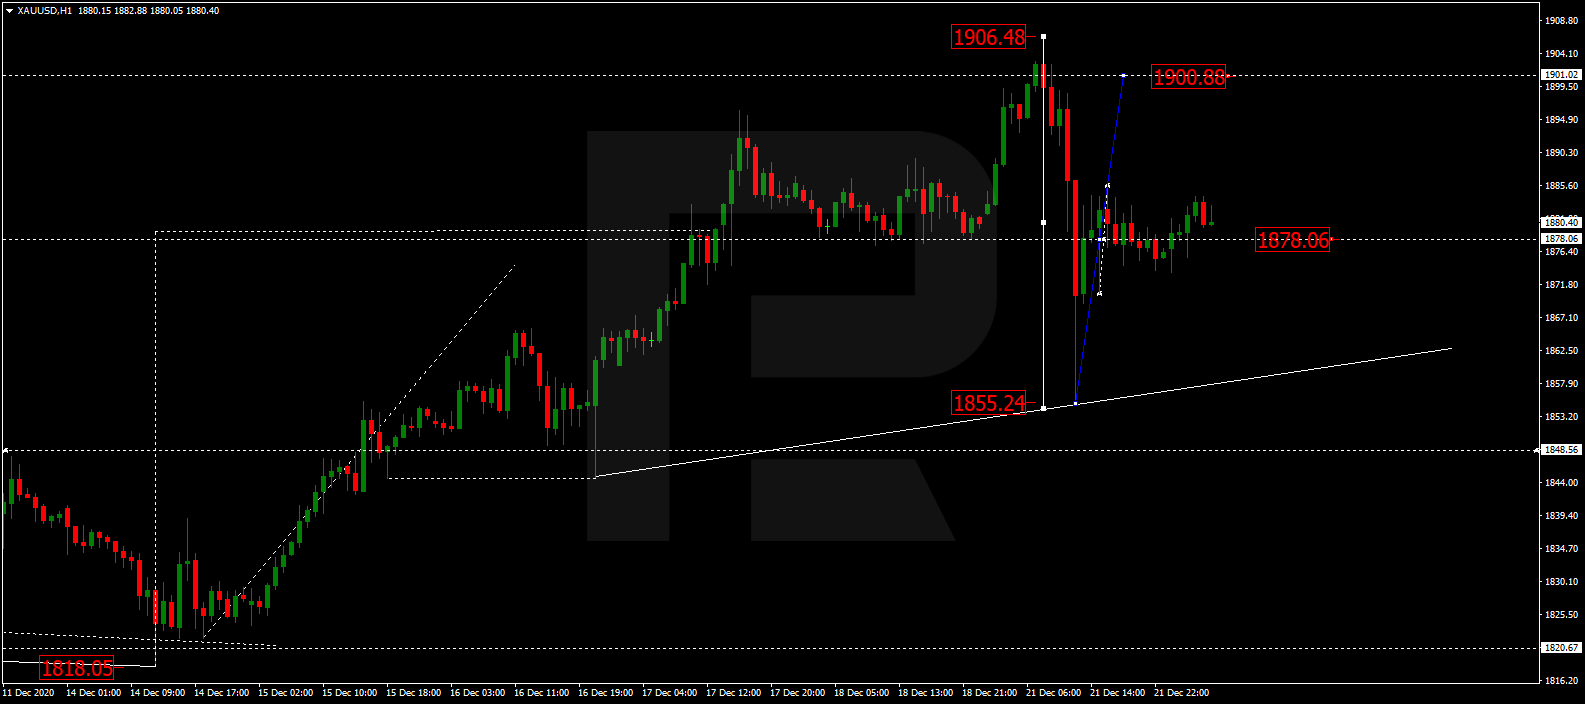
XAUUSD, “Gold vs US Dollar”
After finishing the ascending wave at 1906.48 and then falling towards 1855.25, Gold has formed one more ascending structure to reach 1878.00; right now, it is forming a new consolidation range between the latter level. If later the price breaks this range to the downside at 1870.00; the market may form a new descending structure to break 1850.00 and then continue trading downwards to reach 1820.66; if to the upside at 1886.00 – resume trading upwards with the target at 1900.00 and then start another decline towards 1750.00.
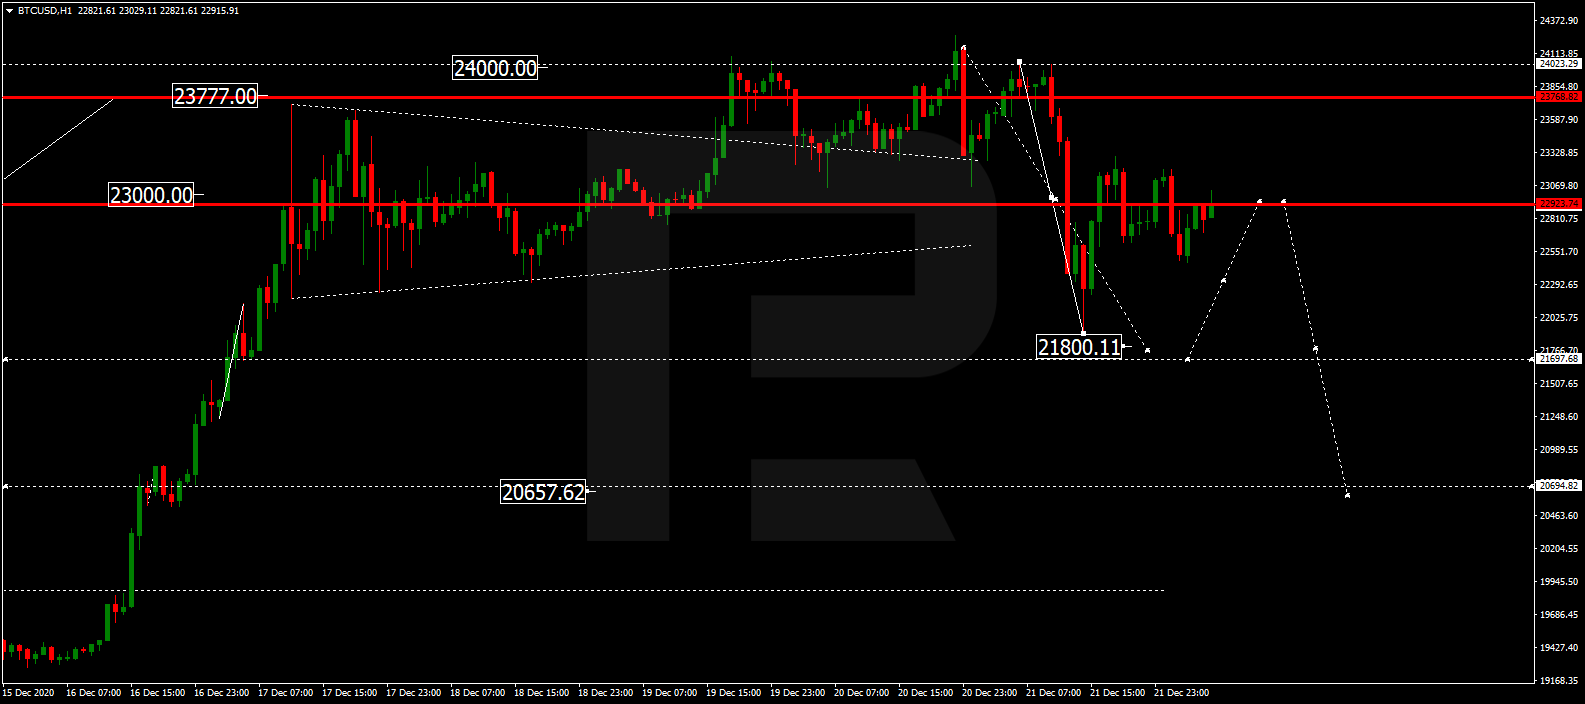
BTCUSD, “Bitcoin vs US Dollar”
BTCUSD continues falling to reach 21800.00 and may later correct towards 22900.00, thus forming a new consolidation range between these two levels. If later the price breaks this range to the downside; the market may form a new descending structure with the target at 20600.00; if to the upside – resume trading upwards to reach 24700.00 and then start a new decline towards the above-mentioned target.
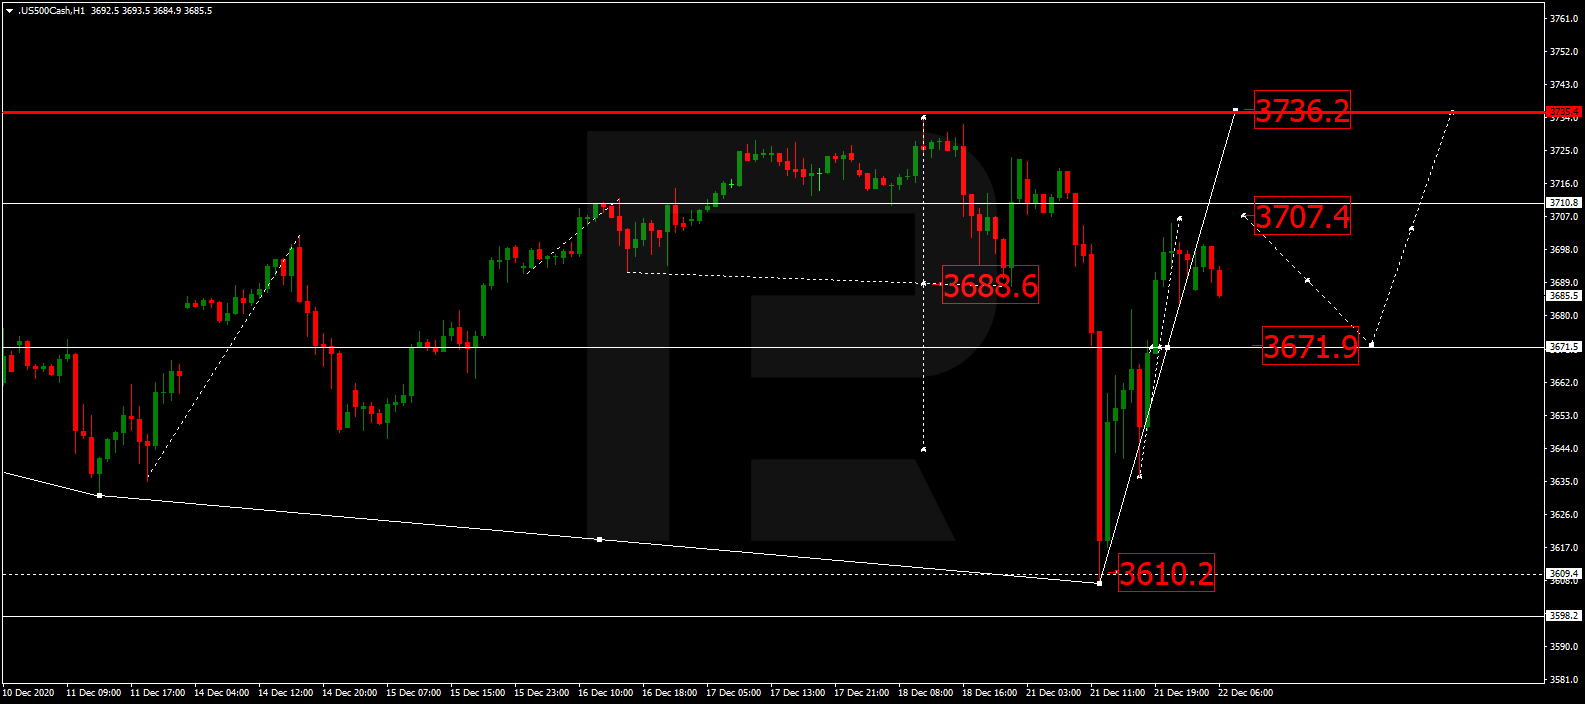
S&P 500
After finishing the descending structure at 3610.2 along with the correction towards 3700.0, the S&P index is falling to reach 3671.9, thus forming a new consolidation range between two latter levels. If later the price breaks this range to the downside; the market may form a new descending structure to reach 3600.0; if to the upside – resume trading upwards with the target at 3737.0.
Article By RoboForex.com
Attention!
Forecasts presented in this section only reflect the author’s private opinion and should not be considered as guidance for trading. RoboForex LP bears no responsibility for trading results based on trading recommendations described in these analytical reviews.

- RoboForex Launches Swap-Free Trading for All Clients Mar 16, 2026
- Gold Continues to Decline Amid Fed Expectations Mar 16, 2026
- Investors begin pricing in prolonged stagflation due to the blockade of the Strait of Hormuz Mar 16, 2026
- Iran wants to maintain the blockade of the Strait of Hormuz until the United States closes all its bases in the Middle East Mar 13, 2026
- USD/JPY at Highest Since July 2024: Market Awaits BoJ Intervention Mar 13, 2026
- Oil continues to rise despite record strategic reserve releases by the IEA Mar 12, 2026
- Gold Moderately Lower as Market Pressures Intensify Mar 12, 2026
- IEA deploys strategic reserves to halt soaring oil prices Mar 11, 2026
- GBP/USD Managed to Rise, but Pressure Factors Remain in Place Mar 11, 2026
- Trump signals de-escalation in the Middle East; China’s trade surplus hits a new record Mar 10, 2026