
Article By RoboForex.com
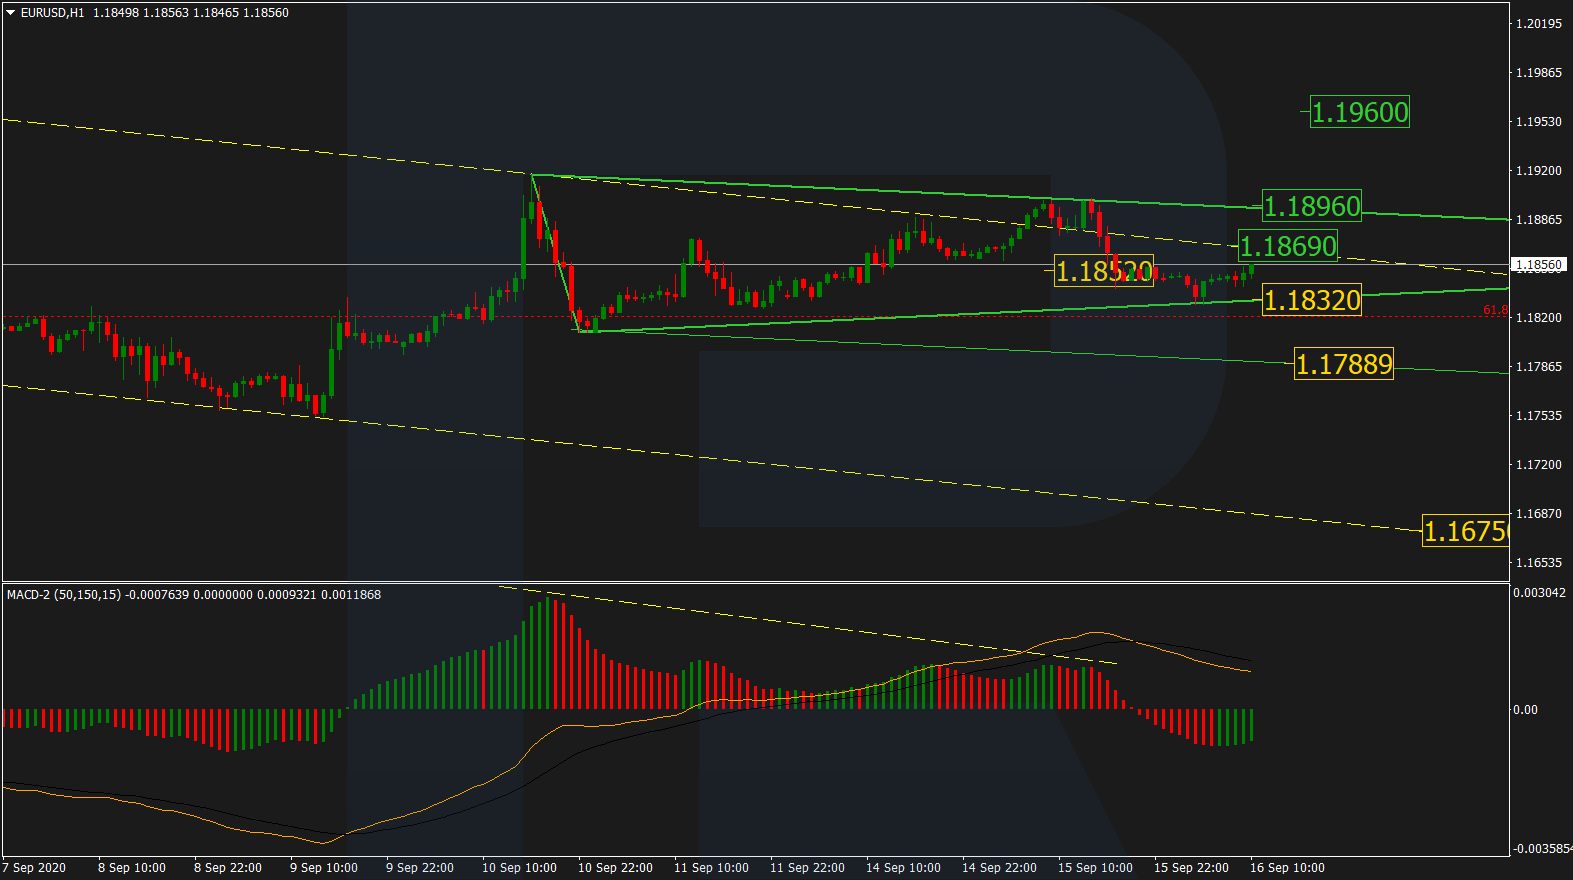
EURUSD, “Euro vs US Dollar”
After updating its local highs and then correcting to break the support area at 1.1852, EURUSD has formed another support line at 1.1832; right now, it is expanding a Triangle consolidation pattern. Possibly, the pair may rebound from the latter support and then test the mid-term resistance level at 1.1869 or even the resistance line of the above-mentioned pattern at 1.1896. If later the price breaks this level, the market may continue growing to reach 1.1960. However, an alternative scenario implies that the instrument may break the support level at 1.1832 and then continue trading downwards to reach the projected support area at 1,1789. After that, the asset may break it and continue its mid-term decline with the target at 1.1675.

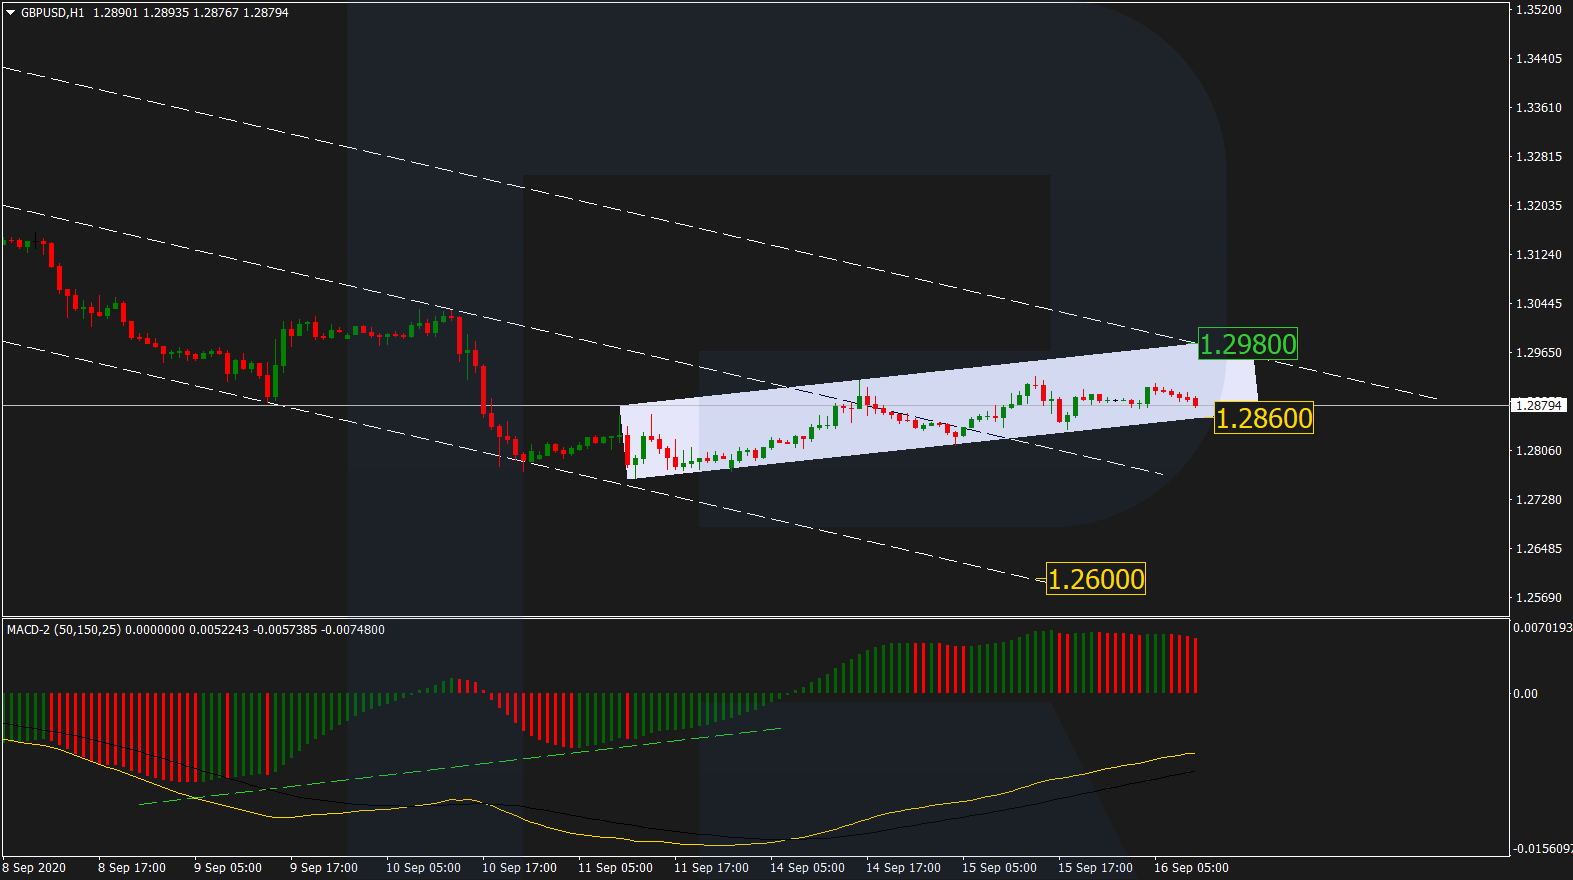
GBPUSD, “Great Britain Pound vs US Dollar”
After breaking the resistance line of the mid-term channel at 1.2890, GBPUSD has fixed inside the projected channel. The upside target is at 1.2980. However, if the price breaks the local support area at 1.2860, the market may continue falling to update the lows and reach 1.2600.
Free Reports:
 Sign Up for Our Stock Market Newsletter – Get updated on News, Charts & Rankings of Public Companies when you join our Stocks Newsletter
 Get our Weekly Commitment of Traders Reports - See where the biggest traders (Hedge Funds and Commercial Hedgers) are positioned in the futures markets on a weekly basis.
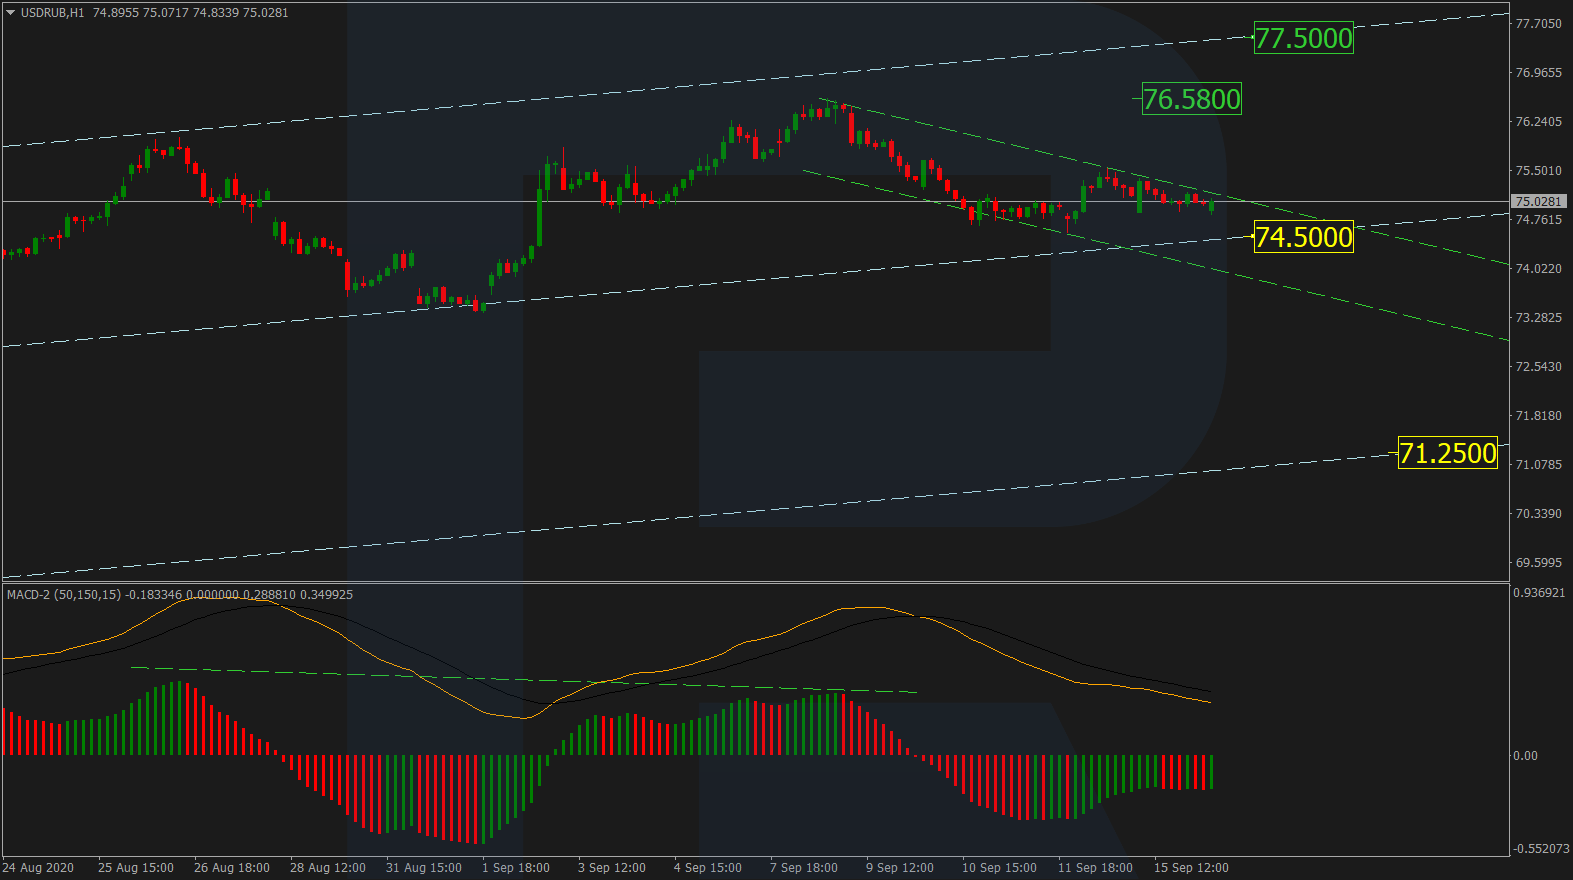
USDRUB, “US Dollar vs Russian Ruble”
USDRUB is slowly falling towards the support area at 74.50. If the price breaks it, the market may continue the current descending tendency with the target at 71.25. This scenario is confirmed by the MACD indicator, which is directed to the downside. Still, there might be another scenario, which implies that the pair may rebound from the support and form a new ascending wave to reach the high at 76.58 and then 77.50.
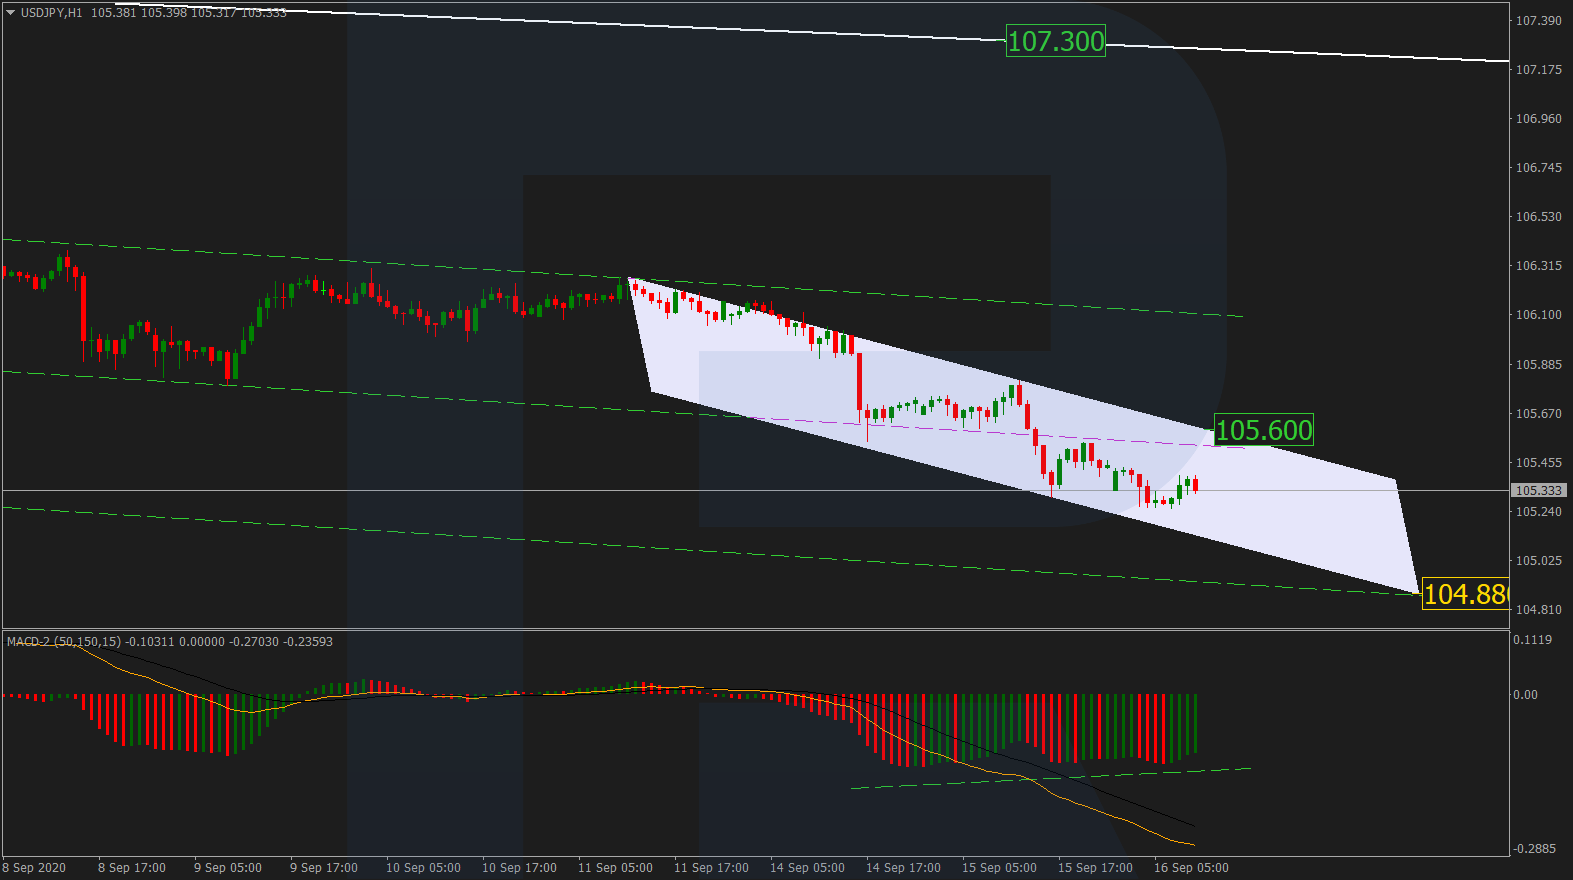
USDJPY, “US Dollar vs Japanese Yen”
After testing 105.60, USDJPY has broken this level. The MACD indicator is forming a convergence, which may hint at a short-term pullback towards the local resistance line and a test of 105.60 from below. Later, the market may continue trading downwards with the target at 104.88.
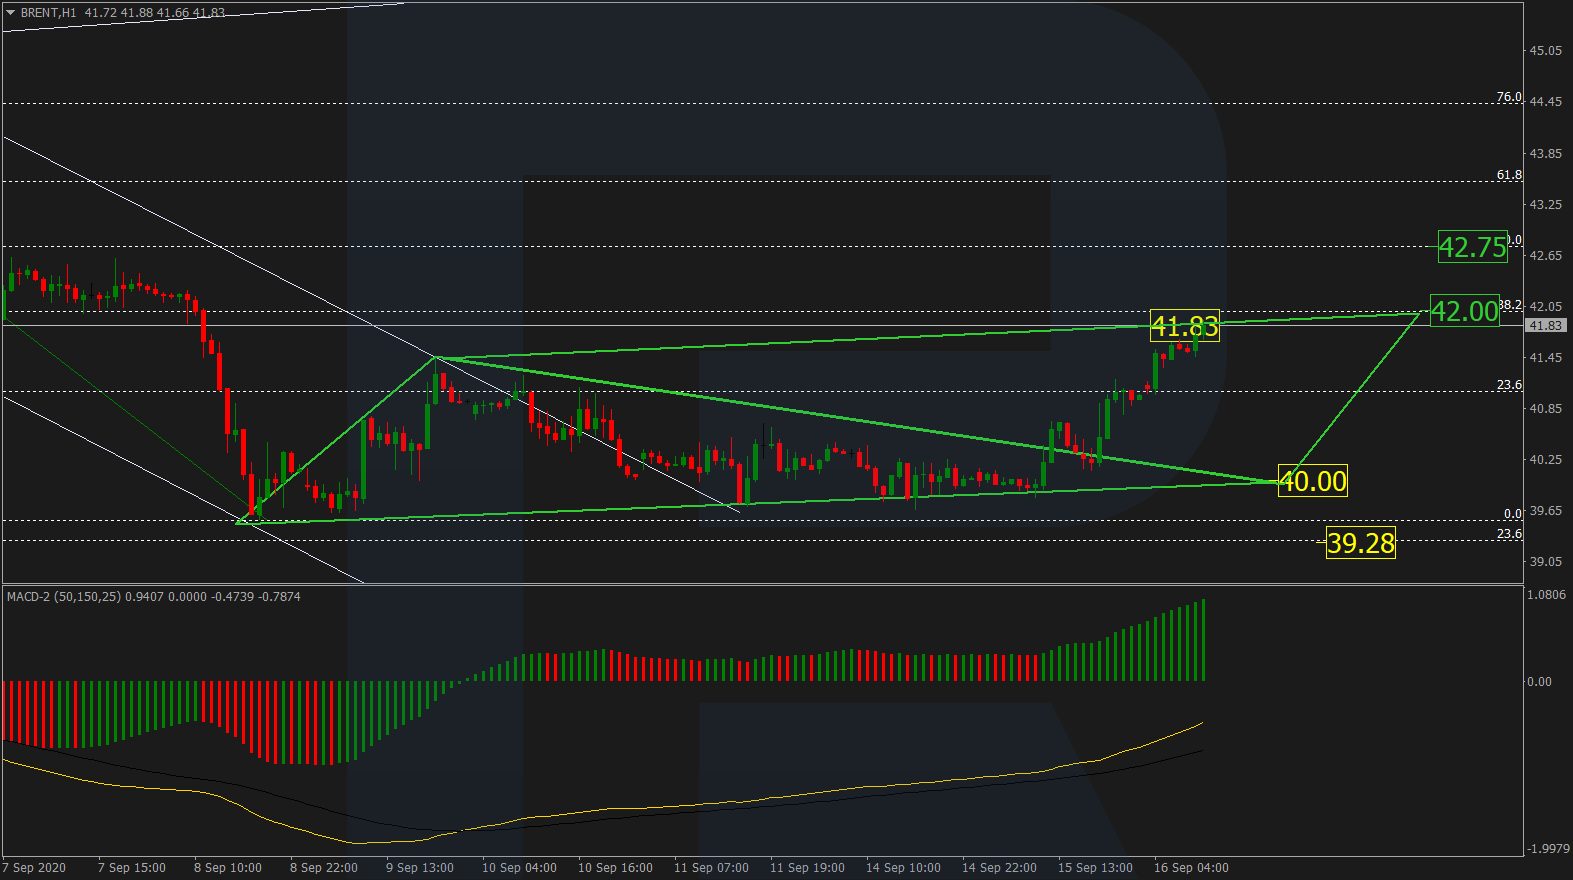
BRENT
After testing the support line and rebounding from it, Brent has broken the resistance line of a Triangle pattern; right now, it is expected to reach 41.83 and extend the correction. The upside correctional target will be 38.2% fibo at 42.00, while the key one is 50.0% fibo at 42.75. After reaching these targets, the instrument may reverse and resume falling towards the key support area at 40.00.
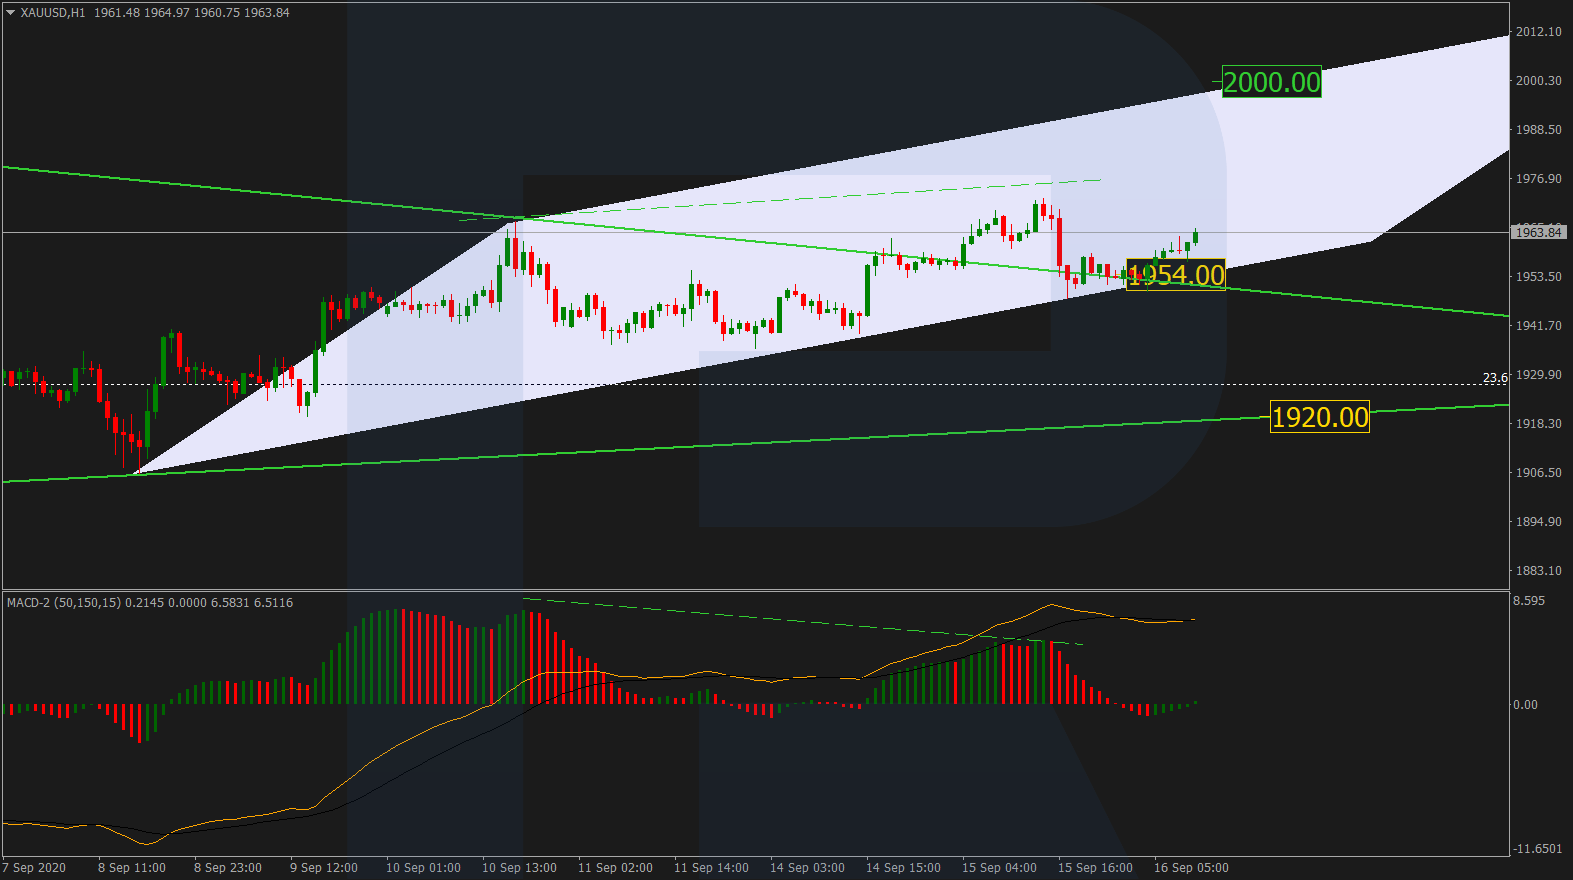
XAUUSD, “Gold vs US Dollar”
After breaking the resistance line of a mid-term Triangle pattern and updating the local high, Gold has corrected towards 1954.00. After rebounding from this level, the instrument may start a new growth to reach a psychologically-crucial level at 2000.00. However, there is a divergence on MACD, which indicates that the market may break the support area at 1954.00 and continue falling within the Triangle pattern to reach 1920.00.
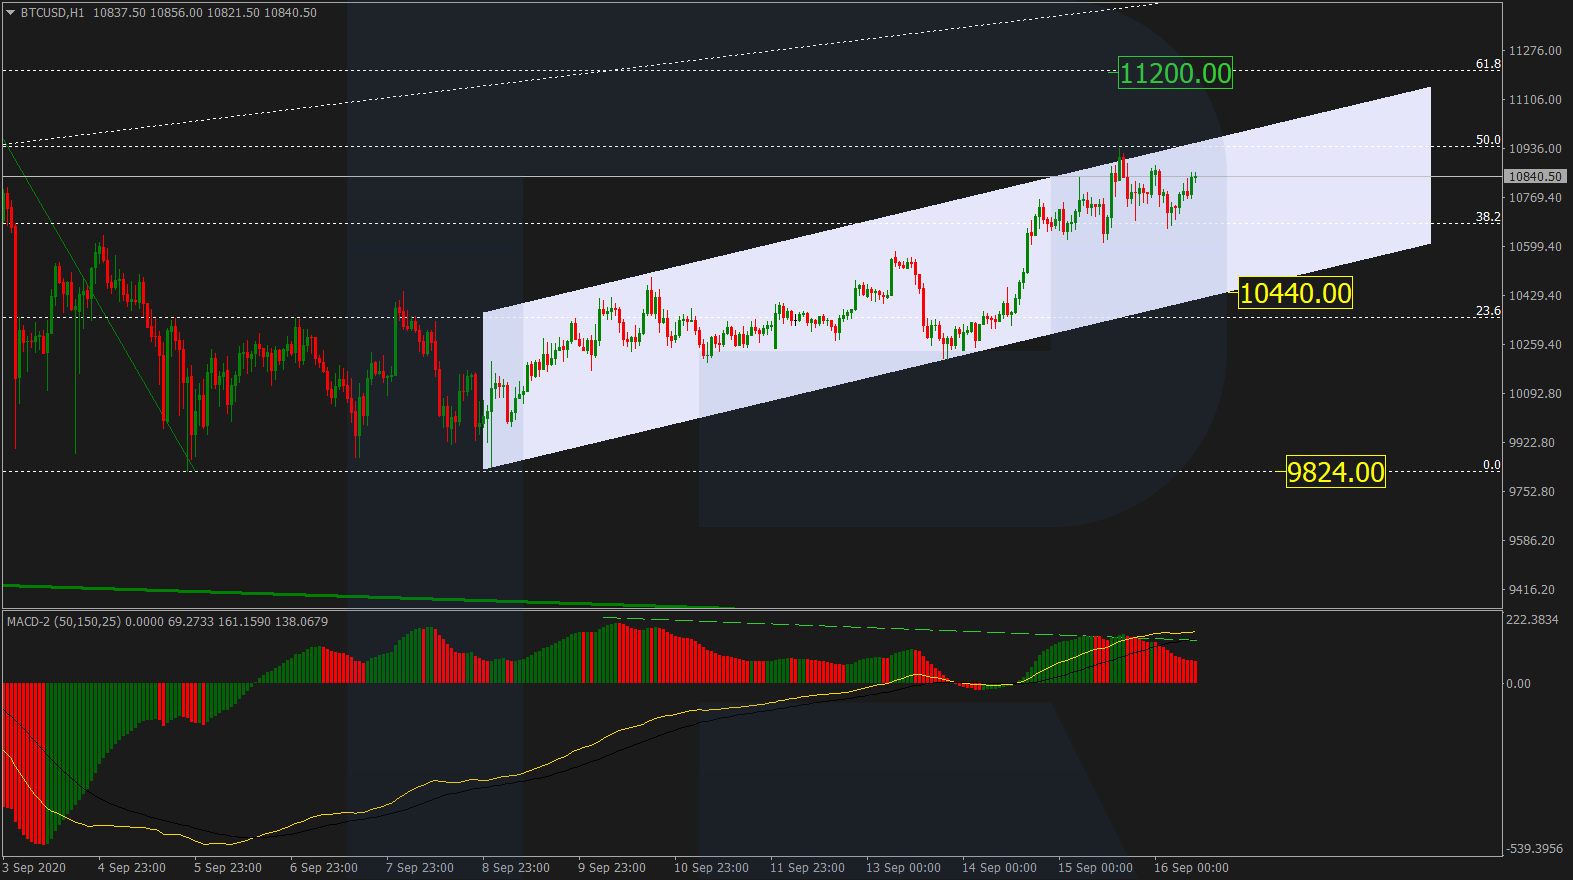
BTCUSD, “Bitcoin vs US Dollar”
BTCUSD is forming a new correctional uptrend and has already reached 50l.0% fibo. Taking into account a stable ascending tendency and the MACD indicator lines, which are directed to the upside, the instrument is expected to continue trading upwards to reach 61.8% fibo at 11200.00. After completing this growth., the market may form a new descending structure to break the support area at 10440.00 and then continue falling towards the low at 9824.00. This scenario is confirmed by divergence on MACD.
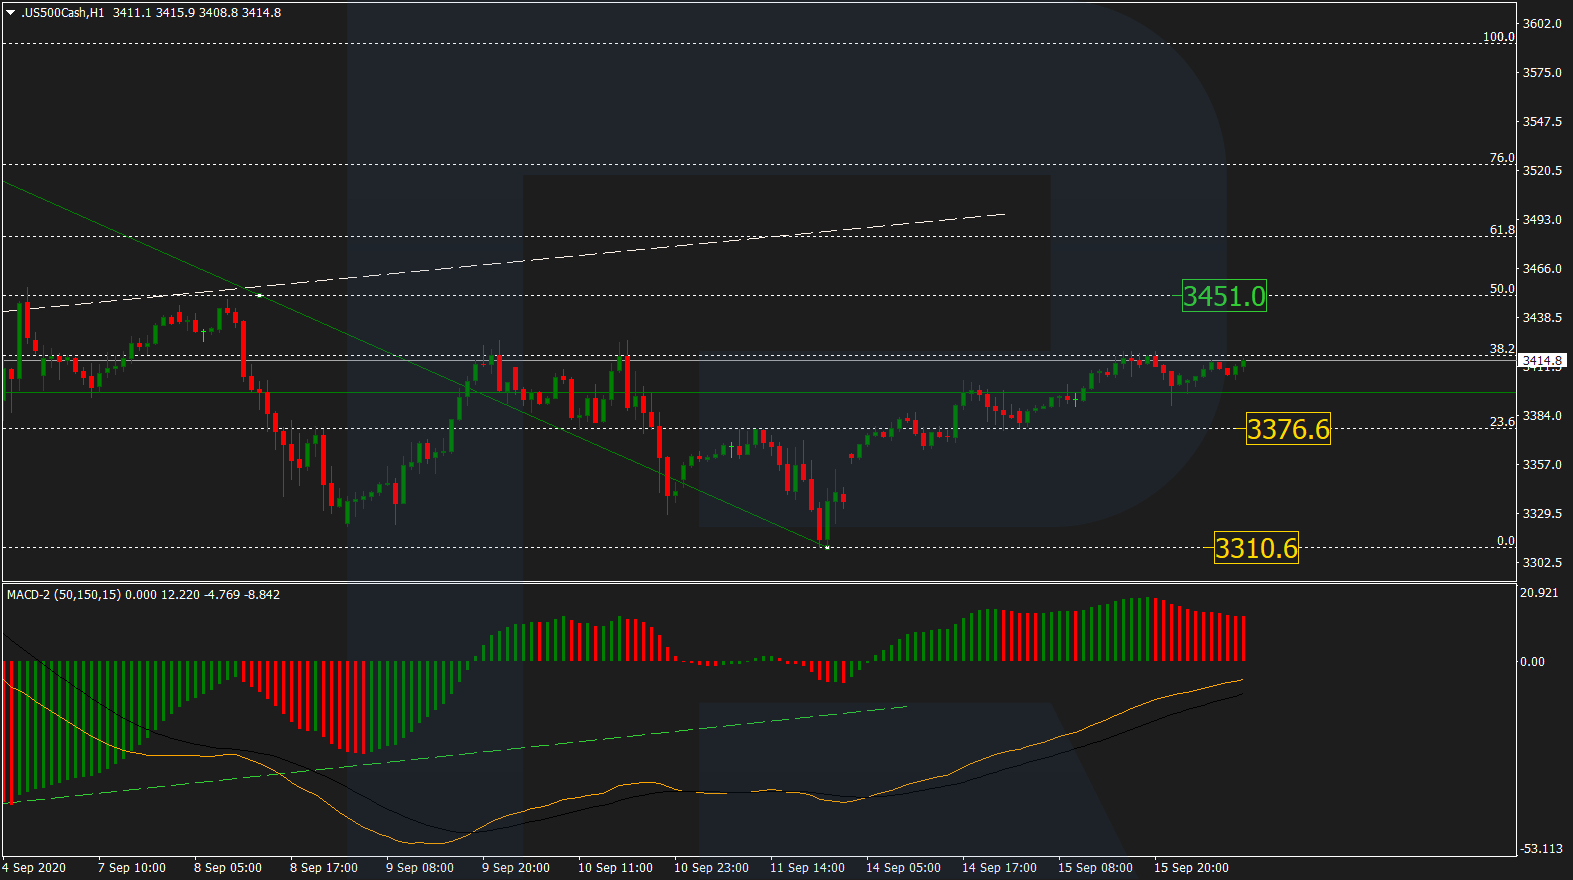
S&P 500
The S&P 500 index is moving upwards; it has already reached 38.2% fibo. In the nearest future, the pair may start a pullback towards 23.6% fibo at 3376.6. The MACD lines are directed to the upside, thus hinting at further growth with the target at 50.0% fibo (3451.0).
Article By RoboForex.com
Attention!
Forecasts presented in this section only reflect the author’s private opinion and should not be considered as guidance for trading. RoboForex LP bears no responsibility for trading results based on trading recommendations described in these analytical reviews.

- COT Metals Charts: Weekly Speculator Bets led by Copper & Steel Jul 18, 2026
- COT Bonds Charts: Weekly Speculator Bets led by 2-Year, SOFR 3M & 5-Year Bonds Jul 18, 2026
- COT Energy Charts: Weekly Speculator Bets led by Brent Oil & Heating Oil Jul 18, 2026
- COT Soft Commodities Charts: Weekly Speculator Bets led by Wheat, Corn & Soybean Meal Jul 18, 2026
- The Bank of Canada kept its interest rate unchanged. Platinum prices reached a three‑week high Jul 16, 2026
- Stock indices rose after the release of US inflation data. China’s GDP slowed sharply Jul 15, 2026
- GBP/USD Awaits Political News: What Will Happen Next Jul 15, 2026
- USD/JPY Holds at Highs: Pressure Lingers on Yen Jul 14, 2026
- Oil prices jumped 4% amid a new wave of escalation between the US and Iran Jul 13, 2026
- EUR/USD: US Inflation Will Determine Everything Jul 13, 2026