
Article By RoboForex.com
XAUUSD, “Gold vs US Dollar”
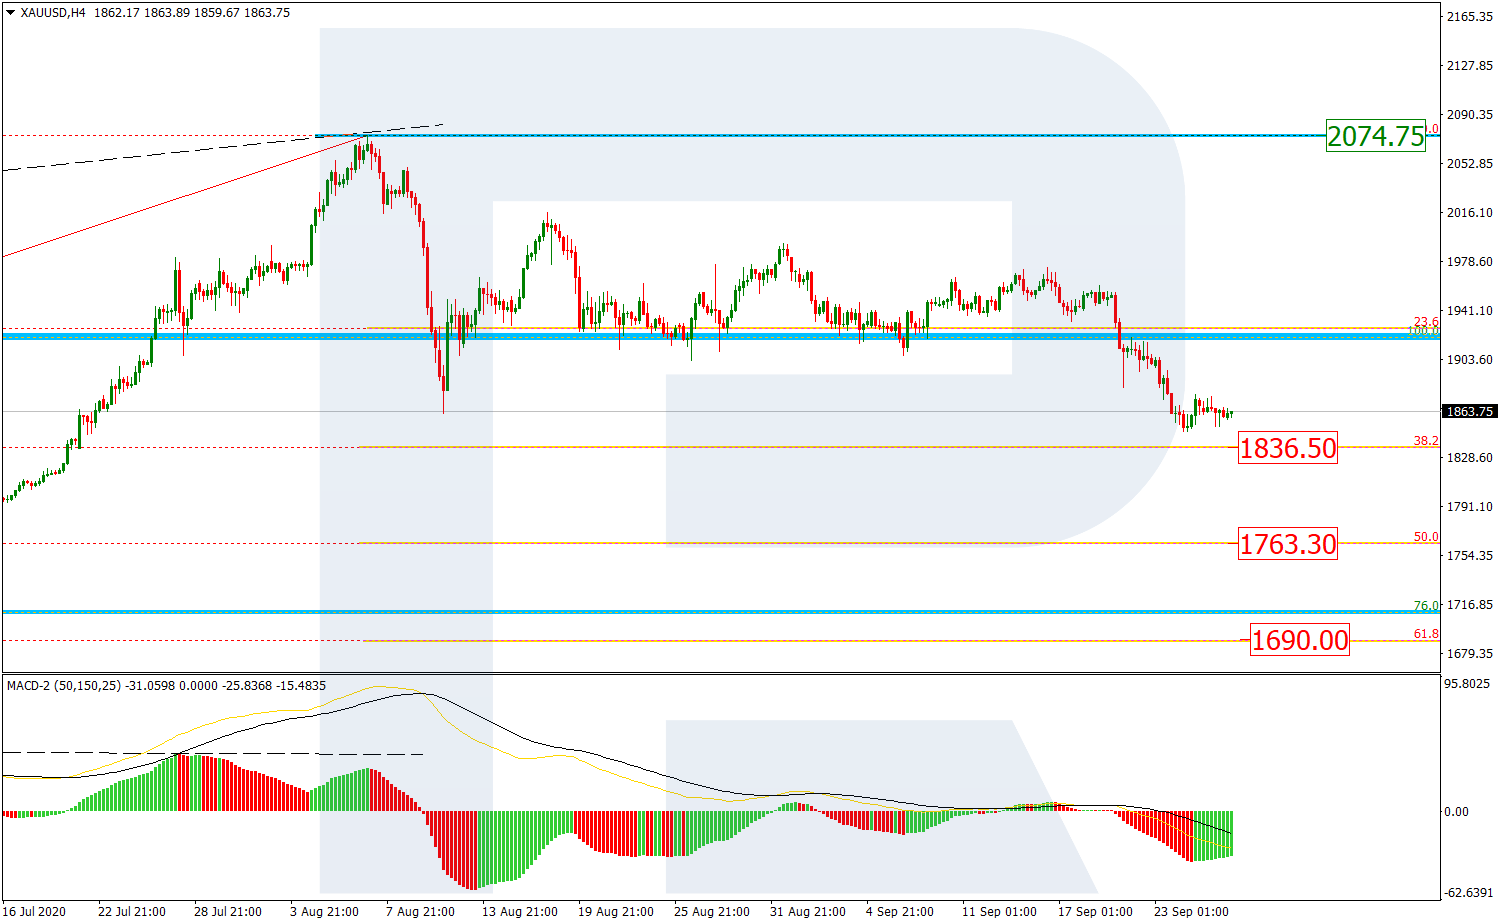
As we can see in the H4 chart, XAUUSD has finished the correction by breaking the Triangle pattern downwards; after reaching 38.2% fibo at 1836.50, the pair has failed to break it yet, which may indicate a possible local pullback. If the price breaks 38.2% fibo, it may continue falling to reach 50.0% and 61.8% fibo at 1763.30 and 1690.00 respectively. The resistance remains at the high at 2074.75.

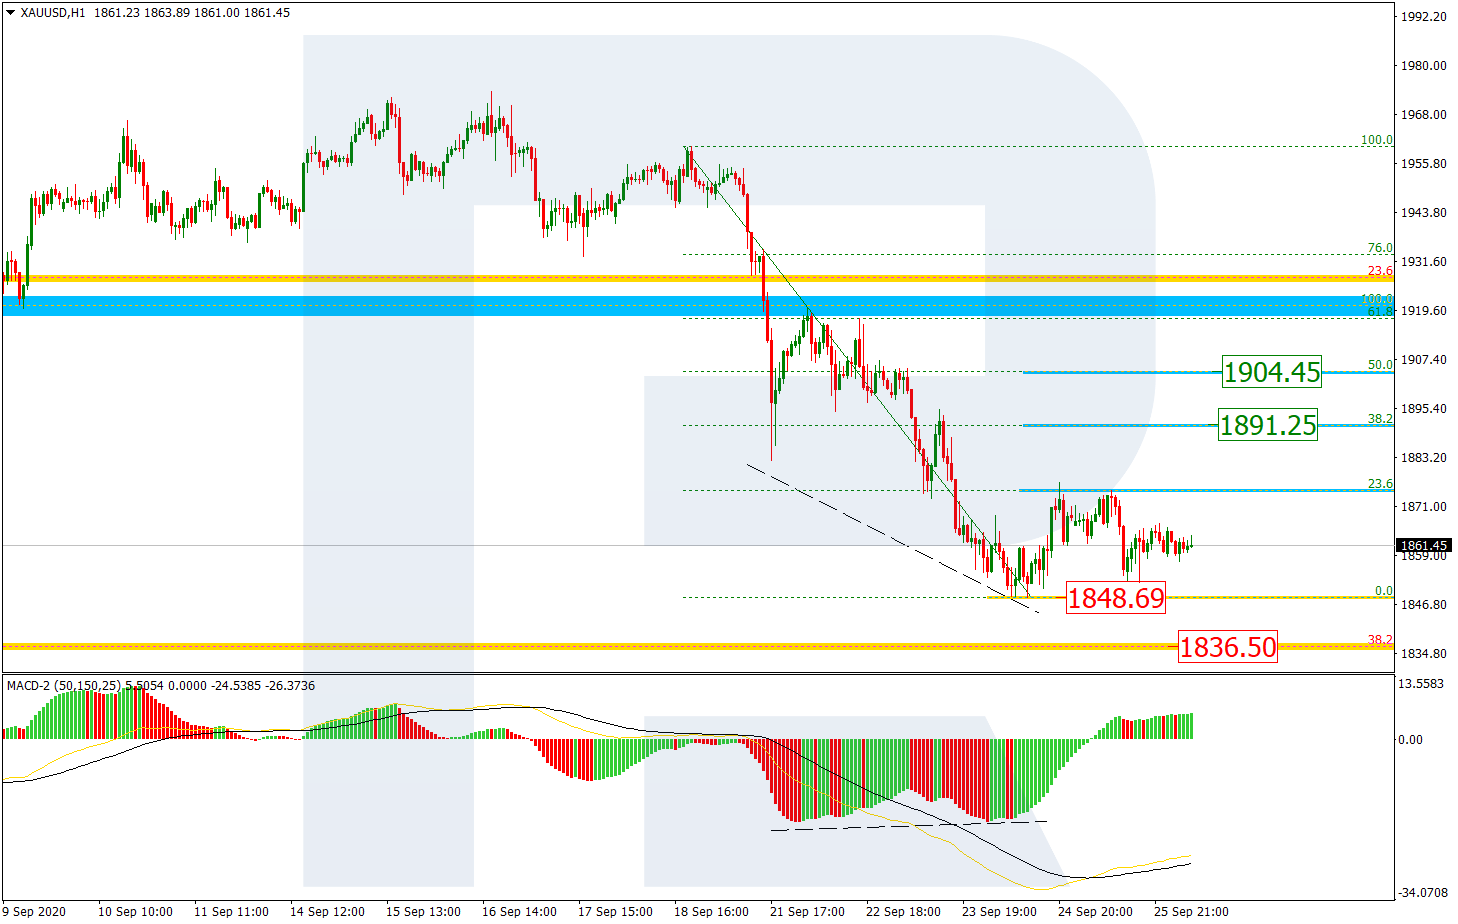
In the H1 chart, the pair is forming a short-term pullback. The local convergence made XAUUSD reach 23.6% fibo but after a rebound from the low it may resume trading upwards to reach 38.2% and 50.0% fibo at 1891.25 and 1904.45 respectively. If the asset breaks the support, which is the local low at 1848.69, the instrument may complete the pullback.
Free Reports:
 Sign Up for Our Stock Market Newsletter – Get updated on News, Charts & Rankings of Public Companies when you join our Stocks Newsletter
 Get our Weekly Commitment of Traders Reports - See where the biggest traders (Hedge Funds and Commercial Hedgers) are positioned in the futures markets on a weekly basis.
USDCHF, “US Dollar vs Swiss Franc”
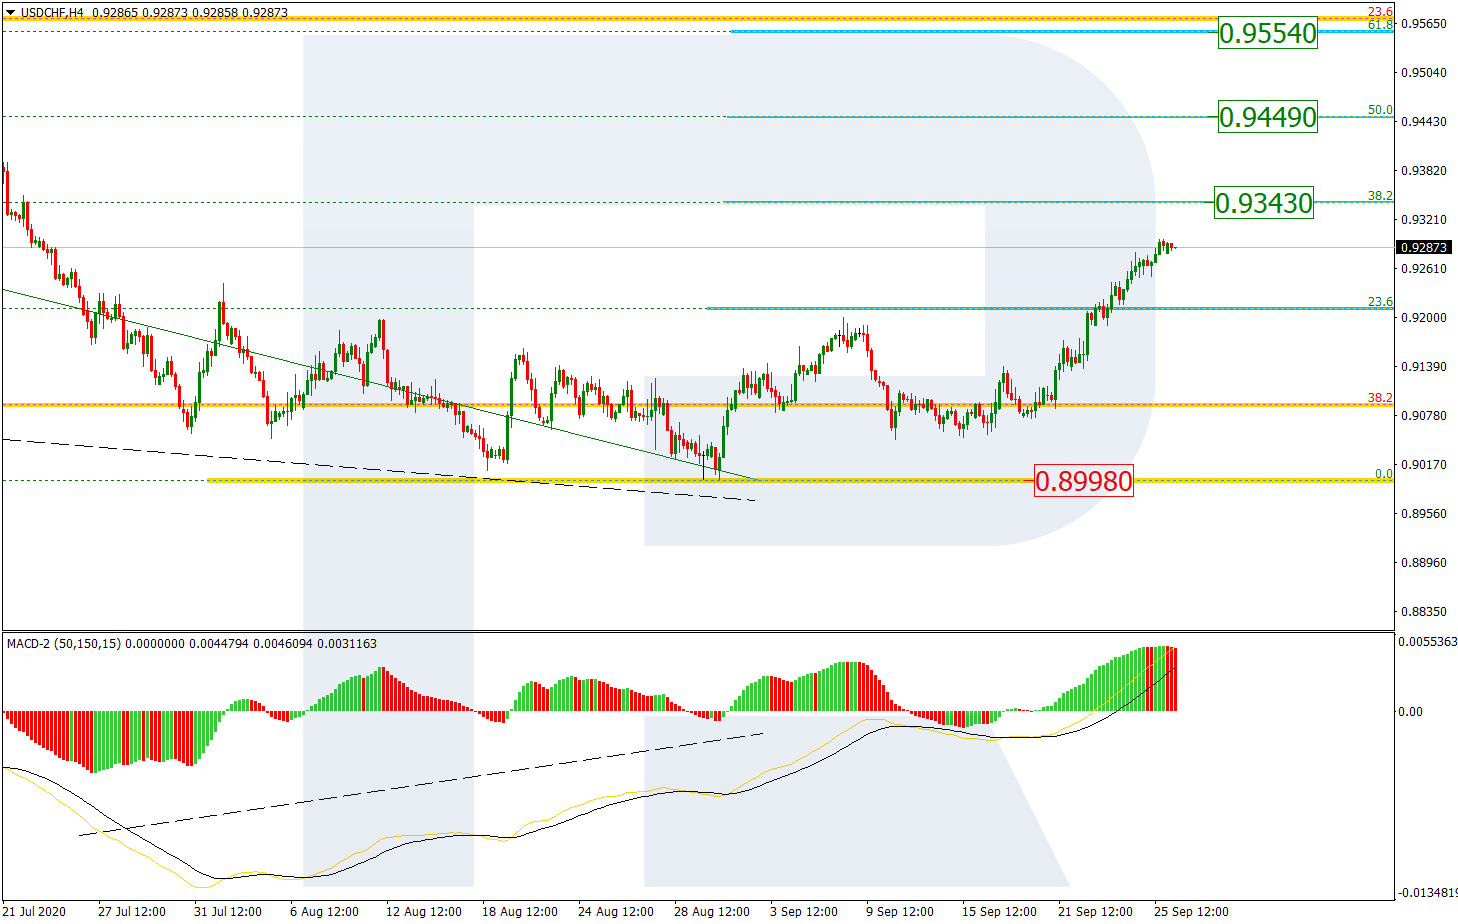
As we can see in the H4 chart, the convergence made USDCHF complete the descending wave at the long-term 38.2% fibo and start a new correction to the upside, which has already broken 23.6% fibo and may continue moving towards 38.2% fibo at 0.9343. After that, there might be a slight correction to the downside, which may be followed by further growth towards 50.0% and 61.8% fibo at 0.9449 and 0.9554 respectively. After finishing the correction, the instrument may resume falling to break the support at 0.8998 and then reach the long-term 50.0% fibo at 0.8706.
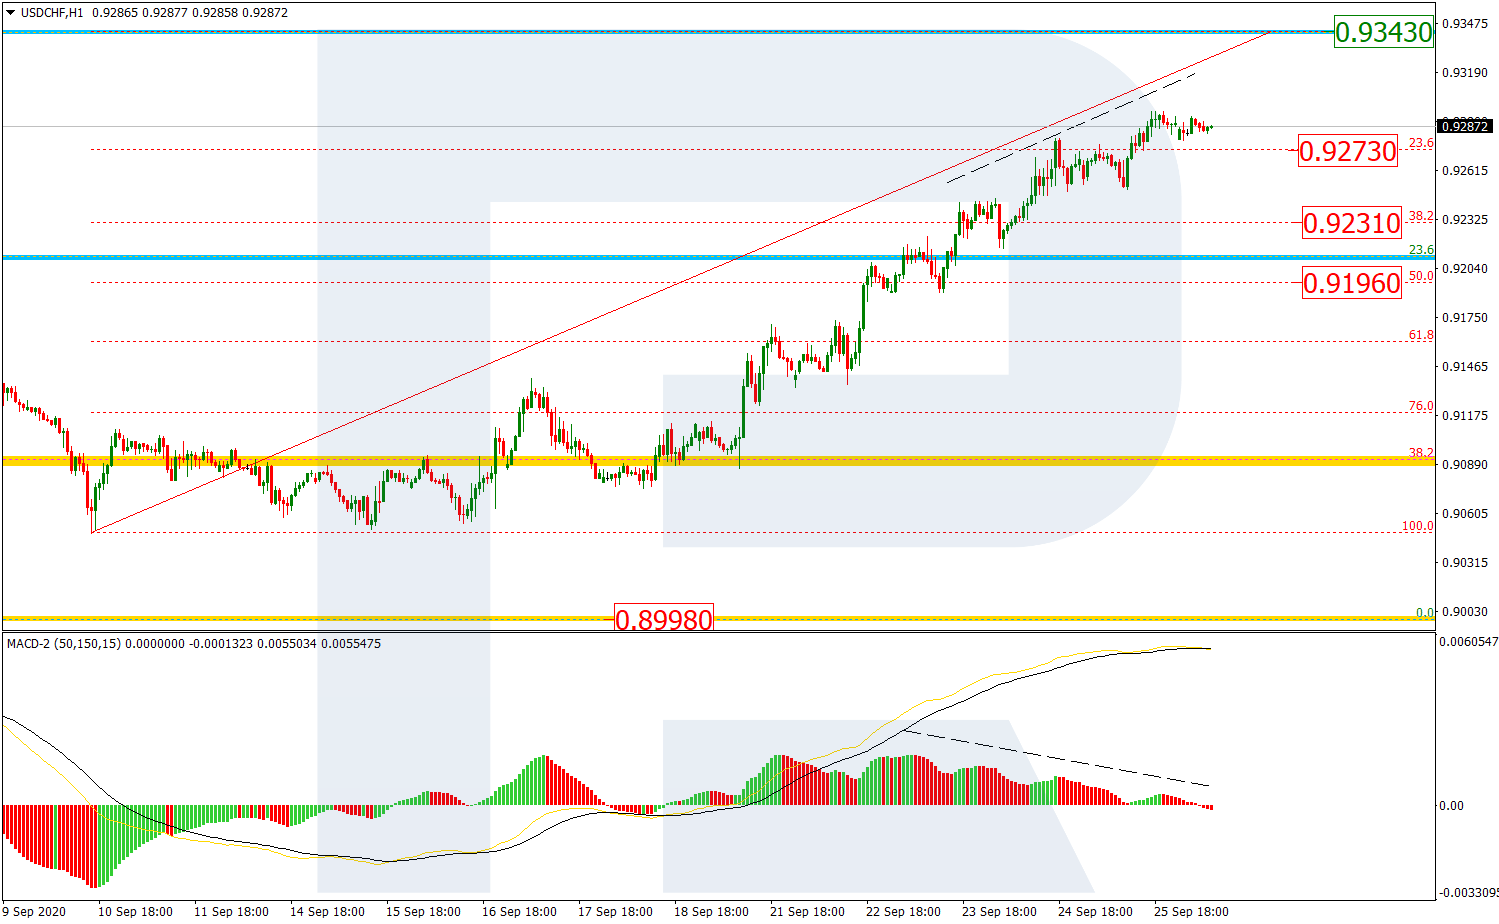
In the H1 chart, the asset is moving upwards but the MACD indicator is forming a divergence at the same time, which hints at a possible pullback after the pair reaches the target at 38.2% fibo at 0.9343; possible correctional targets are 23.6%, 38.2%, and 50.0% fibo at 0.9273, 0.9231, and 0.9196 respectively.
Article By RoboForex.com
Attention!
Forecasts presented in this section only reflect the author’s private opinion and should not be considered as guidance for trading. RoboForex LP bears no responsibility for trading results based on trading recommendations described in these analytical reviews.

- Geopolitical and macroeconomic conditions continue to pressure market sentiment Jul 20, 2026
- USD/JPY Poised to Continue Gains as Expensive Oil and Lack of Support Weigh on Yen Jul 20, 2026
- COT Metals Charts: Weekly Speculator Bets led by Copper & Steel Jul 18, 2026
- COT Bonds Charts: Weekly Speculator Bets led by 2-Year, SOFR 3M & 5-Year Bonds Jul 18, 2026
- COT Energy Charts: Weekly Speculator Bets led by Brent Oil & Heating Oil Jul 18, 2026
- COT Soft Commodities Charts: Weekly Speculator Bets led by Wheat, Corn & Soybean Meal Jul 18, 2026
- The Bank of Canada kept its interest rate unchanged. Platinum prices reached a three‑week high Jul 16, 2026
- Stock indices rose after the release of US inflation data. China’s GDP slowed sharply Jul 15, 2026
- GBP/USD Awaits Political News: What Will Happen Next Jul 15, 2026
- USD/JPY Holds at Highs: Pressure Lingers on Yen Jul 14, 2026