Fibonacci Retracements Analysis 21.06.2021 (GOLD, USDCHF)

Article By RoboForex.com

XAUUSD, “Gold vs US Dollar”

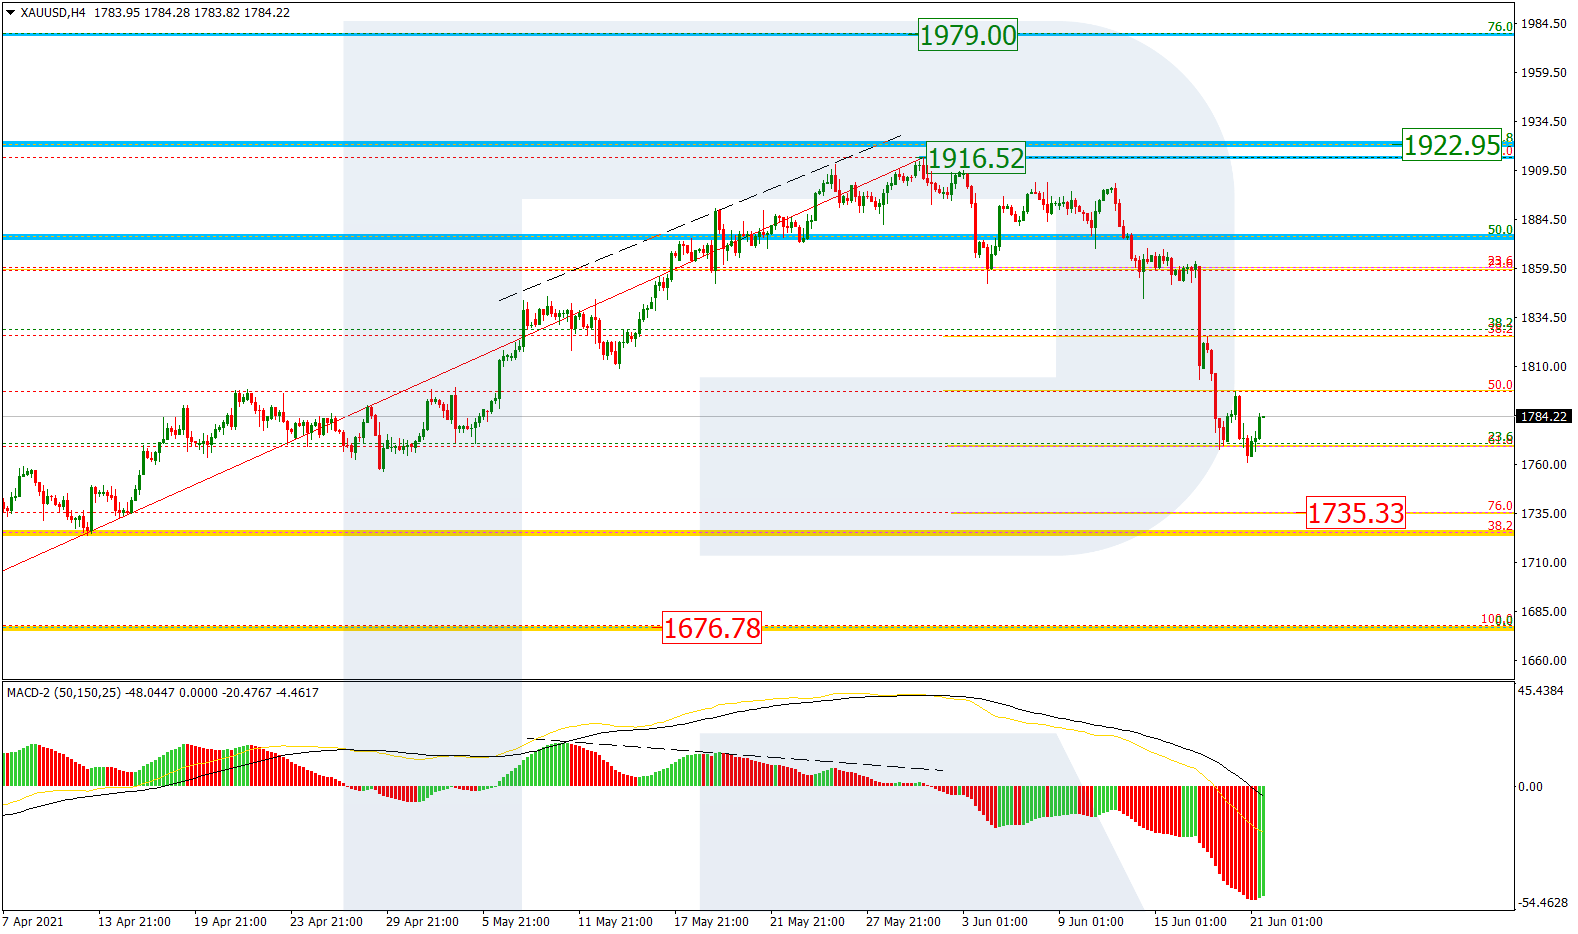
As we can see in the H4 chart, XAUUSD is forming a stable wave to the downside after a divergence on MACD, which has already reached 61.8% fibo and may later continue towards 76.0% fibo and the low at 1736.33 and 1676.78 respectively. At the same time, a breakout of the resistance at 1916.52 may lead to a further rising movement towards the mid-term targets, which are 61.8% and 76.0% fibo at 1922.95 and 1979.00 respectively.

GOLD_H4
Risk Warning: the result of previous trading operations do not guarantee the same results in the future

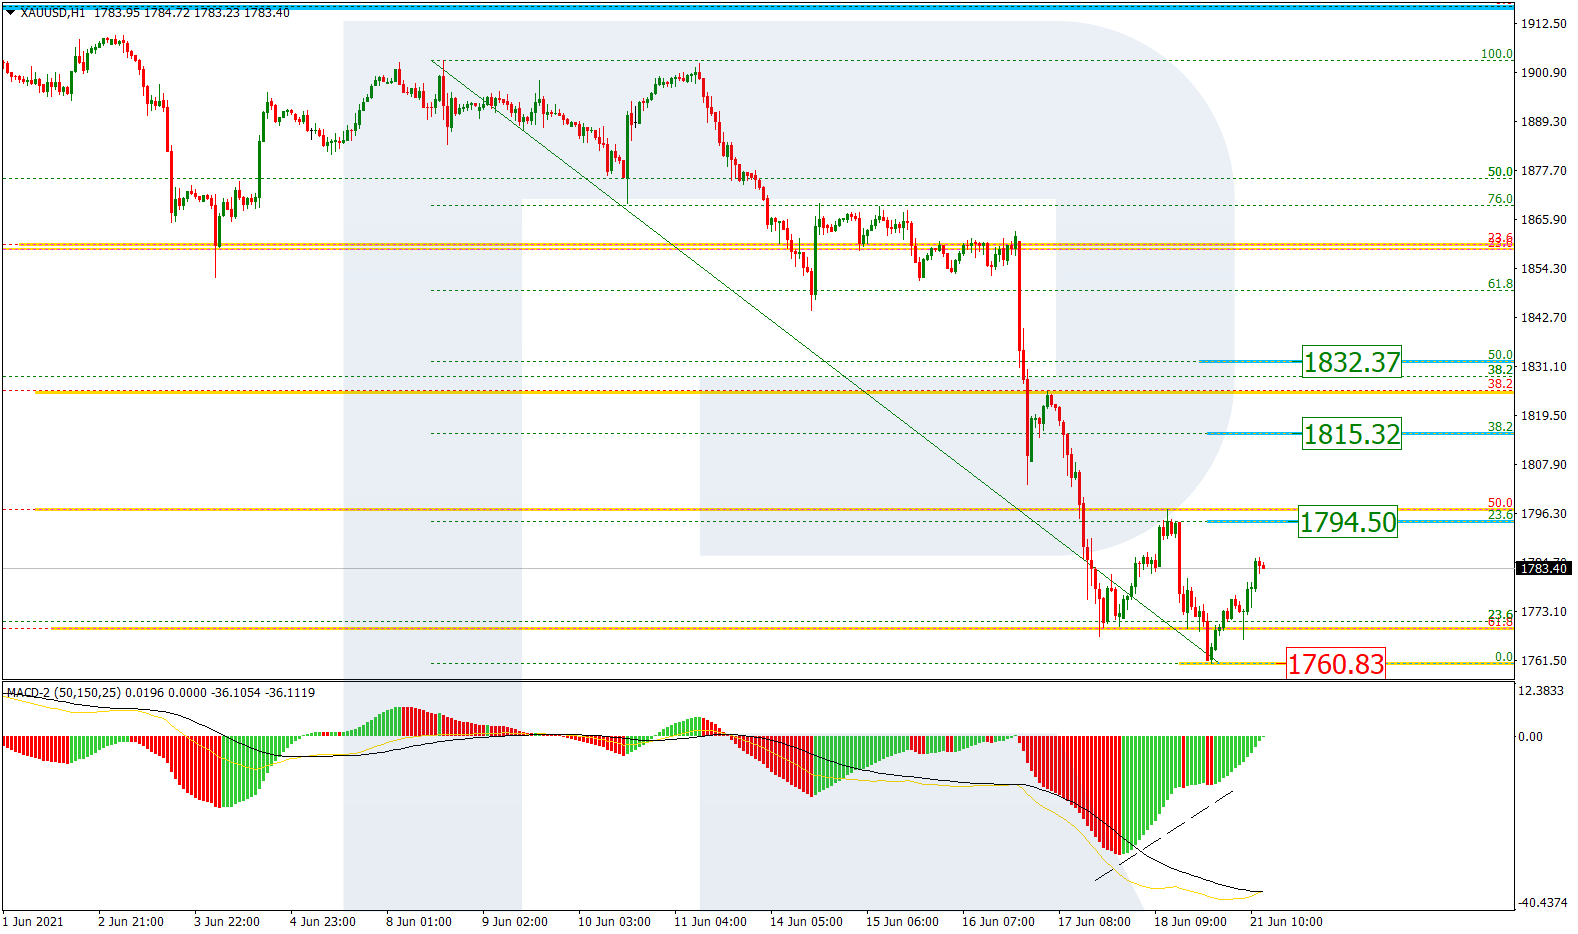
The H1 chart shows a correctional ascending wave after a convergence on MACD approaching 23.6% fibo at 1794.50, a breakout of which may lead to a further uptrend towards 38.2% and 50.0% fibo at 1815.32 and 1832.37 respectively. The support is the low at 1760.83. If the price breaks this level, the asset will complete the correction and resume trading downwards.

GOLD_H1
Risk Warning: the result of previous trading operations do not guarantee the same results in the future

USDCHF, “US Dollar vs Swiss Franc”

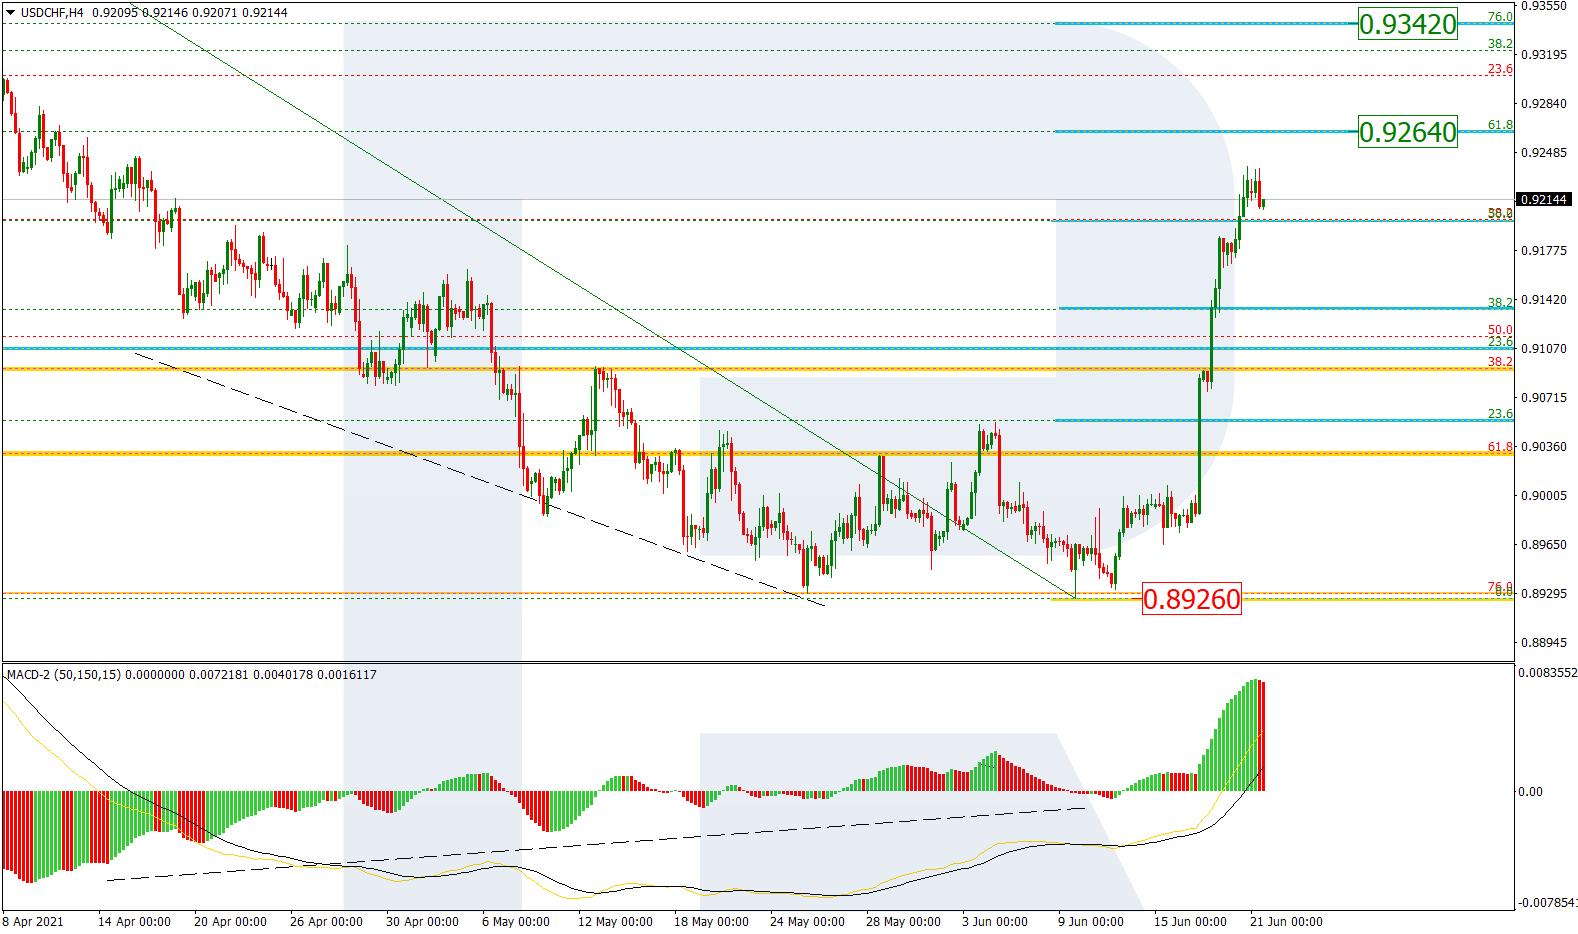
As we can see in the H4 chart, USDCHF is steadily growing after a convergence on MACD and has already broken 50.0% fibo in anticipation of a short-term correction. After this correction is over, the asset may start a new rising impulse towards 61.8% and 76.0% fibo at 0.9264 and 0.9342 respectively. The key support is the low at 0.8926.

USDCHF_H4
Risk Warning: the result of previous trading operations do not guarantee the same results in the future

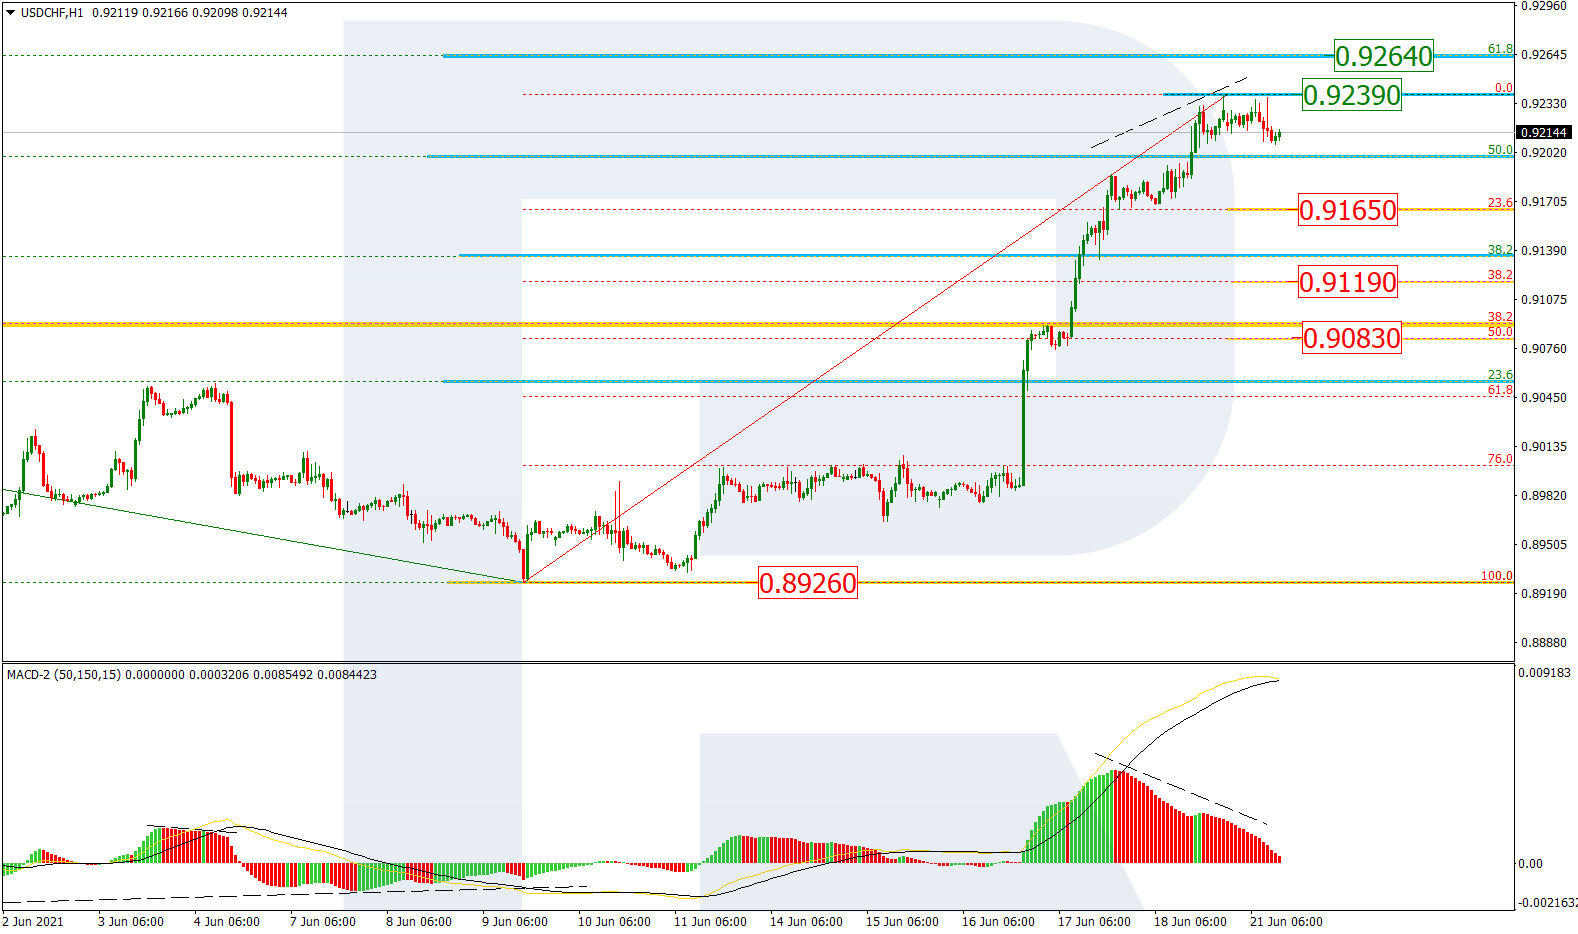
The H1 chart shows a more detailed structure of the pullback after a divergence on MACD towards 23.6%, 38.2%, and 50.0% fibo at 0.9165, 0.9119, 0.9083 respectively. The local resistance is the high at 0.9239, a breakout of which will lead to a further movement towards 61.8% fibo at 0.9264.

USDCHF_H1

Article By RoboForex.com

Attention!
Forecasts presented in this section only reflect the author’s private opinion and should not be considered as guidance for trading. RoboForex LP bears no responsibility for trading results based on trading recommendations described in these analytical reviews.

Ichimoku Cloud Analysis 21.06.2021 (GBPUSD, EURGBP, USDCHF)

Article By RoboForex.com

GBPUSD, “Great Britain Pound vs US Dollar”

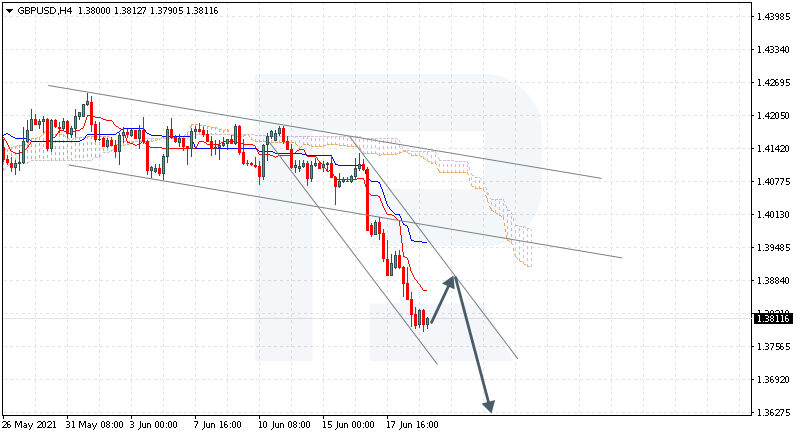
GBPUSD is trading at 1.3811; the instrument is moving below Ichimoku Cloud, thus indicating a descending tendency. The markets could indicate that the price may test Tenkan-Sen and Kijun-Sen at 1.3885 and then resume moving downwards to reach 1.3625. Another signal in favor of a further downtrend will be a rebound from the bearish channel’s upside border. However, the bearish scenario may no longer be valid if the price breaks the cloud’s upside border and fixes above 1.4075. In this case, the pair may continue growing towards 1.4165.

GBPUSD
Risk Warning: the result of previous trading operations do not guarantee the same results in the future

EURGBP, “Euro vs Great Britain Pound”

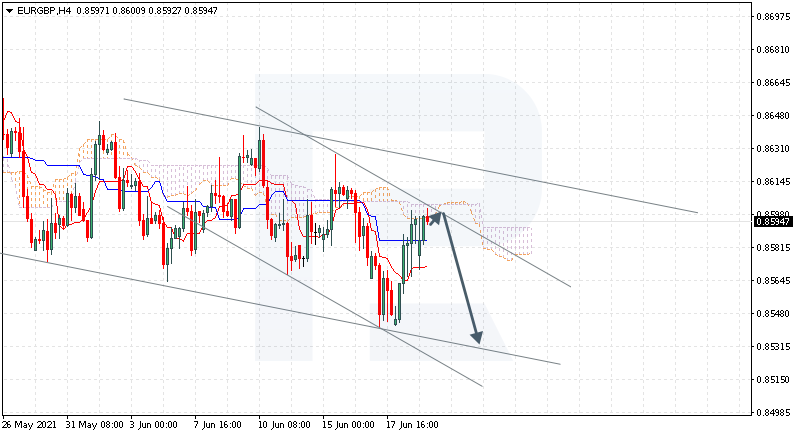
EURGBP is trading at 0.8594; the instrument is moving below Ichimoku Cloud, thus indicating a descending tendency. The markets could indicate that the price may test the cloud’s downside border at 0.8600 and then resume moving downwards to reach 0.8530. Another signal in favor of a further downtrend will be a rebound from the descending channel’s upside border. However, the bearish scenario may no longer be valid if the price breaks the cloud’s upside border and fixes above 0.8615. In this case, the pair may continue growing towards 0.8705.

EURGBP
Risk Warning: the result of previous trading operations do not guarantee the same results in the future

USDCHF, “US Dollar vs Swiss Franc”

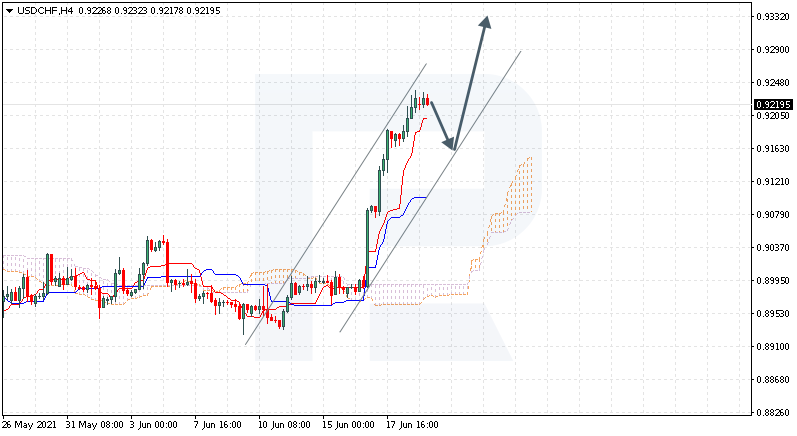
USDCHF is trading at 0.9219; the instrument is moving above Ichimoku Cloud, thus indicating an ascending tendency. The markets could indicate that the price may test Tenkan-Sen and Kijun-Sen at 0.9165 and then resume moving upwards to reach 0.9335. Another signal in favor of a further uptrend will be a rebound from the bullish channel’s downside border. However, the bullish scenario may no longer be valid if the price breaks the cloud’s downside border and fixes below 0.8995. In this case, the pair may continue falling towards 0.8905.

USDCHF

Article By RoboForex.com

Attention!
Forecasts presented in this section only reflect the author’s private opinion and should not be considered as guidance for trading. RoboForex LP bears no responsibility for trading results based on trading recommendations described in these analytical reviews.

The Analytical Overview of the Main Currency Pairs on 2021.06.21

by JustForex

The EUR/USD currency pair

Technical indicators of the currency pair:
  • Prev Open: 1.1907
  • Prev Close: 1.1863
  • % chg. over the last day: -0.37%

The EUR/USD currency pair decreased by 0.37%. Buyers’ reaction is still very weak, but now the price has approached the global support of the higher timeframe. Furthermore, the vertical volumes have decreased, indicating that the sellers are not so active anymore.

Trading recommendations
  • Support levels: 1.1835, 1.1809
  • Resistance levels: 1.1908, 1.1983, 1.2050, 1.2109, 1.2144, 1.2174, 1.2212, 1.2243

The sellers’ pressure is still higher. However, the MACD indicator is signaling the strongest divergence. Considering the deviation of the price from the moving average, it is worth expecting a corrective bounce. Traders should look for sell deals from resistance levels within the trend. It is also possible to look for buy trades, but it is better to look at intraday intervals and with short targets.

Alternative scenario: if the price breaks through the 1.2144 resistance level and fixes above, the general uptrend is likely to resume.

EUR/USD
News feed for 2021.06.21:
  • – ECB President Christine Lagarde Speaks at 17:15 (GMT+3).

The GBP/USD currency pair

Technical indicators of the currency pair:
  • Prev Open: 1.3914
  • Prev Close: 1.3792
  • % chg. over the last day: -0.88%

The British pound fell even lower on Friday. The daily support was easily broken, which means that the sellers’ pressure is strong. But now, the price has deviated very much from the moving average, so the probability of a corrective move upward is very high.

Trading recommendations
  • Support levels: 1.3801, 1.3767
  • Resistance levels: 1.3897, 1.4002, 1.4075, 1.4100, 1.4138, 1.4191

The GBP/USD trend is bearish on the H1 timeframe. At the moment, the price is trading below the moving average. The MACD indicator is oversold, with a very clear divergence. Under such market conditions, traders are better to look for the sell trades from resistance levels. But considering the strong deviation from the average line, divergence on the MACD indicator, and the presence of support of the higher timeframe, traders can also look for the buy trades from the support levels on the intraday timeframes.

Alternative scenario: if the price breaks through the 1.4138 resistance level and consolidates above, the bearish scenario is likely to be canceled.

GBP/USD
There is no news feed for today.

The USD/JPY currency pair

Technical indicators of the currency pair:
  • Prev Open: 110.18
  • Prev Close: 110.21
  • % chg. over the last day: +0.03%

The USD/JPY currency pair unexpectedly fell at the opening of the Asian session today. At the same time, the dollar index remained at the same price level. The strengthening of the Japanese yen is due to the fact that the Bank of Japan did not increase the stimulus measures but only extended the anti-crisis program on Friday. The Japanese economy is slowly but surely recovering after the pandemic.

Trading recommendations
  • Support levels: 109.83, 109.62, 109.31
  • Resistance levels: 110.08, 110.31, 110.73 110.94, 111.48

The trend is still bullish, but the price has reached the priority change level. The movement to this level was impulsive. There was no reaction from buyers, so there is a high probability that the trend of the USD/JPY currency pair may change. Now traders should wait to see if the price can break down through the support level of 109.83. In case of a breakdown, traders should look for sell trades from resistance levels. On the other hand, if there is a strong rebound, traders should open long positions from support levels.

Alternative scenario: if the price falls below 109.83, the general downtrend is likely to resume.

USD/JPY
There is no news feed for today.

The USD/CAD currency pair

Technical indicators of the currency pair:
  • Prev Open: 1.2351
  • Prev Close: 1.2461
  • % chg. over the last day: +0.89%

The USD/CAD currency pair continues to grow without significant corrections. On Friday, the price added 0.89%. Considering such a strong trend, it is necessary to buy until there is an essential reaction of sellers in the form of an impulsive move in the opposite direction.

Trading recommendations
  • Support levels: 1.2388, 1.2321, 1.2251, 1.2190, 1,2148 1.2121, 1.2096
  • Resistance levels: 1.2519

The trend is strictly bullish. But the price has strongly deviated from the moving average. The MACD indicator is in the overbought zone, and there are first signs of the beginning of correction in the form of divergence. Now buyers should open positions from the support levels on the lower timeframes. There are no optimal entry points for sell positions yet.

Alternative scenario: if the price breaks down through the 1.2121 support level and fixes below, the downtrend is likely to be resumed.

USD/CAD
There is no news feed for today.

by JustForex


This article reflects a personal opinion and should not be interpreted as an investment advice, and/or offer, and/or a persistent request for carrying out financial transactions, and/or a guarantee, and/or a forecast of future events.

EURUSD Impulse Structure Hints At Rising Prices

By Orbex

EURUSD

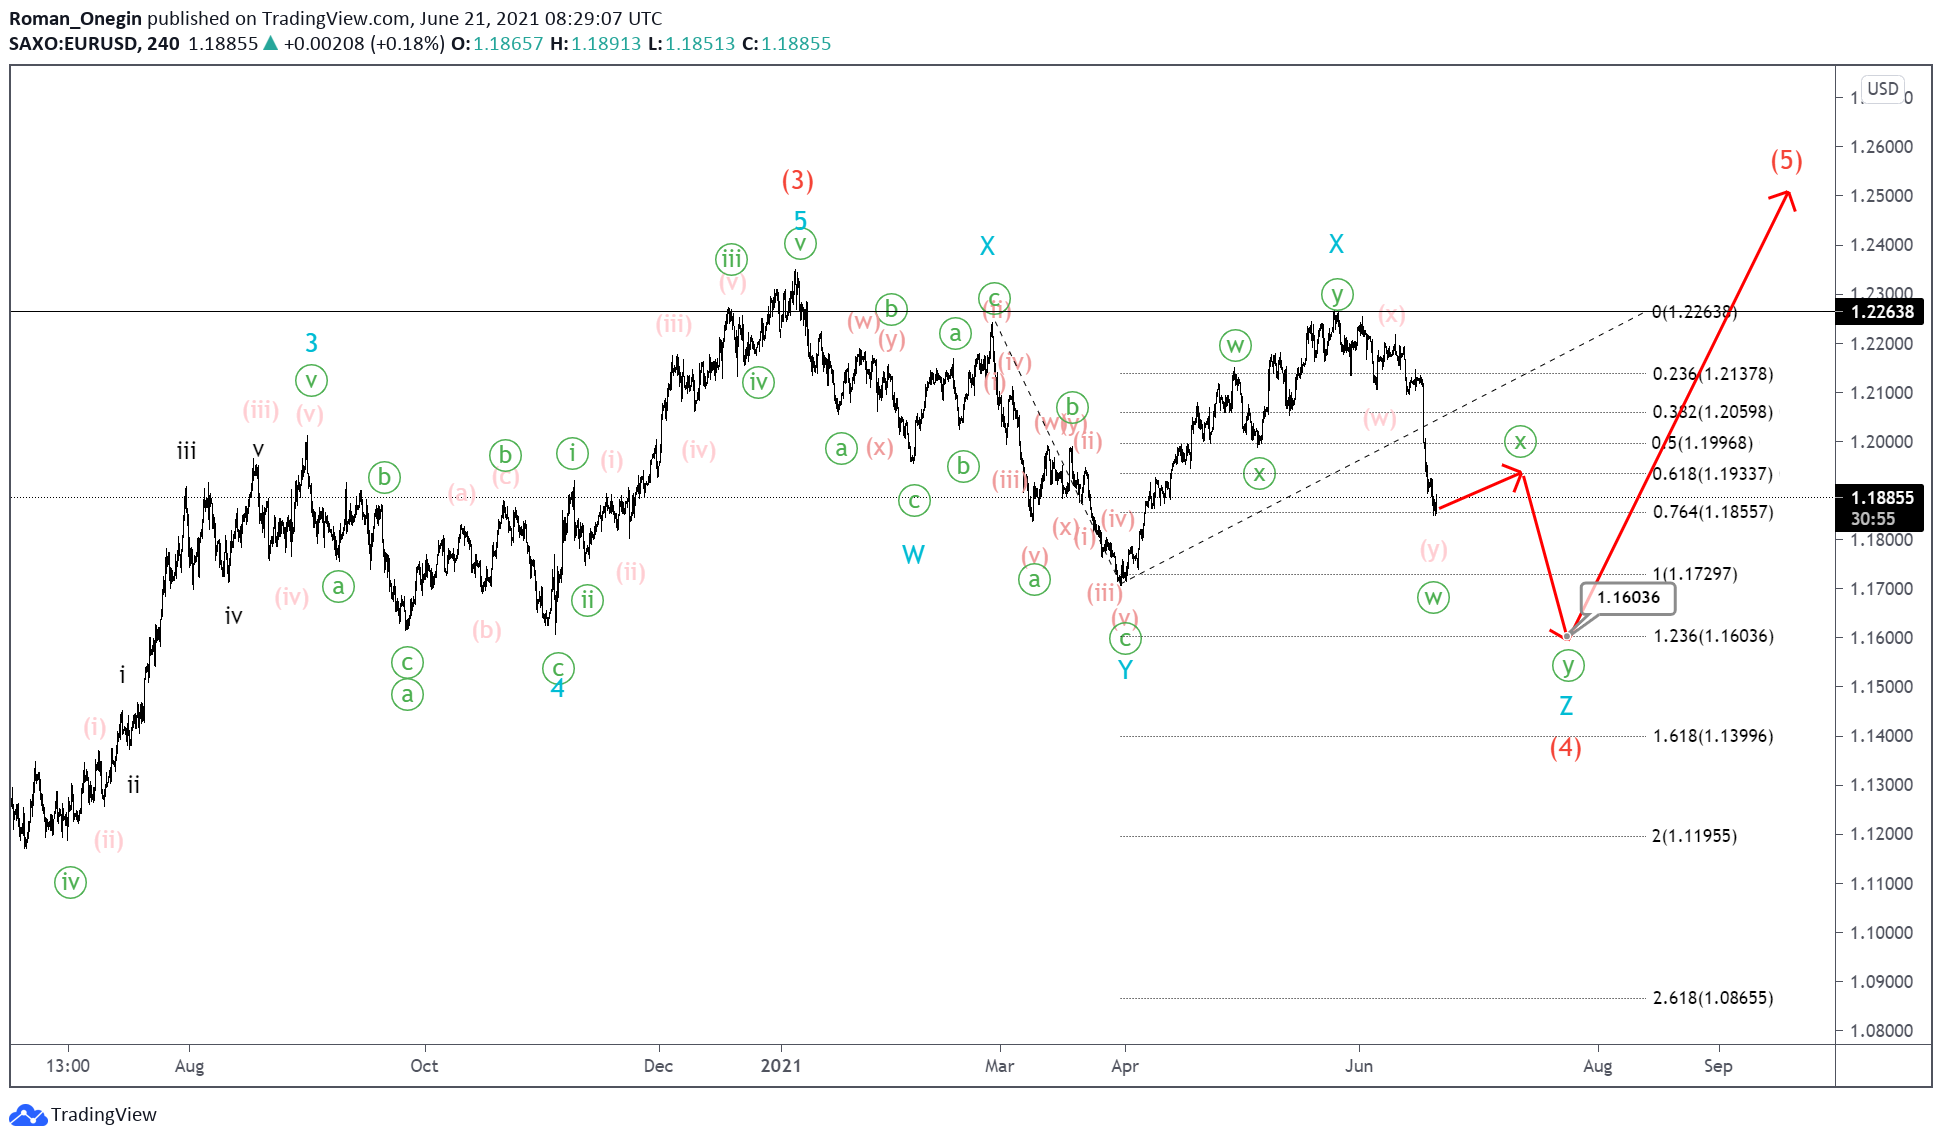
The current formation of the EURUSD currency pair suggests the development of a global bullish impulse. This consists of intermediate sub-waves (1)-(2)-(3)-(4)-(5).

The bearish correction wave (4) seems to have just been completed, as it has taken the form of a double zigzag W-X-Y.

Then the construction of the initial part of the intermediate fifth wave began.

Currently, the market has completed the minor wave 1 in the form of a simple impulse. Additionally, experts believe that the bearish minor wave 2, which is a double zigzag of the minute degree, has most likely come to an end.

Perhaps, in the near future, we will see an impulse growth within the minor wave 3 to 1.2536. At that level, wave 3 will be at 123.6% of wave 1.

EURUSD

The alternative scenario hints at the continuation of the development of the intermediate correction (4). Indeed, it may take the form of a triple zigzag W-X-Y-X-Z, rather than a double one.

Thus, at the time of writing, the first four parts of this pattern look fully completed, and the construction of the final actionary wave Z is at the initial stage.

Perhaps the minor wave Z will take the form of a minute double zigzag, as shown in the chart. We can expect it to end near 1.1603. At that level, wave Z will be at 123.6% of wave Y.

Moving forward, after the correction (4) is fully completed, the intermediate impulse wave (5) can send the market well above the high of 1.2263.

By Orbex

Global financial markets are still affected by Fed’s forecasts

by JustForex

The US stock market closed in the red zone on Friday. The S&P 500 index decreased by 1.31%, the NASDAQ lost 0.94%, and the Dow Jones fell by 1.58%. Over the weekend, James Ballard, the head of St. Louis Federal Reserve Bank (FRB), told CNBC that the Fed could raise its key rate as early as the end of 2022. Many investors fear that if the Fed starts to tighten policy sooner, further economic growth could be limited. But as long as monetary policy remains unchanged, indexes are expected to rise further until August. At the moment, the biggest attention of traders is concentrated on the NASDAQ index, which is behaving more confidently.

European stock indices also closed with a decline on Friday. The German DAX lost 1.78%, it’s the biggest daily decline in the last 2 months. The British FTSE 100 also fell to its monthly low, decreasing by 1.9%. Regional elections were held in France on the weekend. The voter turnout was extremely low. According to exit polls, the party of incumbent French President Emmanuel Macron took only 5th place.

Oil is rising again after falling on Thursday. Iran held governor elections last week, where the current president Hassan Rouhani lost his seat to Ibrahim Raisi, who is a supporter of harsh criticism of the West, and in particular, the United States. Raisi will take office in early August. The nuclear deal is under the threat of a breakdown, but Rouhani is trying his best to reopen negotiations and finalize the deal before leaving office.

As US Treasury yields stopped rising, the plunge in gold and silver came to a halt. Experts believe that the rise in yields was temporary and triggered by excess dollar liquidity, Treasury bond yields will fall, so gold, as the contrary instrument, will rise. Thus, there are good buying opportunities for investors now.

Asian stock markets are also falling. Japan’s Nikkei is down 3.3%, falling below 28,000 for the first time in a month. Australia’s ASX200 is down 1.81% in today’s trading session. The situation in the Asian market is now highly dependent on the movement of US indices. The People’s Bank of China kept the benchmark annual interest rate unchanged at 3.85%.

Main market quotes:

S&P 500 (F) 4,166.45 -55.41 (-1.31%)

Dow Jones 33,290.08 -533.37 (-1.58%)

DAX 15,448.04 -279.63 (-1.78%)

FTSE 100 7,017.47 -135.96 (-1.90%)

USD Index 92.32 +0.43 (+0.47%)

Important events:
  • – Australia Retail Sales (m/m) at 04:30 (GMT+3);
  • – China PBoC Loan Prime Rate at 04:30 (GMT+3);
  • – ECB President Christine Lagarde Speaks at 17:15 (GMT+3).

by JustForex


This article reflects a personal opinion and should not be interpreted as an investment advice, and/or offer, and/or a persistent request for carrying out financial transactions, and/or a guarantee, and/or a forecast of future events.

The strength of the dollar impacts the commodity market

By Admiral Markets

As we discussed last week, Jerome Powell rekindled rumours of a possible tapering during his press conference after the meeting of last Fed meeting, and this has been reflected in the financial markets as the US dollar has experienced a strong rebound in recent sessions, generating sharp declines in the EURUSD and GBPUSD, and a strong rebound in the dollar index which strongly bounced from the 90.00 USD to 92.50 USD, surpassing its average of 200 sessions.

Last April, we commented that the weakness of the dollar drove commodities. As the main beneficiary of this former situation, gold has been among those hit the most, with an upward structure after confirming the formation of a triple ground in the red at the end of last March, where a new upward momentum began that led it to break up the bearish channel that had been following since its historical highs.

This break caused a triple cross of bullish averages that supported gold in its new trend in search of its main resistance level represented by the green band, although after the latest events due to the increase in inflation in the United States, gold has turned strongly to the 61.8% Fibonacci retracement level after breaking several support levels.

It is vitally important that gold manages to maintain this level of support if it wants to continue with the rises as a loss of this level could bring the price back to the area of annual lows in the lower red band, thus losing everything gained with this latest upward momentum.
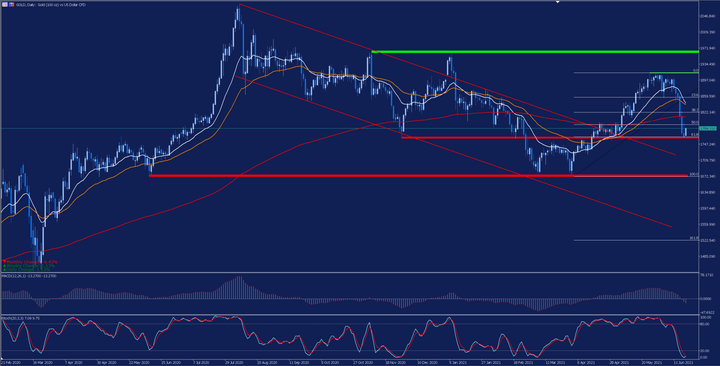
Source: Admiral Markets MetaTrader 5. Gold’s daily chart. Data range: February 21, 2020 to June 21, 2021. Prepared on June 21, 2021 at 12:00 pm CEST. Please note that past returns do not guarantee future returns.

Evolution in the last 5 years:

  • 2020: 21,86%
  • 2019: 15,45%
  • 2018: -3,22%
  • 2017: 12,75%
  • 2016: 10,12%

In the case of Brent, against the strength of the dollar, it managed to close last week with a rise of 1.13%. This can be explained by positive future prospects around this important raw material thanks to the improvement of the pandemic situation at the global level, and the reopening of economies due to the advanced vaccination process. In addition, these prospects were reinforced after OPEC published an optimistic report regarding its future expectations for 2022, in which it is forecast to have a strong rebound in consumption with a possible increase in production of 1.4 million barrels per day by each member of the group.

Technically speaking, so far this month it has scored 6% to recover at times the 75 USD per barrel. Currently, the price is struggling with its main resistance so we will have to be attentive to the evolution of the price and see if it is able to maintain its current support levels.
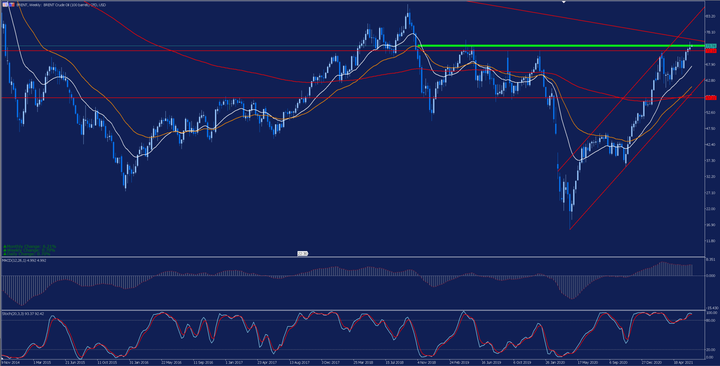
Source: Admiral Markets MetaTrader 5. Weekly brent chart. Data range: November 9, 2014 to June 21, 2021. Prepared on June 21, 2021 at 12:05 pm CEST. Please note that past returns do not guarantee future returns.

Evolution in the last 5 years:

  • 2020: -21,52%
  • 2019: 22,68%
  • 2018: -19,55%
  • 2017: 17,69%
  • 2016: 52,41%

In addition, with Admirals’ Trade.MT5 account, you can trade Gold, Brent and many more instruments. CFDs allow traders to try to benefit from the upside and bear markets as well as the use of leverage. Click on the banner below to open an account today:

With the Admirals Trade.MT5 account, you can trade Contracts for Differences (CFDs) of Microsoft and more than 3000 stocks! CFDs allow traders to try to profit from the bull and bear markets, as well as the use of leverage. Click on the following banner to open an account today:

Trade With MetaTrader 5

INFORMATION ABOUT ANALYTICAL MATERIALS:

The given data provides additional information regarding all analysis, estimates, prognosis, forecasts, market reviews, weekly outlooks or other similar assessments or information (hereinafter “Analysis”) published on the websites of Admiral Markets investment firms operating under the Admiral Markets trademark (hereinafter “Admiral Markets”) Before making any investment decisions please pay close attention to the following:

  1. This is a marketing communication. The content is published for informative purposes only and is in no way to be construed as investment advice or recommendation. It has not been prepared in accordance with legal requirements designed to promote the independence of investment research, and that it is not subject to any prohibition on dealing ahead of the dissemination of investment research.
  2. Any investment decision is made by each client alone whereas Admiral Markets shall not be responsible for any loss or damage arising from any such decision, whether or not based on the content.
  3. With view to protecting the interests of our clients and the objectivity of the Analysis, Admiral Markets has established relevant internal procedures for prevention and management of conflicts of interest.
  4. The Analysis is prepared by an independent analyst, Roberto Rojas (analyst), (hereinafter “Author”) based on their personal estimations.
  5. Whilst every reasonable effort is taken to ensure that all sources of the content are reliable and that all information is presented, as much as possible, in an understandable, timely, precise and complete manner, Admiral Markets does not guarantee the accuracy or completeness of any information contained within the Analysis.
  6. Any kind of past or modeled performance of financial instruments indicated within the content should not be construed as an express or implied promise, guarantee or implication by Admiral Markets for any future performance. The value of the financial instrument may both increase and decrease and the preservation of the asset value is not guaranteed.

Leveraged products (including contracts for difference) are speculative in nature and may result in losses or profit. Before you start trading, please ensure that you fully understand the risks involved.

By Admiral Markets

Intraday Market Analysis – USD Consolidates Gains

By Orbex

USDJPY tests first support

USDJPY

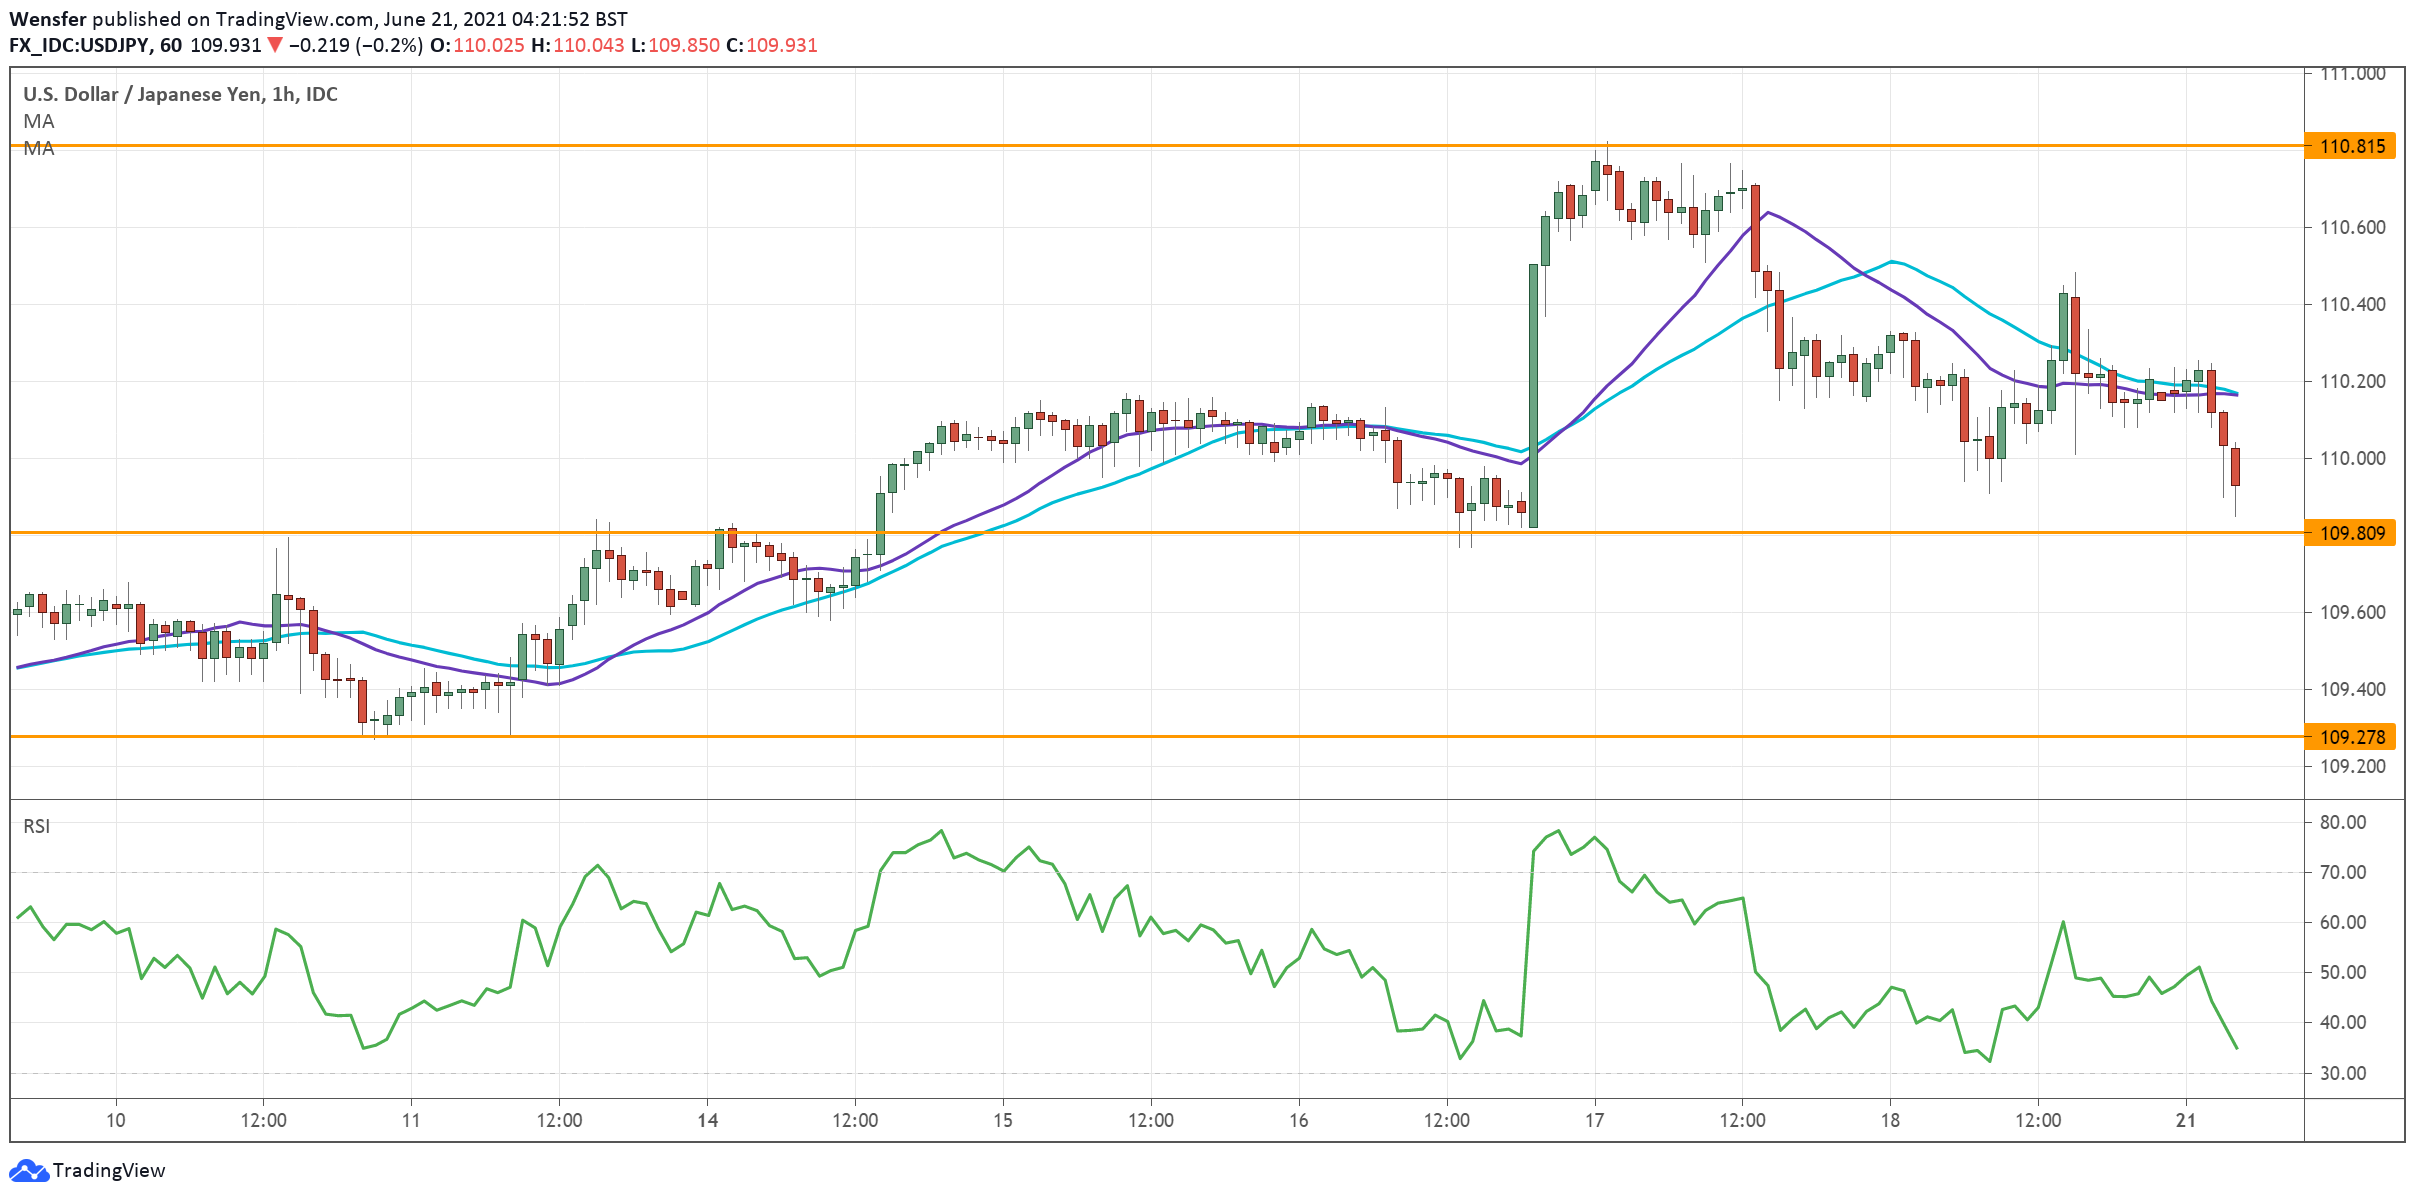
The Japanese yen remains under pressure as the BoJ extends the easing program.

The US dollar has met strong resistance at last April’s high at 110.80. The price action then found bids near 110.20, a former resistance turned into a support.

Sentiment remains positive as long as buyers hold above 109.80.

The RSI is rising back from a sub-40 level, leaving room for a potential rebound. A break above said resistance may resume the five-month-long rally and push the price to March 2020’s high at 111.70.

EURGBP attempts bullish reversal

EURGBP

The pound retreated after some disappointing UK retail sales figures in May.

The surge above the immediate resistance at 0.8570 is a sign of profit-taking from the short side. Now that 0.8540 has established itself as a support, price action will need to consolidate its gains, before a reversal could materialize.

The bullish MA cross may attract buying interest, though a high RSI could briefly temper the bullish fever.

A break above 0.8610 would prompt more sellers to cover and extend the rally to 0.8640.

GER 30 plunges towards daily support

DAX

The DAX 30 tumbles as investors rebalance their portfolios post-FOMC.

The index had struggled to hold onto the record high of 15800. The sharp sell-off below the support at 15550 is a sign that buyers are bailing out.

Stop-losses from leveraged trades compound to the downward momentum. The RSI shows an oversold situation.

From a medium-term’s perspective, the uptrend is still intact and the correction may attract bargain hunters above 15100. 15480 has become the immediate resistance level.

By Orbex

Key events this week: Another hawkish surprise?

By Han Tan Market Analyst, ForexTime

Last week, the Fed delivered a hawkish surprise by indicating two US interest rate hikes in 2023, with the tapering of its asset purchases potentially happening much sooner than expected. This change in tone sheds new light on the major economic data and events due in the coming days, especially the scheduled speeches by Fed officials:

Monday, June 21

  • Fed speak: St. Louis Fed President James Bullard, Dallas Fed President Robert Kaplan, New York Fed President John Williams
  • ECB President Christine Lagarde speech

Tuesday, June 22

  • Fed Chair Jerome Powell testimony before US House subcommittee
  • Fed speak: San Francisco Fed President Mary Daly, Cleveland Fed President Loretta Mester
  • Eurozone consumer confidence

Wednesday, June 23

  • Fed speak: Fed Governor Michelle Bowman, Atlanta Fed President Raphael Bostic, Boston Fed President Eric Rosengren
  • Markit PMIs: US, UK, Eurozone

Thursday, June 24

  • BOE rate decision
  • Germany IFO business climate
  • US weekly jobless claims
  • Fed speak: Philadelphia Fed President Patrick Harker, Atlanta Fed President Raphael Bostic, St. Louis Fed President James Bullard, New York Fed President John Williams

Friday, June 25

  • Fed speak: Cleveland Fed President Loretta Mester, Boston Fed President Eric Rosengren
  • US personal income and spending, PCE inflation, consumer sentiment

The Fed’s switch in tact has send the buck soaring, as dollar bulls rejoice at the thought of a better-than-expected US economic recovery prompting the Fed into sooner-than-expected action.

However, from a technical perspective, the USD index is having a breather at the time of writing. This index is trying to pull back from overbought conditions, having broken above the upper bound of its Bollinger band while its 14-day relative strength index attempts to retrace back to the sub-70 region.

Note that this USD index is an equally weighted index comprising six major currency pairs, as opposed to the benchmark DXY which has different weightings for its 6 constituents (Euro being the largest at 57.6%, and the Swiss Franc accounting for just 3.6% of the DXY).

Still, should Fed officials tow a hawkish line over the coming days, in light of what had transpired at last week’s FOMC meeting, that could spell further gains for this USD index, potentially seeing it match its year-to-date high.

‘Markets Extra’ podcast: Fed discos to taper-town

BOE to follow Fed’s cues?

This change in approach by the Fed could prompt the Bank of England to follow suit, framing the BOE’s policy commentary in a new light. Note that UK inflation climbed above the central bank’s target for the first time in two years, with the CPI coming in at 2.1% year-on-year in May. This could hasten the BOE’s attempts to rein in surging consumer prices.

Overall, markets remain optimistic about the UK economic reopening considering its elevated vaccination rates. Still, the spread of the Delta variant remains as a source of concern, having pushed back the full reopening of the UK economy which was initially due to happen today.

It remains to be seen how the BOE will interpret such risks, and how it will impact Sterling.

GBPUSD has tumbled under the weight of the soaring greenback in recent sessions, having broken below its 100-day simple moving average (SMA), though finding support for the time being around the 1.38 mark which proved reliable in March as well as end-May. Stronger support may arrive at the 1.3670 region.

To be clear, the BOE is widely expected to leave its policy settings untouched this month, just as the Fed did. However, it’s the signaling of its future policy intentions that could rock markets once more.

Should the hawkish voices at the Bank of England also grow louder, emulating their peers from across the pond, that could allow GBPUSD to find a firmer footing above its 100-day SMA.


Disclaimer: The content in this article comprises personal opinions and should not be construed as containing personal and/or other investment advice and/or an offer of and/or solicitation for any transactions in financial instruments and/or a guarantee and/or prediction of future performance. ForexTime (FXTM), its affiliates, agents, directors, officers or employees do not guarantee the accuracy, validity, timeliness or completeness, of any information or data made available and assume no liability as to any loss arising from any investment based on the same.


Forex-Time-LogoArticle by ForexTime

ForexTime Ltd (FXTM) is an award winning international online forex broker regulated by CySEC 185/12 www.forextime.com

USD Remains a Favourite

By Dmitriy Gurkovskiy, Chief Analyst at RoboForex

EUR/USD is slowly rising on Monday but the overall situation in the major currency pair hasn’t changed – the “greenback” remains among the market players’ favourites.

The USD owes it to the Fed’s June meeting results, where the regulator hinted at two possible rate hikes before the end of 2023. It’s earlier than expected, that’s why this news provided the American currency with great support.

In addition to that, St. Louis Federal Reserve Bank President James Bullard told last Friday that the changes in the regulator’s rhetoric were a natural response to the current economic growth and inflation boost. In his opinion, the country has been recovering after the coronavirus pandemic, that’s why everything that is happening to it is quite normal.

Experts immediately compared this situation with 2013, when the Fed announced a decline in the QE program.

In the H4 chart, after finishing the descending wave at 1.1947 and then forming a new consolidation range around this level, EUR/USD has broken it to the downside to complete another descending structure at 1.1855. Possibly, today the pair may test 1.1947 from below and then resume trading downwards with the short-term target at 1.1700. From the technical point of view, this scenario is confirmed by MACD Oscillator: its signal line is leaving the histogram area and expected to grow towards 50. After rebounding from this level, the line may fall and get back to the current lows.

As we can see in the H1 chart, after rebounding from 1.1947, EUR/USD has completed the descending structure towards 1.1855. Today, the pair may correct to test 1.1947 from below and then resume trading downwards with the short-term target at 1.1760. From the technical point of view, this scenario is confirmed by the Stochastic Oscillator: after breaking 50 to the upside, its signal line may continue growing towards 80.

Disclaimer

Any forecasts contained herein are based on the author’s particular opinion. This analysis may not be treated as trading advice. RoboForex bears no responsibility for trading results based on trading recommendations and reviews contained herein.

Week In Review: Hawkish Fed Surprise, King Dollar, Gold Melts

By Lukman Otunuga Research Analyst, ForexTime

It was a tense week filled with anticipation as investors awaited the U.S. Federal Reserve meeting for clues on future monetary policy.

Despite the quiet start, global stocks hit record highs on Monday as equity bulls drew strength from the transitory inflation narrative. Looking at currency markets, the Euro wobbled above 1.21 while the Dollar Index struggled for direction as market players adopted a defensive approach.

In the United Kingdom, UK Prime Minister Boris Johnson delayed lifting the remaining Covid-19 restrictions until Monday 19th July. We questioned whether this would negatively impact the UK’s economic recovery from the pandemic?

On Tuesday, caution enveloped financial markets even after Wall Street closed at record highs overnight. Ahead of the Fed meeting, attention was directed towards the US retail sales and Producer Price Index (PPI) data. Interestingly, US retail sales declined 1.3% month-over-month in May, reversing from the 0.9% rise witnessed in the previous month while PPI climbed 6.6% on an annual basis.

Our trade of the week was gold which remained shaky ahead of the Fed meeting. The past few days were rough and rocky for precious metal after bulls struggled to build on the momentum beyond the psychological $1900 level. We expected gold to remain highly sensitive to the post-FOMC price movements, especially if there were wild movements in Treasury yields and the dollar.

The wait was nearly over on Wednesday morning.

Investors who were craving for some action and volatility had their wishes fulfilled on Wednesday evening after the Fed dished out a hawkish surprise. Although the central bank kept its policy rates unchanged, it moved up its planned interest rate hikes while raising growth and inflation forecasts. This sent shockwaves across financial markets, turbocharging the Dollar, lifting Treasury yields while dragging US stocks lower.

‘Markets Extra’ Podcast: Fed discos to taper-town!

Digging deeper, the Fed signalled two interest rate hikes by the end of 2023 (from zero in the prior meeting) and opened the debate on when it may be appropriate to start tapering. Growth was estimated to expand 7% this year, up from 6.5% in March’s projection. In regards to Inflation, headline and core PCE are expected to reach 3.4% and 3% in 2021, up from previous estimates of 2.4% and 2.2%.

After being bullied by G10 currencies over the past few months, it may be time for the Dollar to strike back with a vengeance. It has appreciated against every single major currency this week while the Dollar Index (DXY) has gained over 1.8%.

Looking at the technical picture, the DXY has turned bullish on the daily timeframe. A strong weekly close above 92.00 could signal further upside next week. However, a technical pullback towards the 200-day SMA could remain a possibility before bulls strike again.

It was an awful week for the EURUSD as king Dollar was crowned by the Fed. A weekly close below 1.1900 may send prices towards 1.1800 and possibly lower this month.

We saw a similar picture with the GBPUSD. It collapsed like a house of cards with prices trading around 1.3800 as of writing.

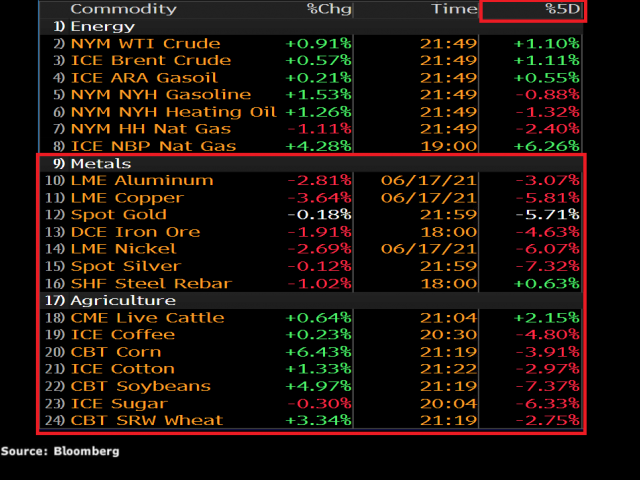
In the commodities arena, gold was a sorry sight to behold. The precious metal stood little chance against a hawkish Federal Reserve and this was reflected in the sharp selloff on Wednesday evening. The toxic combination of an appreciating Dollar, rising bond yields, and prospects of higher interest rates dealt a crippling blow to zero-yielding gold. The precious metal has shed over 5.7% this week and is trading below $1770 as of writing.

Looking at the technical picture, prices are heavily bearish on the daily charts with sustained weakness below $1800 opening the doors to $1750 and possibly lower this month.

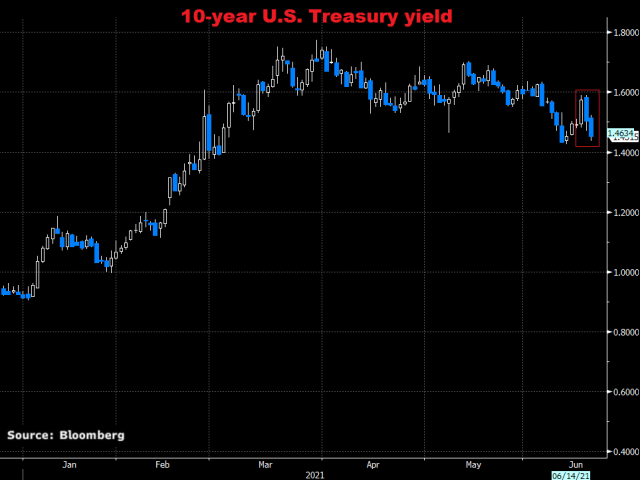
Interestingly, the 10-year Treasury yield surrendered its post-Fed meeting gains to trade around 1.46% as of writing. This could be linked to the heavy sell-off in commodities amid actions by China to crackdown on inflation.

Falling commodities tend to lead to higher bond prices, resulting in lower bond yields.

Disclaimer: The content in this article comprises personal opinions and should not be construed as containing personal and/or other investment advice and/or an offer of and/or solicitation for any transactions in financial instruments and/or a guarantee and/or prediction of future performance. ForexTime (FXTM), its affiliates, agents, directors, officers or employees do not guarantee the accuracy, validity, timeliness or completeness, of any information or data made available and assume no liability as to any loss arising from any investment based on the same.


Forex-Time-LogoArticle by ForexTime

ForexTime Ltd (FXTM) is an award winning international online forex broker regulated by CySEC 185/12 www.forextime.com