There are many different types of channeling tools that can be used to trade the markets. One of the more effective types of channeling techniques involves utilizing the linear regression channel. In this article, we will discuss a few high probability trading strategies using this indicator.
Table of Contents
Linear Regression Trading Basics
Linear regression analysis is statistical model for evaluating and understanding a set of data points. It can be a very versatile tool that can be used for many trading strategies from swing trading, breakout trading, momentum trading, as an overbought and oversold indicator and many more. Linear regression’s foundation is based on a normal distribution within the bell curve, and measured using standard deviation. The bulk of the data points occur within the central part of the bell curve, or what is considered the normal occurrences. Those data points that lay outside the normal distribution are considered to be skewed or abnormal.
One standard deviation of one side from the mean consists of approximately 34% of the data points, while one standard deviation that includes both sides from the mean consists of approximately 68% of the data set. Expanding on this, two standard deviations from the mean consists of 95% of the data points. Three standard deviations encompasses 99.7% percent of all the data points.
So how does this apply to the financial markets? Well, using a linear regression indicator applied to a price chart, it will allow you calculate the normal distribution of price movement within a selected area on your price chart. This will help you to see where the majority of price action has taken place, and more importantly help you to pinpoint irregularities that can lead to potentially profitable trading opportunities.
Free Reports:
 Get our Weekly Commitment of Traders Reports - See where the biggest traders (Hedge Funds and Commercial Hedgers) are positioned in the futures markets on a weekly basis.
 Download Our Metatrader 4 Indicators – Put Our Free MetaTrader 4 Custom Indicators on your charts when you join our Weekly Newsletter
Below you can see the linear regression indicator plotted on a price chart.
This linear regression indicator is using a 2 standard deviation input from the mean. We selected the first anchor point at the bottom of the chart which represented a major swing low. Then we stretched that upwards to the second anchor point, which is a major swing high on the price chart. Upon selecting these two levels, the linear regression channel was automatically plotted on the chart.
The central line represents the mean, while the upper and lower lines represent 2 standard deviations from the mean. These upper and lower boundary lines take the form of parallel lines displaced from the mean based on the specific standard deviation set, which in this case is 2.
Essentially this linear regression channel allows us to see where 95% of the price action has occurred. We like to utilize 2 standard deviations as a default parameter and our trading strategies that we will be discussing below will be based on this default setting.
Support/Resistance Confluence Strategy
The first linear regression strategy that we will discuss involves confluence around a key horizontal support or resistance level. Confluence is an important concept in trading wherein, two or more factors point to a particular occurrence. The more layers of evidence that you can stack in favor of your intended position, the more likely the probability that the trade will result in a positive outcome.
In this linear regression strategy, our aim is to first find a key horizontal support or resistance area on the chart. It could be a major swing high or low, or an important supply or demand zone. We want to plot a linear regression channel as price nears that key level.
The linear regression channel coupled with the key horizontal price level, will provide a price and time projection for a potential reversal play. Typically, on this type of setup, you would want to buy at the close of the candle that reacts off the intersection of these levels.
Obviously, we want to make sure that the linear regression channel extreme is also being tested at this intersection point. A stop would be placed beyond the key horizontal S/R level. We would need to monitor the price action closely and exit upon price reaching an important resistance area in the case of a buy signal, or an important support area in the case of a sell signal. Let’s take a look at an example of this strategy:
The price chart below shows the price action for the USDJPY currency pair on the 240 minute timeframe.
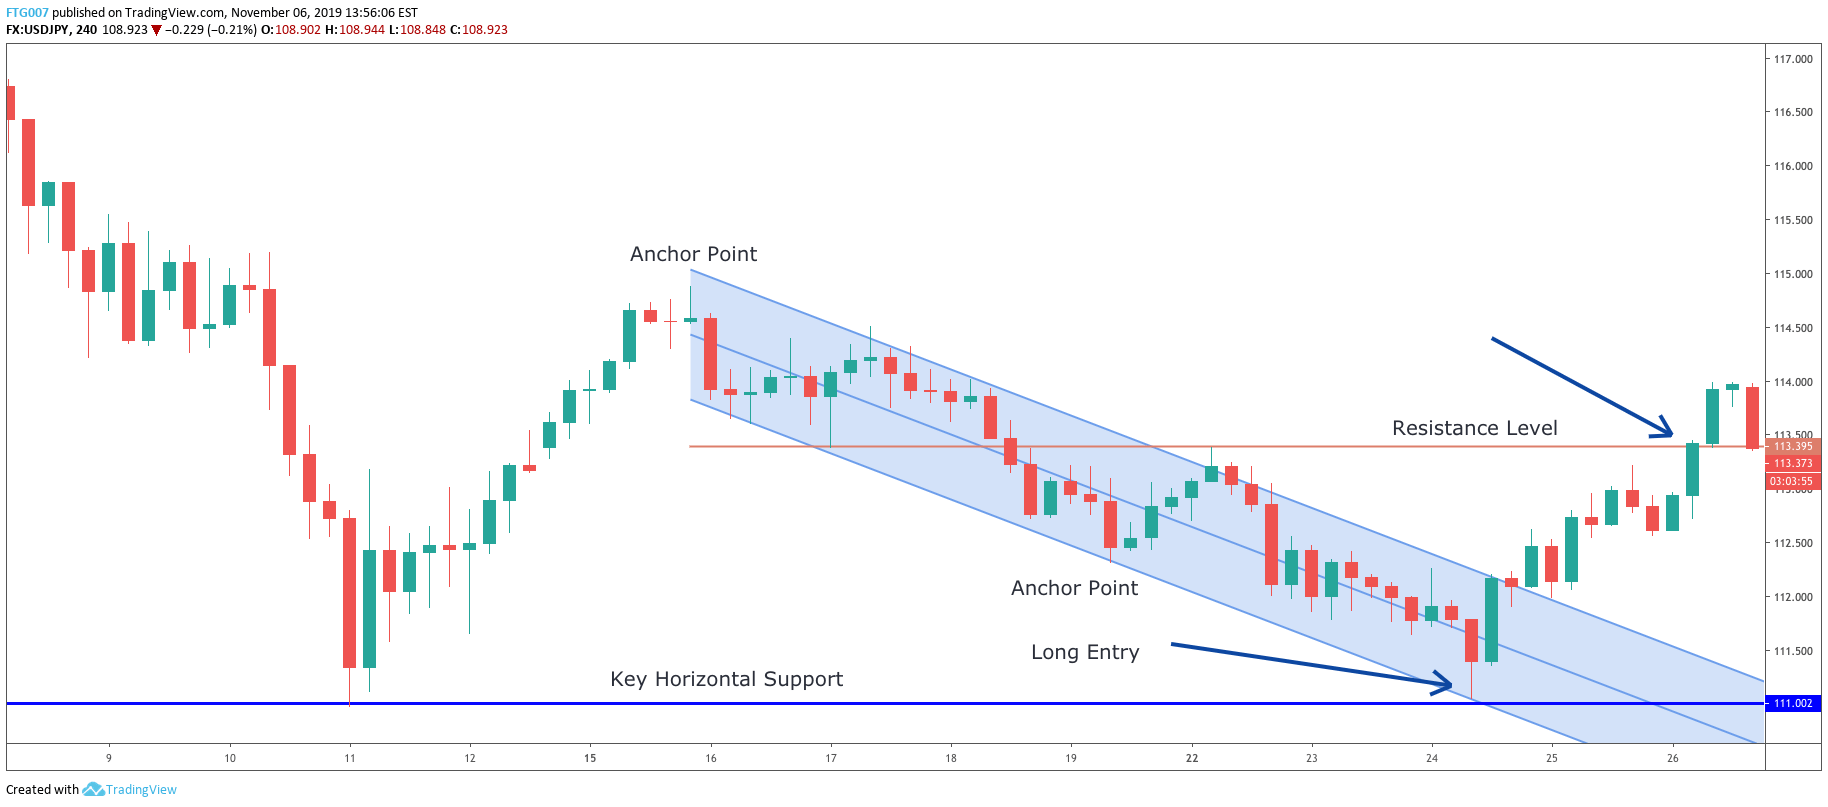
First, we locate and plot a key horizontal support level as can be seen on the lower end of the chart. This is a significant low and prices moved higher quickly after creating this bottom.
As prices later begin to move lower, we could plot the linear regression channel. Take note of the two anchor points that we used to construct this channel. From here, we could project a likely turning point for the USDJPY in terms of price and time as noted by the Long entry on the chart. This area represents a confluence of the Key Horizontal support level, and the lower extreme of the linear regression channel.
We would execute the long entry at the point shown on the chart, which represents the closing candle that reacts off the intersection of these levels. A stop loss would be placed beyond the horizontal support line. You can see that prices started to rise quickly after interacting with this strong confluent support zone. The trade is then closed out at an important upper resistance level as marked on the chart.
Swing Trading Within Trend Channel Strategy
Let’s take a look at a strategy that takes advantage of an existing trend. This strategy calls for trading minor retracements within a well-established trend. So first we need to find a currency pair that is displaying trending behavior.
Once we have identified such as pair, then we will plot the linear regression channel using the major swing low and major swing high within that trend. We would then wait until prices begin to make a minor correction towards the channel extreme. If this occurs, then we would enter on the first reversal candle, moving back into the channel, after the extreme of the linear regression channel has been penetrated.
We would want to place our stop loss beyond the extreme of the reversal candle. Our take profit target will occur when a candle closes beyond the median line in the direction of the trend. Let’s take a look at how this would play out on a price chart.
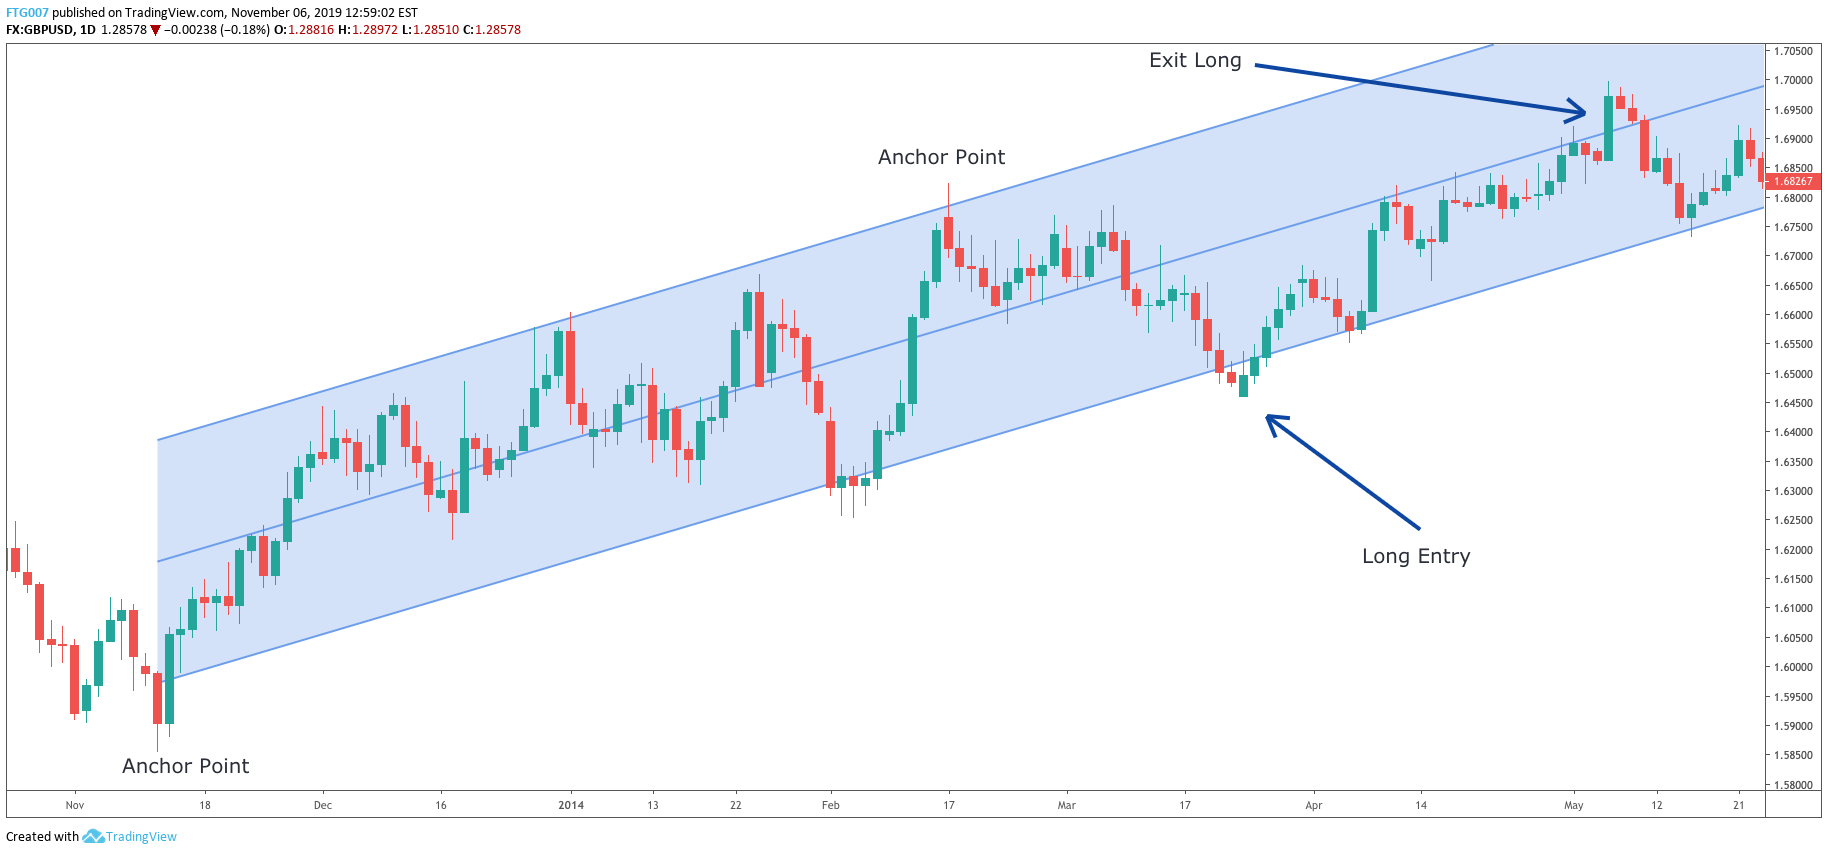
Below you will find the daily price action for the GBPUSD currency pair from early November 2018 to late May 2019.
First, we want to make sure that this market is in a trending mode. As you can see from the two marked anchor points that we used to plot this Linear regression channel, GBPUSD was in fact in an uptrend. The plan at this point would be to wait for a minor retracement of the trend and an approach towards the lower most boundary line.
The price action initially fell off the upper regression channel and then began to consolidate a bit at the median line. But soon afterwards, prices fell below the median line and reached the lower boundary of the channel.
As per our entry method, we would wait for the first bullish candle to form after this lower boundary was penetrated. The candle that signals our long entry has been marked on the chart. We would then place a stop loss just below the low of that bullish candle for a very moderate risk in case the trade went against us. We would then monitor the price action and plan to exit the trade on the first candle that closed above the median line.
You will notice that after the entry, price began to move up decisively. However, the median line acted as a strong barrier to the upward price move. In fact, on several occasions when price tested the median line it was rejected downward. Finally, there was a strong marubozu candle that closed above the median line, which signaled the long exit for the trade.
Linear Regression Breakout With Trend
Let’s now take a look at another trend based strategy that incorporates the linear regression channel. In this strategy, we will be looking for a strong directional move, that is followed by a corrective price movement.
Typically, this corrective price movement will be sideways and will resemble a sloping flag pattern. We want to contain this corrective price action within the linear regression channel and then trade the breakout in the direction of the prevailing trend.
The initial stop would be setup at a swing level prior to the breakout. The price target will be the 161% Fibonacci extension of the high low range within the corrective channel. Though this is quite a simple strategy, its effectiveness cannot be underestimated. Let’s take a look at the chart below that illustrates this setup.
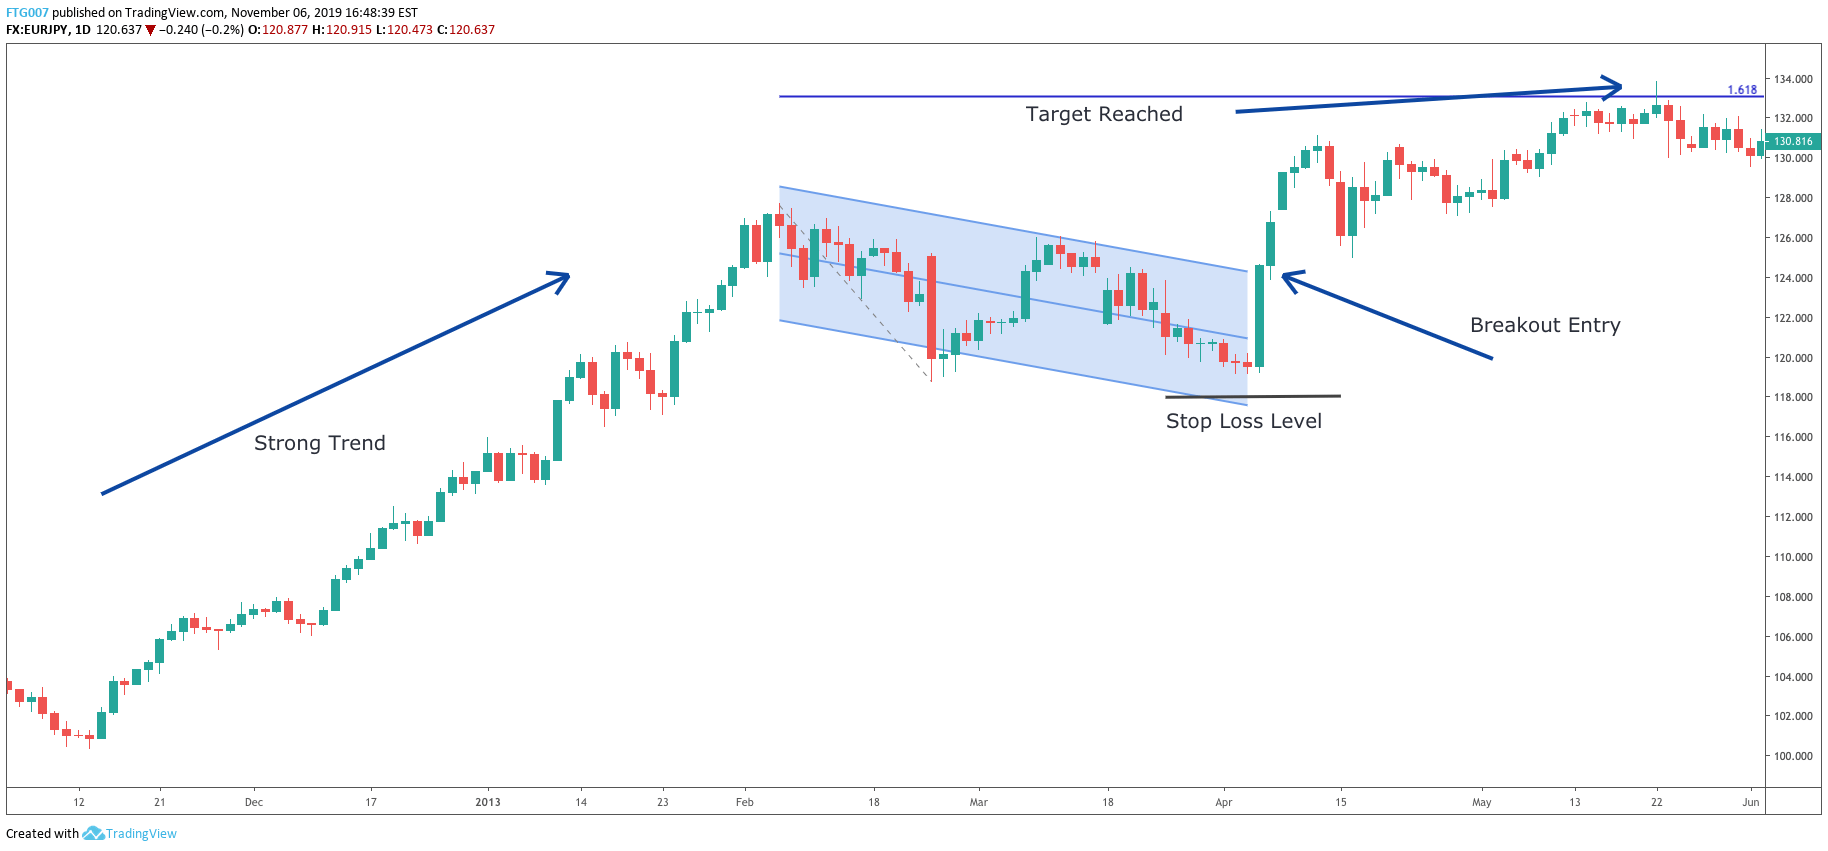
This is the daily price chart of the EURJPY pair. Based on this strategy, the first thing that we need to be on the lookout for is a strong trend. And we can clearly see in the chart, there was a strong uptrend in place. The next requirement is the formation of a corrective pattern that resembles a sloping flag pattern. The linear regression channel would be plotted around this corrective price action as shown on the chart.
The breakout entry occurs when the candle closes above the linear regression channel, with a stop under the most recent swing. We would then project the price target based on the 168% Fibonacci extension. The upper horizontal line on the chart shows where this target level occurs. In this case, after the breakout, prices climbed higher to reach the target without any risk of our stop loss being triggered.
This type of setup occurs many times in the market. It’s very important to make sure that you wait for the breakout to be confirmed by a candle close beyond the linear regression channel. The reason is that rejection candles that test the outer boundary of the channel, are prone to reversion to the median line.
Countertrend Breakout Strategy
The next strategy is a bit riskier due to the counter trend nature of the setup. Those starting out should focus on mastering the other linear regression trading strategies first before moving on to this one.
This setup requires two criteria. The first is the presence of a strong trend. We want to enclose the entire price action of the trending price move using the linear regression channel. The second component of this strategy is a strong reversal candle that breaks out of the channel in a countertrend direction. It’s crucial that the breakout bar is a strong reversal candle and one that closes well beyond the extreme of the linear regression channel.
This will usually setup a quick sharp reversal. The stop loss should be placed at the extreme of the breakout bar. The exit strategy that will be employed is a trailing stop using the 9 period Exponential moving average. So, the trade will be exited when price closes beyond the 9 period EMA in the opposite direction of the trade. Let’s see how this works using the chart example below:
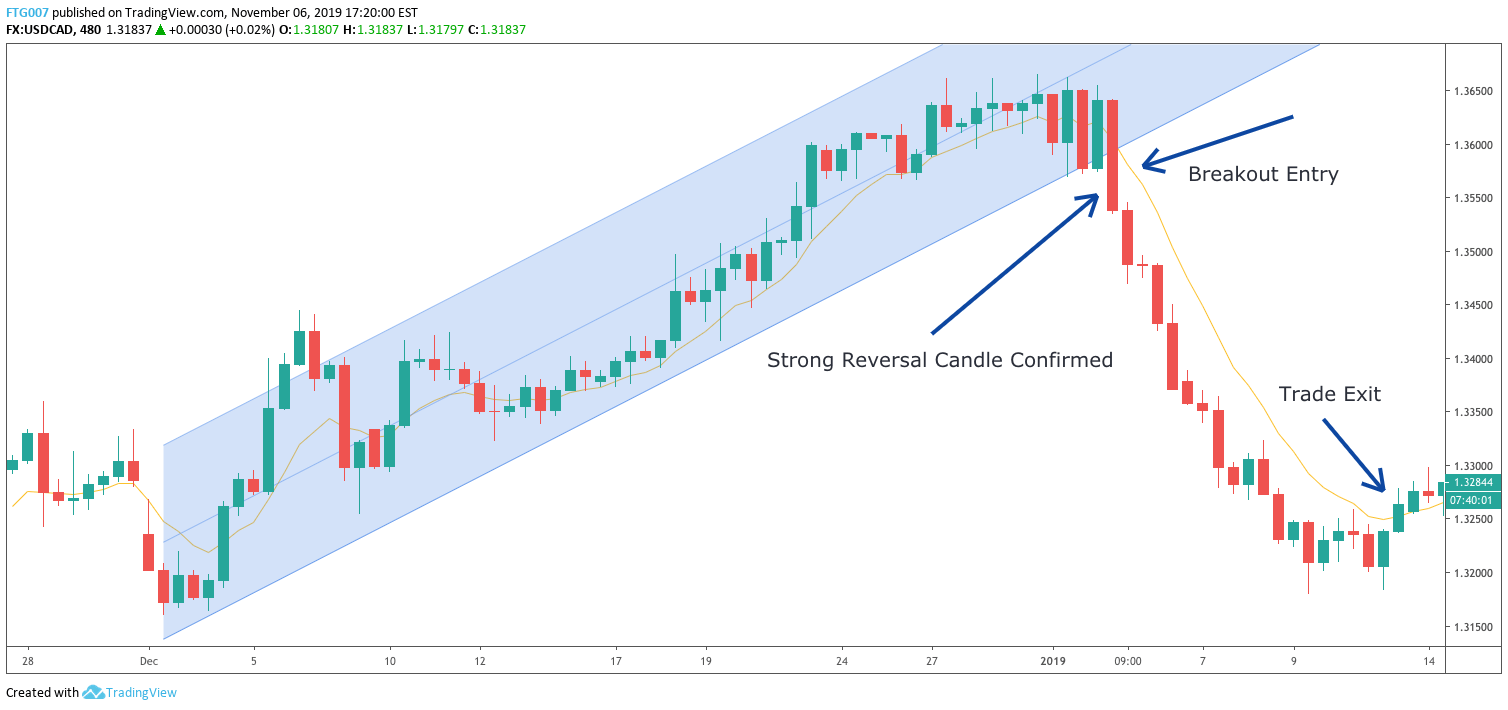
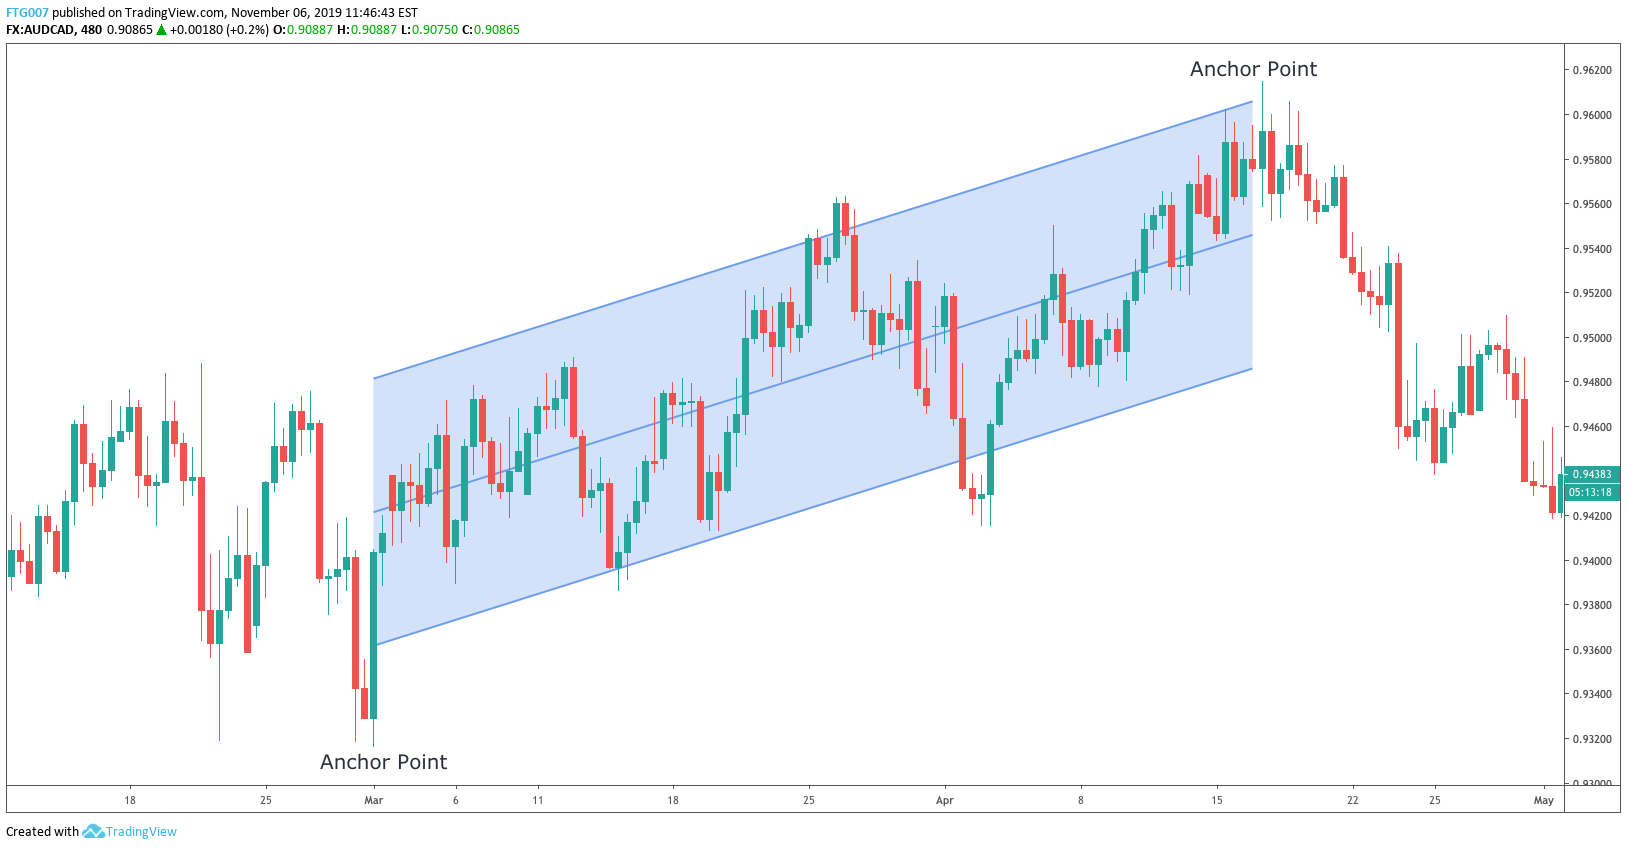
This is a 480 minute chart of USDCAD from late November 2018 to early January 2019. We can see that a strong uptrend is in place. We want to enclose the price action using the linear regression channel. On Jan 3, a strong bearish reversal candle formed that broke out of the upward sloping regression channel in a quite a volatile manner.
This type of reversal candle suggested that a countertrend move was likely to follow. As such, a short entry would be initiated at the close of the breakout bar as shown on the chart. There was a precipitous drop shortly thereafter. Approximately one week afterwards, prices began to consolidate a bit, and started to move higher. The trade would have been exited on the close above the 9 period EMA as shown on the chart.
By now you should have a good understanding of how the linear regression channel works. We have discussed a few simple but solid trading strategies using this indicator. Whether you decide to incorporate these strategies into your trading arsenal or use it as a foundation to do your own research in this area, it’s important that you are testing your methods to help improve your results.
Looking for a Linear Regression Trading Indicator? Check out our MetaTrader 4 Linear Regression Channel Indicator here. Or see all of our Custom Trading Indicators here.