
Japanese candlesticks are one of the easiest technical indicators to put on your charts. However, so many traders fail to recognize that behind those visually pleasing price candles is a whole wide world of Japanese candlesticks patterns. Developed by a rice trader in the 1700’s Japan, these unique chart patterns and trading concepts have stood the test of time – providing key market information to investors willing to look for it.
One of the main reasons that Japanese candlesticks are so effective is that they can provide a great deal of information about the market in a relatively small amount of space and are based on market prices.
Candlesticks can help give traders a good idea of the overall market sentiment as well as alert traders to continuation formations, topping setups, reversal patterns and help gauge the strength of trends. Many experienced traders believe that using candlestick patterns can give them an edge when combined with other forms of analysis. Jump into candlestick trading with this introductory guide to Japanese candlestick patterns.
Jump To Section:
- Chapter 1 – Introduction to the Guide
- Chapter 2 – History of Japanese Candlesticks
- Chapter 3 – Construction of a Japanese Candlestick
- Chapter 4 – Comparison of Chart Types
- Chapter 5 – Candlestick Reversal Patterns
- Chapter 6 – Candlestick Continuation Patterns
- Chapter 7 – Candlestick Trading Strategies
- Chapter 8 – Candlesticks Conclusion & Summary
Chapter 1. – Introduction to Japanese Candlesticks
Although the powerful philosophy and theory of Japanese candlesticks have been in existence for hundreds of years, are they still valid and useful in today’s trading markets, such as Forex, Stocks and Futures? More to the point, is it possible for you to readily and effectively incorporate their main principles into a profitable and successful trading strategy?
Free Reports:
 Download Our Metatrader 4 Indicators – Put Our Free MetaTrader 4 Custom Indicators on your charts when you join our Weekly Newsletter
 Get our Weekly Commitment of Traders Reports - See where the biggest traders (Hedge Funds and Commercial Hedgers) are positioned in the futures markets on a weekly basis.
This introductory guide is intended to answer these questions by providing you with an in-depth, but easily to understand analysis of this fascinating subject. A cheat sheet of sort for this vast world of candlesticks for technical traders. In addition, well-illustrated diagrams and charts will be utilized throughout in order to provide you with optimal clarification. A trading example is provided in Chapter 7 as well.
Chapter 2 will concisely outline the intriguing history behind Japanese candlesticks. In the process, you will discover how its initial strategies were forged into a successful methodology. You will also gain an understanding about why this technique is still so effective in the modern age.
The next chapter will discuss the basic construction of a candlestick and introduce you its main components. In doing so, you will quickly acquire a basic understanding about how to interpret the impact of each candlestick during trading.
Chapter 4 will then focus on explaining the advantages of using candlesticks as opposed to other popular chart types such as the bars and lines. You will be able to appreciate very quickly the significant benefits provided by candlesticks by studying the informative diagrams displayed. After reading this chapter, you should be able to already start deriving your own plans about how to incorporate candlesticks into your own trading strategies.
Based on the concepts described in the chapter 4, the next two chapters will proceed to develop and explain more on how candlestick patterns work. Each important pattern will be described with the aid of an explicitly described diagram which will show you how to interpret and use each one effectively.
First, popular patterns will then be introduced that are used by traders to identify the strong possibilities of trend reversals. Then other important formations will be presented that signify the continuation in direction of the current price trend.
Chapter 7 utilizes all the concepts introduced so far to show you a trading example based Japanese candlesticks. You should definitely acquire a good idea of combining candlesticks with other signals in this chapter.
The conclusion will draw your attention to other important trading concepts that you need to consider when you start trading using your new candlesticks strategy. You should merge them with your initial concepts to create a powerful and successful trading strategy.
Chapter 2. The History of Japanese Candlesticks
The fundamental theory and concepts behind Japanese candlesticks were invented over three hundred years ago by a Japanese rice trader named Sokyu Honma (1716 -1803). Sokyu lived in Sakata, Japan and was also known as Sokyu Homma and Munehisa Homma.
Sokyu made extensive studies of the price movements of stocks and commodities, especially rice, which enabled him to identify traits and patterns from daily trading formations. He was then able to produce a viable trading strategy that made him a very wealthy man. In fact, he eventually developed a very fearsome reputation for diligent and accurate trading which he gained from exploiting his enhanced knowledge of the rice markets and candlestick strategies.
Such was his success that Sokyu Honma achieved the rank of honorary Samurai as well as attaining the government rank of financial advisor. He compiled a book in 1755 called the ‘Fountain of Gold – the Three Monkey Record of Money’ in which he detailed his findings and observations on the psychology of trading. Even before the birth of candlesticks, Sokyu produced his famous Sakata’s Constitution which detailed the methods and rules behind his successful trading techniques.
Despite a great deal of uncertainty, many experts now acknowledge that candlestick charts were introduced into Japanese trading circles at the start of the rice markets in 1750. They have also credited Sokyu Homma for much of the pioneering and maturing behind the main principles of Japanese candlesticks. This remarkable individual was years ahead of his time and is still considered the principle figure of this trading methodology.
As the popularity of candlesticks grew, Sokyu produced his famous Sakata’s Five Methods by merging his Constitution with the new concepts of candlestick charts. Both his Constitution and Five Methods bear the name of his birth place, i.e. Sakata.
You should also be very interested to know that the number three was regarded as a mystical symbol in Japanese cultural history because it was considered to be blessed with divine power. Both the Sakata Constitution and the Sakata Five Methods were intensely based about this number and this is why they have been so heavily revered over history.
You can gain a deeper understanding about the power of three if you study the main components of the Sakata Five Methods. They were:
1. The ‘Three Mountains’ or ‘Sanzan’ depicted trading patterns similar to the modern day ‘Head and Shoulders’.
2. The ‘Three Rivers’ or ‘Sansen’ was indicative of the shift in power between the two market forces of selling and buying.
3. The ‘Three Gaps’ or ‘Sanku’ identified saturation or exhaustion points in the direction of the current trend and, as such, was considered as a forecaster of potential reversals.
4. The ‘Three Parallel Lines’ or ‘Sanpei’ represented a continuation pattern that strongly suggested that the current trend was most likely to continue in its present direction.
5. The ‘Three Methods’ or ‘Sanpo’ indicated again that the current prevailing market force was strong enough to maintain the direction of the present price trend.
As the presence of the number three was so prevalent throughout the Sakata’s Five Methods, this technique was often prefaced by the term ‘San’, which is Japanese for the number ‘three’.
Well, admittedly, this is a fascinating story, but how does it impact the modern day and can it enhance your own trading performance? In the first place, you must realize that Sokyu Honma was an extraordinary individual, if not a trading genius. His concepts and techniques have withstood the test of time and are now revered by many modern-day experts.
Hundreds of years later trader Steve Nison has been credited with bringing candlesticks into prominence in the western world and into modern technical analysis study. Nison wrote the book “Japanese Candlestick Charting Techniques” in 1991 and is considered one of the leading authorities on candlestick research and trading strategy.
Modern-day interest in Japanese candlesticks has intensified because so many of its principles blend very well with present-day western technology. As such, you will discover that obtaining a good understanding of Japanese candlesticks can definitely increase your ability to trade the current markets better. This is because, just as in the same way as Sokyu Honma, you can gain great insights into trading Forex, Stocks, Bonds, Commodities or Futures by using this methodology.
Finally, you also have the benefit of advanced technology that can help simplify many of the concepts behind Japanese candlesticks.
Chapter 3. Construction of a Japanese Candle
It is important to gain a good understanding about how a single Japanese candlestick is constructed. Each candlestick displays a visual representation that informs you how price is behaving during a selected time period. As such, if you can interpret them with confidence then you can deduce many features of the current performance of market price.
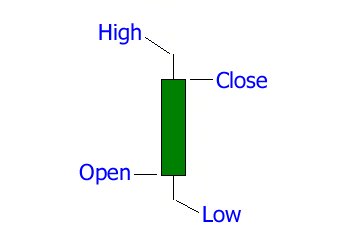
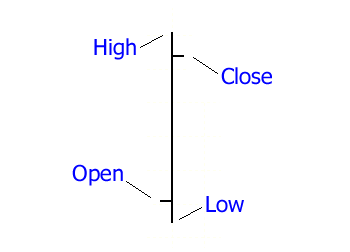
Each candlestick comprises four main components. They are its high price, closing price, low price and opening price. The range between the open and close is termed the ‘Real Body’ of a candlestick. When the color of the ‘Real Body’ is green, then this represents trading situations whereby price closed higher than its opening value. This is considered a bullish result. The following diagram depicts a bullish candlestick.
Bullish Candle
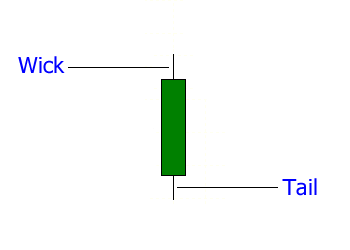
In addition, the distance between the closing price and the high price is called the ‘wick’, whilst the distance between the opening price and the low price is named the ‘tail’.
Wick and Tail
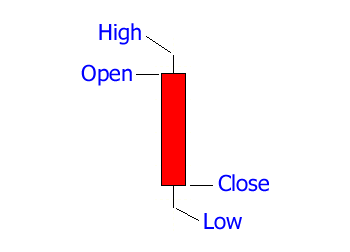
When the Real Body is red, then the candlestick is displaying a bearish action because price closes lower than its opening value. The following diagram illustrates a bearish candlestick.
Bearish Candle
Single Candles Shapes
The shape of a single candlestick pattern can take many variations, each with its own interpretation. Here are some of the most well-known:
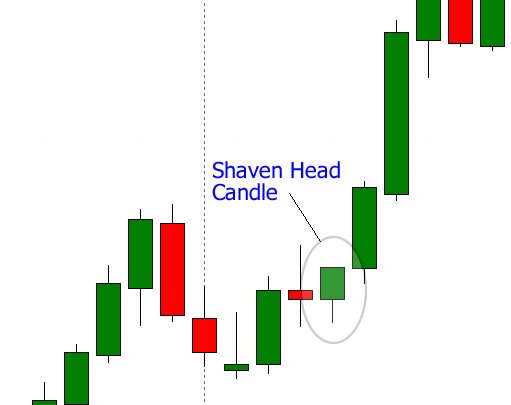
Shanven Head
Shaven Head has a small body, no wick but long tail. Suggests a bullish reversal.
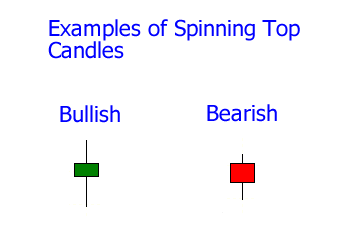
Spinning Tops
Spinning Tops possess small bodies with little or no tails and wicks. Spinning Tops indicate market indecision as little movement has been made in the period.
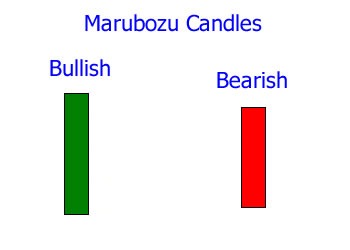
Marubozu Candlesticks
The Marubozu candlestick has no wick or tail but a long body. These two identical candlesticks shows strength in the trend either on a bullish candle (green) with the high is at the close of the period or on a bearish candle (red) where the low is at the close of the period. This indicates one side is in strongly in control and the trend will continue.
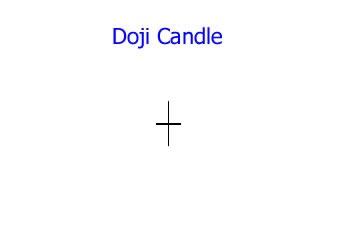
Doji Candlesticks
The common Doji candlestick usually exhibits no real body but mostly just a horizontal line. This is indicative of market indecision as the bulls and bears battle it out for control with equal strength. Dojis are one of the most popular candles because they can be found at turning points often and are easy to spot. They are considered indicators of a reversal at the end of bullish trends or bearish trends.
Other Types of Doji Candles
There are more Doji candlestick types as well. These can also have significance for reversal and continuation patterns.
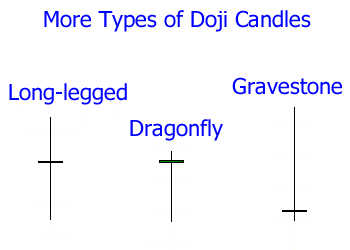
Long-legged Doji
The Long-legged Doji is an extended or longer version of the common Doji and signals a possible reversal point has been reached. This is when buyers and sellers are battling to a stalemate and price has gone as far as its going to go (at least for that candle). The next candle after the Doji is crucial to confirm where the trend is going.
Dragonfly Doji
Dragonfly Doji candles are a type of Doji with the opening and closing prices near the top of the candle. Although it can be used as a reversal signal in either up-trends or downtrends, it is usually seen as a bullish reversal candle, especially at the end of bearish streaks. This is because prices have been rejected at the bottom of the candle and are settling higher, signalling a potential reversal.
Gravestone Doji
Gravestone Doji candles are almost the opposite of the Dragonfly Doji. This Doji can also be used in either trend direction but it is usually seen as a bearish reversal indicator. This is especially true when prices have been in an uptrend that is looking exhausted. Buyers and sellers are battling for supremacy with the closing price coming near the bottom of the candle. Look for the next candle to confirm or deny this pattern.
Chapter 4. Comparison of Chart Types
As you can see, Japanese Candlesticks appear to have great potential, but how do they stack up against other types of trading charts? To answer this question, a comparison will now be made against two other popular chart types, which are lines and bars.
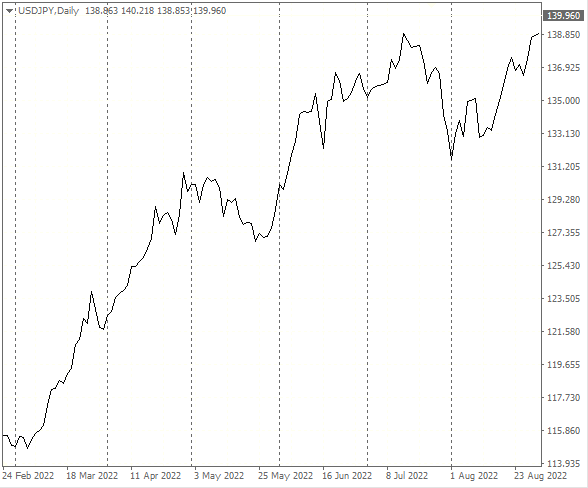
Line Charts (Closing Prices)
This visual representation simply draws a line from the closing price of one time frame through the closing price of the next one. The overall effect is to produce a line which can be used to assess the current trend of market price over a period of time.
The following diagram illustrates a line chart for the USD/JPY forex trading chart during August 2022.
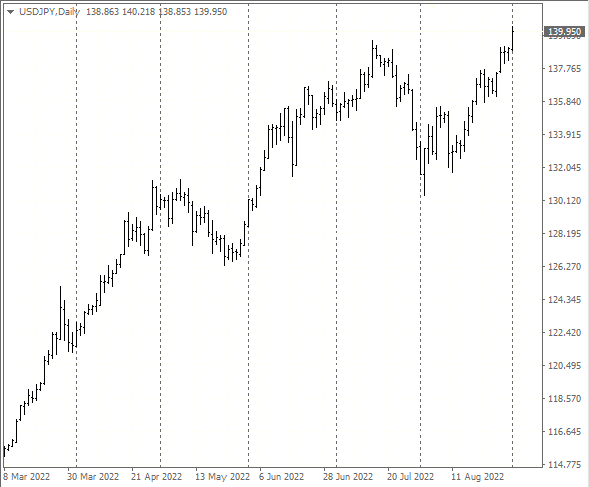
Bar Charts (Open, High, Low & Close)
This type of chart uses bar technology which displays the opening price, high price, low price and closing price of each time frame, as shown in the following diagram.
The full vertical line represents the complete range of trading that was achieved by a currency pair during the selected time period. The next diagram displays a bar chart again for the USD/JPY during August 2022.
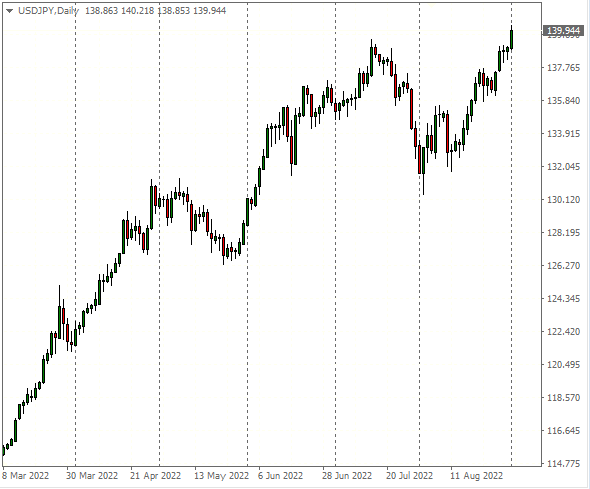
Japanese Candlestick Charts (Open, High, Low & Close)
For every time frame, a candlestick is created using the components described in the last chapter. The following diagram displays such a chart again for the USD/JPY chart during August 2022.
Candlestick charting offers the following acknowledged advantages over Line and Bar Charting despite the fact that Bar Charts also display the open, close, high and low values of price. The main reasons are:
1. Extensive and well-documented libraries of candlestick patterns exist that have been exhaustively researched over a considerable period of time.
2. These patterns are renowned for detecting major changes in the movements of market price such as reversals and continuations.
3. You will discover that candlestick patterns are simpler to analyze and understand than those of lines and bars. Consequently, they are recommended as more suitable for novices.
4. Candlesticks are visually more impressive. It is easier to interpret and read Japanese candlestick charts compared to the other types.
Chapter 5. Candlestick Reversal Patterns
Japanese candlesticks have acquired an impressive reputation for identifying major reversal events that indicate that the current price trend could be petering out and a serious reversal in market direction could be imminent.
Here are some popular bullish and bearish candlestick reversal patterns:
Bullish Candlestick Patterns
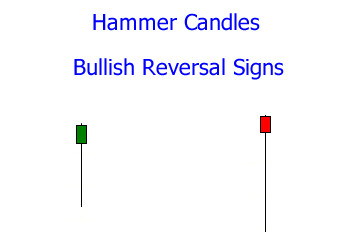
1. Hammer
This Hammer candlestick is created at the end of a bearish price trend and indicative of new bullish patterns. The final candlestick in the pattern drops substantially lower after opening only to rebound well above its mid-point. This candle possesses hardly any wick and ideally the long lower tail is at least twice the size of its body.
The Hammer indicates strong market upward momentum signifying the end of the current bear trend. The following diagram shows a few hammer examples (green and red) but remember, both these candlestick represent bullish reversal patterns.
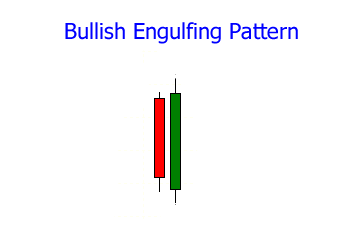
2. Bullish Engulfing Pattern
This formation is represented by two candlesticks and strongly indicates the imminent end of a bearish price trend. Candle one tends to possess a relatively smaller red bearish body whilst the second has a bullish green candlestick body that completely swamps or engulfs the Real Body of the first.
The following diagram illustrates a Bullish Engulfing Pattern.
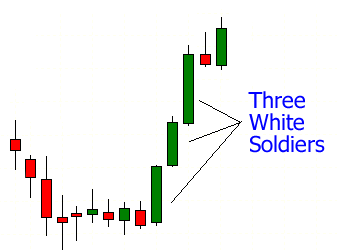
3. The Three White Soldiers
This pattern is a strong bullish reversal indication that occurs at the end of a bearish price trend. The Three White Soldiers candlestick pattern consists of three bullish green consecutive candles with each of the candles exhibiting a higher close than the previous one.
The following chart displays such a pattern.
Bearish Candlestick Patterns
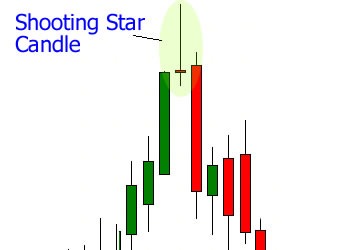
1. Shooting Star
This pattern is identified by a single candlestick that arises at the end of a current bullish price trend. After opening, the shooting star rises still further only to fall significantly producing a very large wick. This formation has a small body that is ideally twice as small as its wick.
The following chart shows a Shooting Star candlestick pattern that formed at the top of a bullish trend and reversed lower.
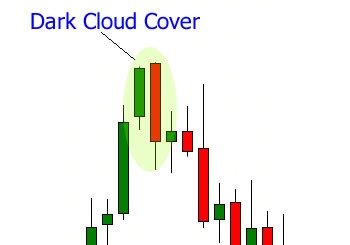
2. Dark Cloud Cover
This pattern consists of two candlesticks that can occur at the end of a bullish price trend and comprises a large red-bodied bearish candlestick that follows a long green-bodied bullish candlestick. The second red candlestick attains a new high after opening, but then must close below the midpoint of the preceding green-bodied candlestick to indicate a bearish pattern.
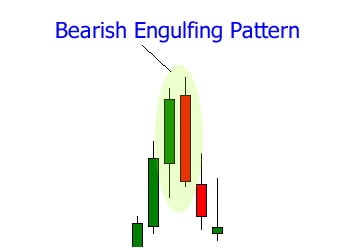
3. Bearish Engulfing Pattern
This formation is a bearish reversal signal that is generated by a two candlestick pattern. The first candlestick comprises a green bullish body that is completely engulfed by the larger red body candlestick. An example is shown in the next diagram. A bearish reversal happens after the engulfing pattern takes place.
Chapter 6. Candlestick Continuation Patterns
These formations occur usually towards the middle of a price trend and provide strong evidence that the present trend will resume once the pattern has completed its full structure.
Bullish Continuation Patterns
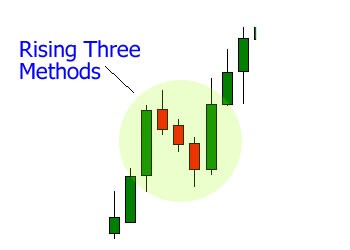
1. Rising Three Methods
This five candlestick pattern appears during a bullish uptrend. The first candle possesses a sizable green bullish body. The first green candle is followed by three candles that have small red bearish bodies with each one closing lower than its predecessor. The final candle consists of a very large green bullish body that closes above the high of the first candle in the sequence. The following diagram illustrates such a candlestick chart pattern and is followed by a trend higher.
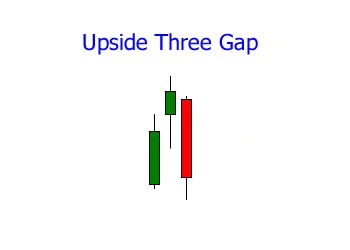
2. The Upside Three Gap
This pattern again occurs during a bullish uptrend and consists of three candlesticks. The first two exhibit long bullish green bodies that are separated by a gap. The third candlestick comprises a long red body and closes in such a way that it fills the gap. The following diagram displays an example of this triple candlestick pattern.
Bearish Continuation Patterns
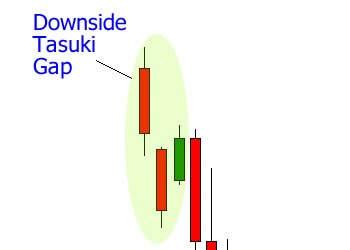
1. Downside Tasuki Gap
This next three candlestick pattern occurs during a downtrend and is a strong indication that the trend will continue after the formation is completed. The first two candlesticks possess red bearish bodies with a sizeable gap appearing between them. The third has a green body and partially completes the gap on closing.
The following diagram illustrates this pattern:
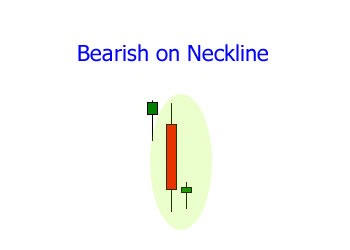
2. Bearish on Neckline
This two candlestick formation is generated during a bearish downtrend and again forecasts a continuation. The first opens with a gap and proceeds lower whilst the second possesses a small green body that closes well below the opening level of the first. This pattern is displayed in the following diagram:
Chapter 7. Candlestick Trading Strategies
Now you understand the chief characteristics of a Japanese candlestick and are also aware that a large library exists of identified and well-documented candlestick patterns, you can now consider designing your own trading strategy based on this methodology.
The best way to proceed in performing this task is to hone in on the fact that Japanese candlesticks have acquired such a good and well-deserved reputation for identifying reversals in price action.
In other words, you can utilize candlesticks to help you detect when a current price trend is likely to exhaust itself and then begin to reverse. This, indeed, would be a beneficial skill to achieve because, then you will always be trading in the direction of a new trend from its very birth.
Consequently, the cornerstone of your new strategy should be to deploy and recognize candlestick patterns that are capable of detecting either bullish or bearish reversals. You can select your favorites from the vast library of applicable patterns, such as those defined in chapter 5.
Next you need to consider a couple more important points. First, you need to realize that technical indicators, such as candlesticks, function best when you use them with time-frames extending from the 4-Hour Charts, Daily Charts and upwards. This is because lower time-frames produce much weaker statistics and pivot points, they can more easily generate misleading trading signals.
Another important trading secret that you must incorporate into your strategy is that you must always trade only in the direction of the current trend. You can achieve this goal by utilizing a second technical indicator such as a Moving Averages, Support and Resistance or Fibonacci Retracements. You should deploy such indicators to give yourself the best chance of success.
Forex Trading Candlesticks with RSI Divergence Example: EURUSD
The above 4-hour chart shows how to use a simple candlestick pattern in forex trading when combined with another indicator – in this case the Relative Strength Indicator or RSI. Here you can see black trendlines placed on the chart for both prices and the RSI Indicator. The trendlines are going in different directions and this is called RSI divergence.
Usually, the RSI and price go in the same direction but at turning points there can be a divergence. This is when price keeps falling but the RSI fails to confirm the momentum lower. Also, at the beginning of the bottom trendline, you can see that the RSI fell below 30 – an oversold indication that prices have fallen farther than normal.
This is combined with a couple of interesting and identifiable Candlesticks. First, there is a Long-legged Doji at point #1 and that is followed by an Engulfing candlestick at point #2.
The Long-legged Doji candle indicates a possible reversal pattern taking place. It is not a perfect textbook formation as it is a little bigger than usual. But it is close enough and clearly shows a battle between the buyers and sellers taking place.
With Doji candles, we want to take into consideration whether there was a strong trend predating the Doji and if there is reason to believe it could be a reversal point (RSI oversold reading and RSI Divergence appeared). Finally, we always want to confirm with the second candlestick after the Doji.
In this case, the next green Engulfing Candle at point #2 shows that buyers have pushed through the bearish resistance right from the candle open with no tail at all. This is our confirmation. Prices closed higher and then continued to rise even higher after the reversal point. Taking the reversal candle (doji), the bullish pattern candle (engulfing) and the RSI Divergence – this setup was a success.
Later in the uptrend, you can even see another type of Candlestick formation – the Rising Three Methods.
To set your trading orders, it is recommended to use your preferred method of trade management and entry processes to determine where you would get into the trade and out of the trade. After you see your setup, use major support and resistance levels or fibonacci retracement indicators to help find your best entry place as well as your exit area. This will differ with all traders and with different trading time-frames. It is improved with experience.
Hopefully, this chart setup shows you that when you read Japanese candlestick patterns it will not always be textbook perfect candles. The formations will vary but it is important to be aware of the type of candle type and what it the candle is telling you. Also, it is always recommended to have many points of analysis to help give you an edge.
Chapter 8. Candlesticks Conclusion & Summary
You should now, hopefully, be better acquainted with the basics of Japanese candlesticks and how they can be used in trading. These methods have gained a large following over time.
You may have had them on your charts for a long time without even giving them a second thought. Well, you might want to start studying them a lot more. They may boost your current trading strategies, give you more ideas to experiment with and will, at the least, deepen your knowledge of market patterns.
If you do start using strategies based on its principles, then you may want to think about incorporating the following general trading concepts:
1. Evolve your new trading skills over time by utilizing small steps of incremental risk. You can achieve this objective by using your new candlestick strategies first with a demo trading account, then a micro account (ten cents per pip), next a mini account ($1 per pip) and finally a standard account ($10 per pip).
2. Always employ a good money management strategy and never risk more than 1-2% of your total equity per trade. This simple strategy will prevent you from losing too much and keep you solvent should you over-trade (especially during volatile times).
3. You must never consider your new strategy as ‘get-rich-quick’ tool but that it will help you to develop a professional attitude towards Forex, Stocks, Commodities, Bonds or other markets. As such, use your new strategy to help you learn how to react to the many complex market patterns that arise.
4. Never trade by constantly throwing money at the markets but, instead, by build up your equity slowly in order to fund larger lot sizes using your newly acquired profits.
It would also be wise to heed the wisdom behind Sokyu Honma’s own Sakata Constitution which advised the following:
1. Study past trading movements calmly and without greed in order to develop a feel for their time and price ratio.
2. Aim to buy low and sell high and vice versa.
3. You should only increase your trading lot size after you have made pre-determined profits.
4. If you still suffer losses, then you must identify and correct all errors as a priority. You would also be wise to liquidate your positions and take a break from trading.
5. You should liquidate at least 70 to 80% of your total position once you have detected a top or bottom. Close the remainder once you have confirmed a change in direction of price.
About the Author:
Taylor Wilman is an experienced market trader and investor. He contributes to our investor blog and likes to combine fundamental, technical and sentiment analysis for better decision making. Taylor loves to share his experiences and write about the financial markets.
Disclaimer: All information and opinions on this website are for general informational purposes only and do not constitute investment advice.