By InvestMacro Research
The first quarter of 2025 is cruising along and we wanted to highlight some recent companies that have been added to our Cosmic Rays Watchlist, according to earnings data from last quarter. This week’s companies include a few industrial companies as well as a utility and a consumer discretionary stock.
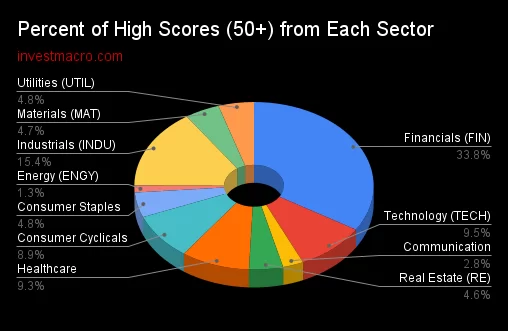
The Cosmic Rays Watchlist is the output from our proprietary fundamental analysis algorithm. The algo examines company fundamental metrics, earnings trends and overall sector strength trends. The aim is identify quality dividend-paying companies on the NYSE and Nasdaq stock exchanges. If a company scores over 50, it gets added to our Watchlist for further analysis.
We use this system as a stock market ideas generator and to update our Watchlist every quarter. However, be aware the fundamental system does not take the stock price as a direct element in our rating so one must compare each idea with their current stock prices (this is not a timing tool).
Many studies are consistently showing overvalued markets and that has to be taken into consideration with any stock market idea. As with all investment ideas, past performance does not guarantee future results. A stock added to our list is not a recommendation to buy or sell the security.
Here we go with 5 Stocks scored in 2025:
Travel + Leisure Co. (TNL):
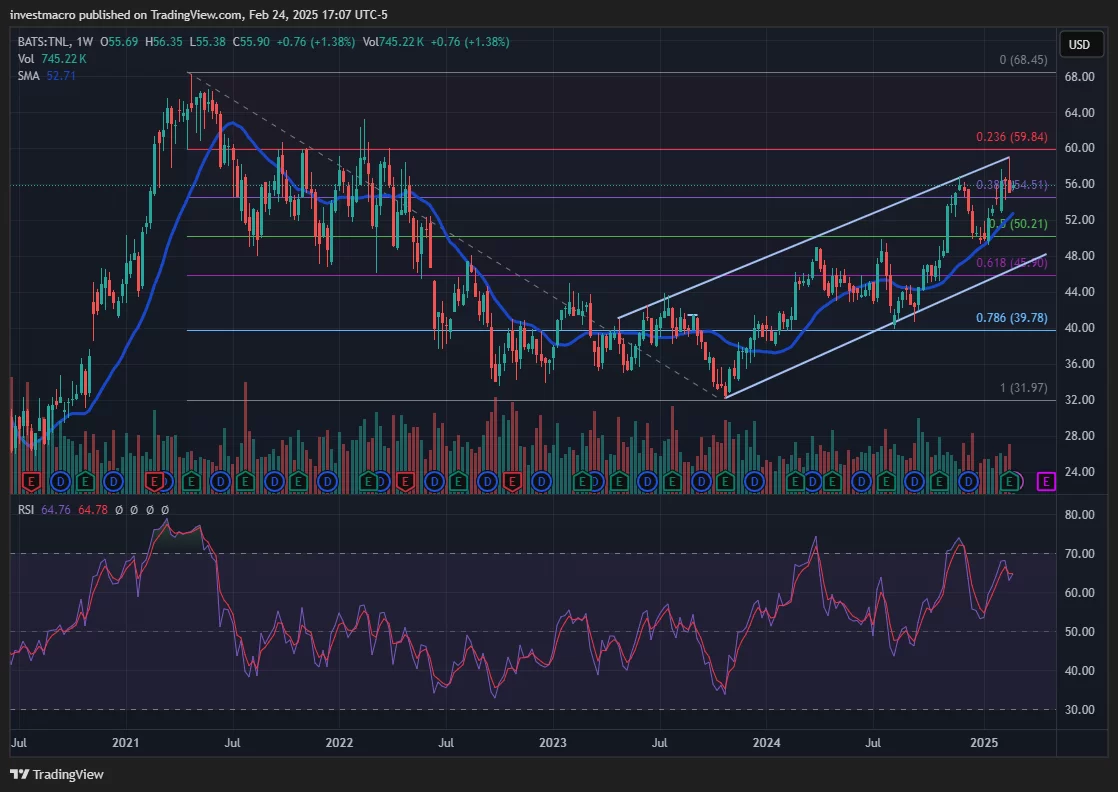
Travel + Leisure Co. (Symbol: TNL) was recently added to our Cosmic Rays WatchList. TNL scored a 55 in our fundamental rating system on February 20th.
At time of writing, only 7.93% of stocks have scored a 50 or better out of a total of 11,665 scores in our earnings database. This stock has made our Watchlist a total of 6 times over the years and rose by 9 system points from our last update. TNL is a Medium Cap stock and part of the Consumer Cyclical sector. The industry focus for TNL is Travel Services.
TNL has beat earnings-per-share expectations for four consecutive quarters and has a dividend of close to 3.50 percent with a payout ratio near 35 percent. The TNL stock price has outperformed the Consumer Discretionary Sector benchmark over the past 52 weeks with a 36.91 percent rise compared to the 24.92 benchmark return.
Company Description (courtesy of SEC.gov):
Travel + Leisure Co., together with its subsidiaries, provides hospitality services and products in the United States and internationally. The company operates in two segments, Vacation Ownership; and Travel and Membership. The Vacation Ownership segment develops, markets, and sells vacation ownership interests (VOIs) to individual consumers; provides consumer financing in connection with the sale of VOIs; and property management services at resorts. The Travel and Membership segment operates various travel businesses, including three vacation exchange brands, travel technology platforms, travel memberships, and direct-to-consumer rentals.
Company Website: https://www.travelandleisureco.com
Asset vs Sector Benchmark: *P/E Ratio (TTM) *52-Week Price Return *Beta (S&P500) – Stock: Travel + Leisure Co. (TNL) 7.22 36.91 1.66 – Benchmark Symbol: XLY 28.13 24.92
* Data through February 21, 2025
Duke Energy Corporation (DUK):
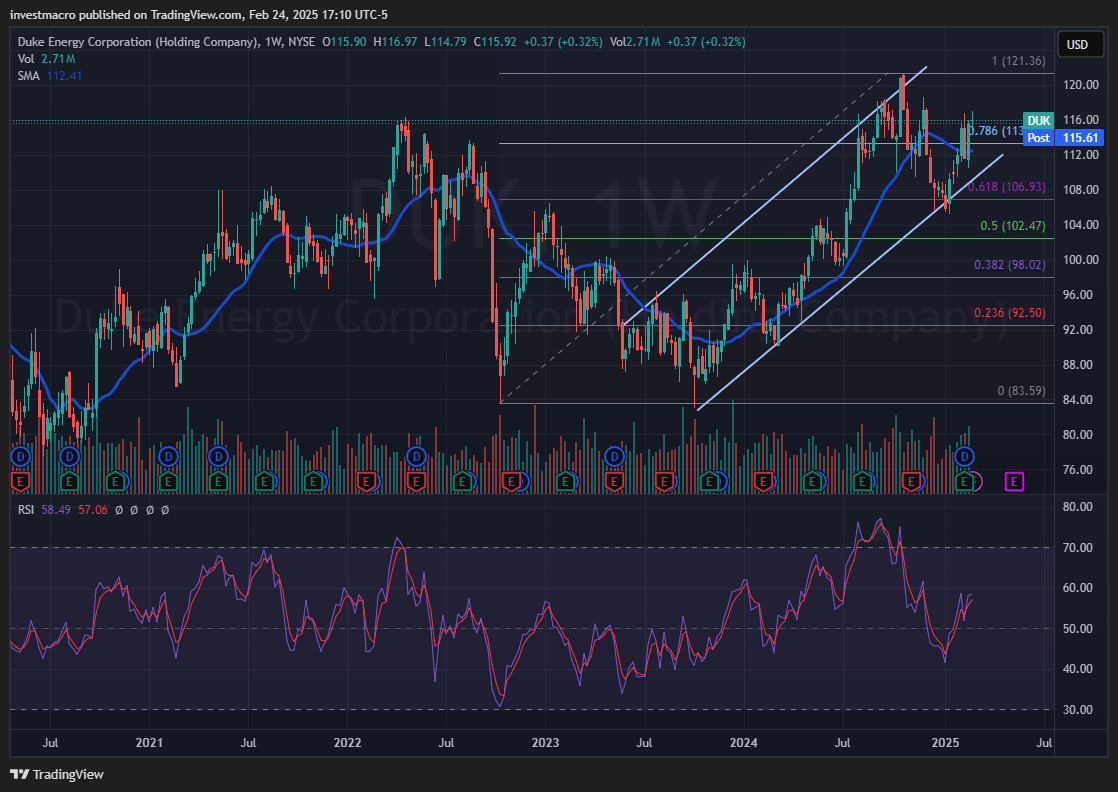
Duke Energy Corporation (Symbol: DUK) made our Watchlist with a 65 score on February 14th.
At time of writing, only 4.60% of stocks have scored a 60 or better out of a total of 11,665 scores in our earnings database. This stock has made our Watchlist a total of 3 times and rose by 33 system points from our last update. DUK is a Large Cap stock and part of the Utilities sector. The industry focus for DUK is Regulated Electric.
DUK met the earnings-per-share expectations in the latest quarter after beating eps two out of the past three quarters (with one miss). DUKE Energy has a dividend of close to 3.75 percent with a payout ratio near 70 percent. The DUK stock price has slightly under-performed the Utilities Sector benchmark over the past 52 weeks with a 24.2 percent return compared to the 30.56 benchmark return.
Company Description (courtesy of SEC.gov):
Duke Energy Corporation, together with its subsidiaries, operates as an energy company in the United States. It operates through three segments: Electric Utilities and Infrastructure, Gas Utilities and Infrastructure, and Commercial Renewables.
Company Website: https://www.duke-energy.com
Asset vs Sector Benchmark: *P/E Ratio (TTM) *52-Week Price Return *Beta (S&P500) – Stock: Duke Energy Corporation (DUK) 20.28 24.2 0.46 – Benchmark Symbol: XLU 21.02 30.56
* Data through February 21, 2025
Global Payments Inc. (GPN):
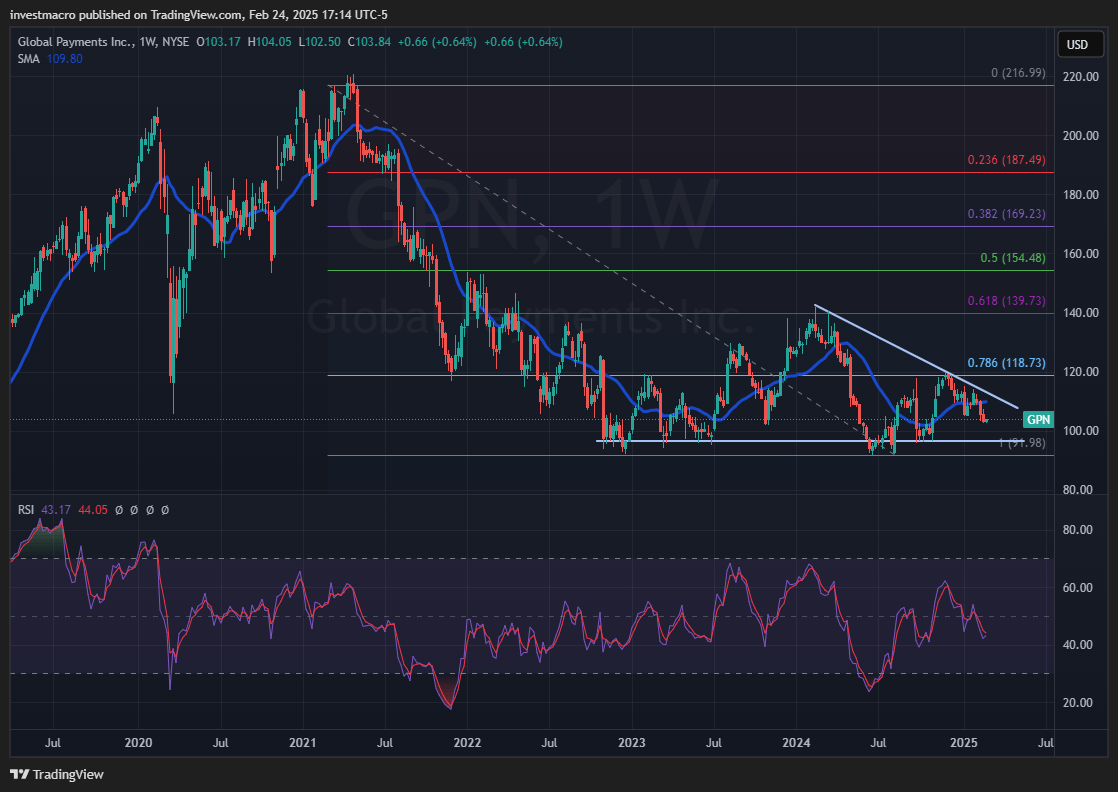
Global Payments Inc. (Symbol: GPN) was added to our Cosmic Rays WatchList with a 60 score on February 14th.
At time of writing, only 4.60% of stocks have scored a 60 or better out of a total of 11,665 scores in our earnings database. This stock is on our Watchlist for the first time. GPN is a Large Cap stock and part of the Industrials sector (some sites have this stock in the Financial Services sector). The industry focus for GPN is Specialty Business Services.
GPN has beaten earnings-per-share expectations in two out of the past four quarters (although missed the past two) and has a dividend of close to 0.95 percent with a payout ratio near 16 percent. The GPN stock price has majorly under-performed the Industrials Sector benchmark over the past 52 weeks with a -20.43 percent decline compared to the 15.59 benchmark return.
Company Description (courtesy of SEC.gov):
Global Payments Inc. provides payment technology and software solutions for card, electronic, check, and digital-based payments in the Americas, Europe, and the Asia-Pacific. It operates through three segments: Merchant Solutions, Issuer Solutions, and Business and Consumer Solutions.
Company Website: https://www.globalpaymentsinc.com
Asset vs Sector Benchmark: *P/E Ratio (TTM) *52-Week Price Return *Beta (S&P500) – Stock: Global Payments Inc. (GPN) 12.40 -20.43 0.98 – Benchmark Symbol: XLI 25.82 15.59
* Data through February 21, 2025
Snap-on Incorporated (SNA):
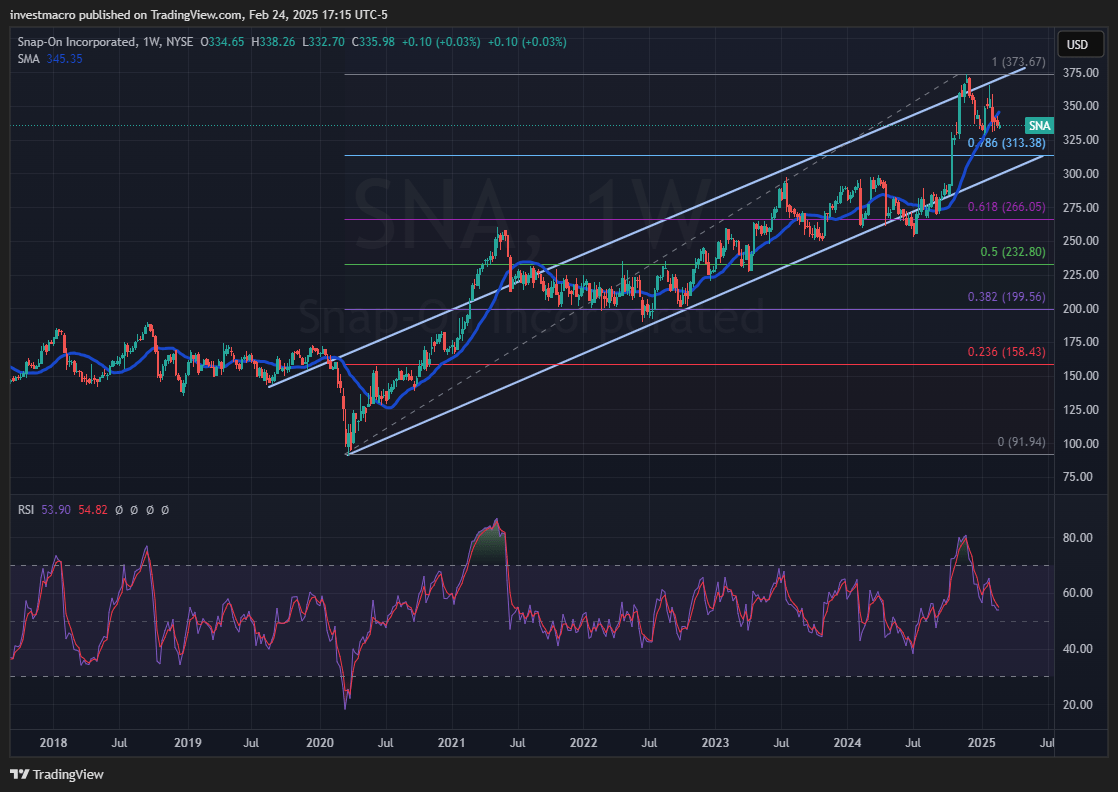
Snap-on Incorporated (Symbol: SNA) was added to our Cosmic Rays WatchList on February 8th with a 55 score in our fundamental rating system.
At time of writing, only 7.93% of stocks have scored a 50 or better out of a total of 11,665 scores in our earnings database. This stock has made our Watchlist a total of 2 times and rose by 25 system points from our last update. SNA is a Large Cap stock and part of the Industrials sector. The industry focus for SNA is Manufacturing – Tools & Accessories.
SNA has beaten its earnings-per-share expectations for four consecutive quarters including in the latest quarter. Snap On has a dividend right around 2.50 percent with a payout ratio near 45 percent. The SNA stock price has outperformed the Industrials Sector benchmark over the past 52 weeks with a 25.76 percent gain compared to the 15.59 benchmark return.
Company Description (courtesy of SEC.gov):
Snap-on Incorporated manufactures and markets tools, equipment, diagnostics, and repair information and systems solutions for professional users worldwide. It operates through Commercial & Industrial Group, Snap-on Tools Group, Repair Systems & Information Group, and Financial Services segments.
Company Website: https://www.snapon.com
Asset vs Sector Benchmark: *P/E Ratio (TTM) *52-Week Price Return *Beta (S&P500) – Stock: Snap-on Incorporated (SNA) 15.11 25.76 0.95 – Benchmark Symbol: XLI 25.82 15.59
* Data through February 21, 2025
Allison Transmission Holdings, Inc. (ALSN):
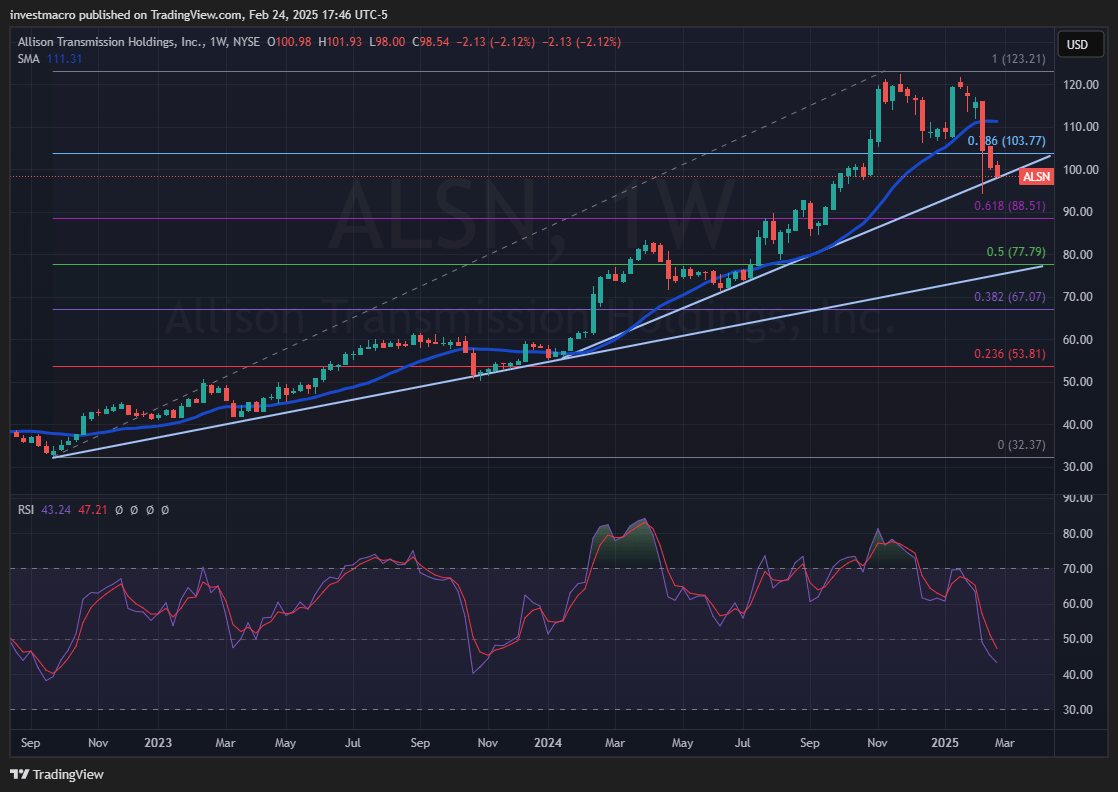
Finally, Allison Transmission Holdings, Inc. (Symbol: ALSN) was added to the Cosmic Rays WatchList on February 12th with a 59 score in our fundamental rating system.
At time of writing, only 7.93% of stocks have scored a 50 or better out of a total of 11,665 scores in our earnings database. This stock has been a staple on our list and has made our Watchlist a total of 7 times, rising by 12 system points from our last update. ALSN is a Medium Cap stock and part of the Industrials sector. The industry focus for ALSN is Machinery.
Allison Transmission has beaten its earnings-per-share expectations for four straight quarters as well including in the latest quarter. ALSN has a dividend just above 1.00 percent with a payout ratio near 15 percent. The ALSN stock price has strongly outperformed the Industrials Sector benchmark over the past 52 weeks with a 45.44 percent increase compared to the 15.59 benchmark return.
Company Description (courtesy of SEC.gov):
Allison Transmission Holdings, Inc., together with its subsidiaries, designs, manufactures, and sells commercial and defense fully-automatic transmissions for medium-and heavy-duty commercial vehicles, and medium-and heavy-tactical U.S. defense vehicles worldwide.
Company Website: https://www.allisontransmission.com
Asset vs Sector Benchmark: *P/E Ratio (TTM) *52-Week Price Return *Beta (S&P500) – Stock: Allison Transmission Holdings, Inc. (ALSN) 10.45 45.44 0.98 – Benchmark Symbol: XLI 25.82 15.59
* Data through February 21, 2025
By InvestMacro – Be sure to join our stock market newsletter to get our updates and to see more top companies we add to our stock watch list.
All information, stock ideas and opinions on this website are for general informational purposes only and do not constitute investment advice. Stock scores are a data driven process through company fundamentals and are not a recommendation to buy or sell a security. Company descriptions provided by sec.gov.