By InvestMacro Research | Stock Market Ideas

The second quarter of 2025 is underway and we wanted to highlight three of the top small-cap companies that have been just recently added to our Cosmic Rays Watchlist. Today’s group includes a financial services company, an industrial company and a communications provider.
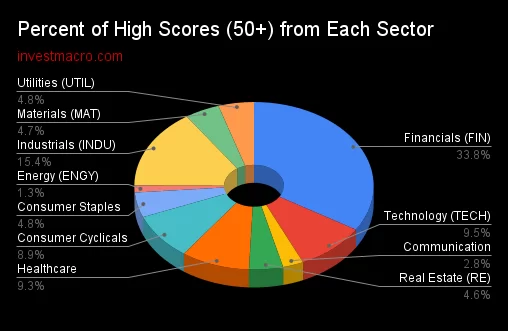
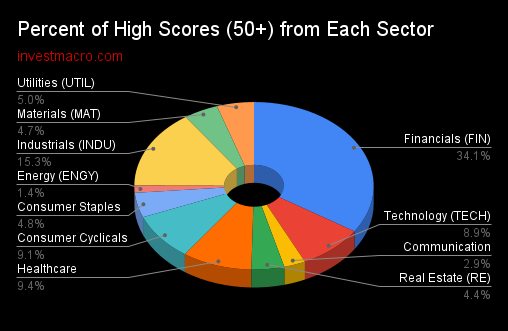
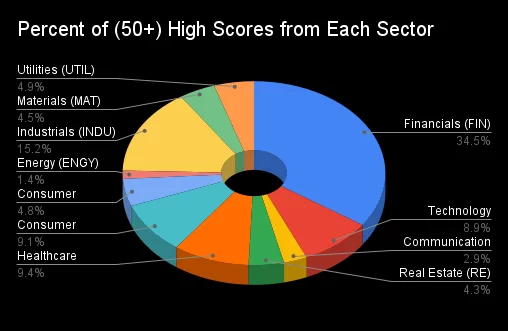
The Cosmic Rays Watchlist is the output from our proprietary fundamental analysis algorithm. The algo examines company fundamental metrics, earnings trends and overall sector strength trends. The aim is identify quality dividend-paying companies on the NYSE and Nasdaq stock exchanges. If a company scores over 50, it gets added to our Watchlist for further analysis.
We use this system as a stock market ideas generator and to update our Watchlist every quarter. However, be aware the fundamental system does not take the stock price as a direct element in our rating so one must compare each idea with their current stock prices (this is not a timing tool).
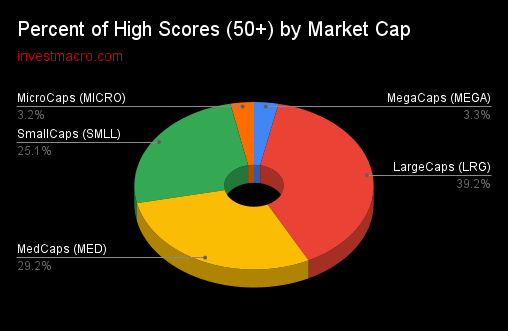
Currently, the total number of stocks in our model is 1,291. We have scored 12,949 quarterly earnings reports so far and overall, only 7.74% of company earnings reports have come in with a 50 or above score.
Many studies are consistently showing overvalued markets and that has to be taken into consideration with any stock market idea. As with all investment ideas, past performance does not guarantee future results. A stock added to our list is not a recommendation to buy or sell the security.
Here we go with 3 of our Top Small-Cap Stocks scored in Q1 2025:
Piper Sandler Companies (PIPR):

Piper Sandler Companies (Symbol: PIPR) was recently added to our Cosmic Rays WatchList. PIPR scored a 81 in our fundamental rating system on May 5th, 2025.
At time of writing, only 0.66% of stocks have scored a 80 or better out of a total of 12,949 scores in our earnings database. This stock has made our Watchlist a total of 2 times.
PIPR is a Small-Cap stock and part of the Financial Services sector. The industry focus for PIPR is the Capital Markets.
Piper Sandler
– P.E. ratio: 23.38
– Dividend: approximately 1.00%
– Dividend payout ratio: approximately 25%
– Earnings: Earnings PerShare (EPS) has risen 3 out of the last 4 quarters, beating analyst expectations for the last 2 quarters in a row
Piper Sandler Price Performance:
– Trades above 0.382 fibonacci retracement level (2022 to present)
– Down 11% year to date
– Up 20% in the last month
Company Description (courtesy of SEC.gov):
Piper Sandler Companies operates as an investment bank and institutional securities firm that serves corporations, private equity groups, public entities, non-profit entities, and institutional investors in the United States and internationally. The company offers investment banking and institutional sales, trading, and research services for various equity and fixed income products. Company Website: https://www.pipersandler.com
Asset vs Sector Benchmark: *P/E Ratio (TTM) *52-Week Price Return – Stock: Piper Sandler Companies (PIPR) 23.38 25.84 – Benchmark Symbol: XLF 17.01 21.85
* Data through May 14, 2025
Griffon Corporation (GFF):
Griffon Corporation (Symbol: GFF) was recently added to our Cosmic Rays WatchList. GFF scored a 56 in our fundamental rating system on May 9th, 2025.
At time of writing, only 7.74% of stocks have scored a 50 or better out of a total of 12,949 scores in our earnings database. This stock is on our Watchlist for the first time after rising by 10 system points from our last update.
GFF is a Small-Cap stock and part of the Industrials sector. The industry focus for GFF is Conglomerates.
Griffon Company:
– P.E. ratio: 15.45
– Dividend ratio: approximately 1%
– Payout ratio: approximately 15%
– Beaten analysts’ EPS expectations for three straight quarters
– EPS, P.E., and 5-year average P.E. below the industry average
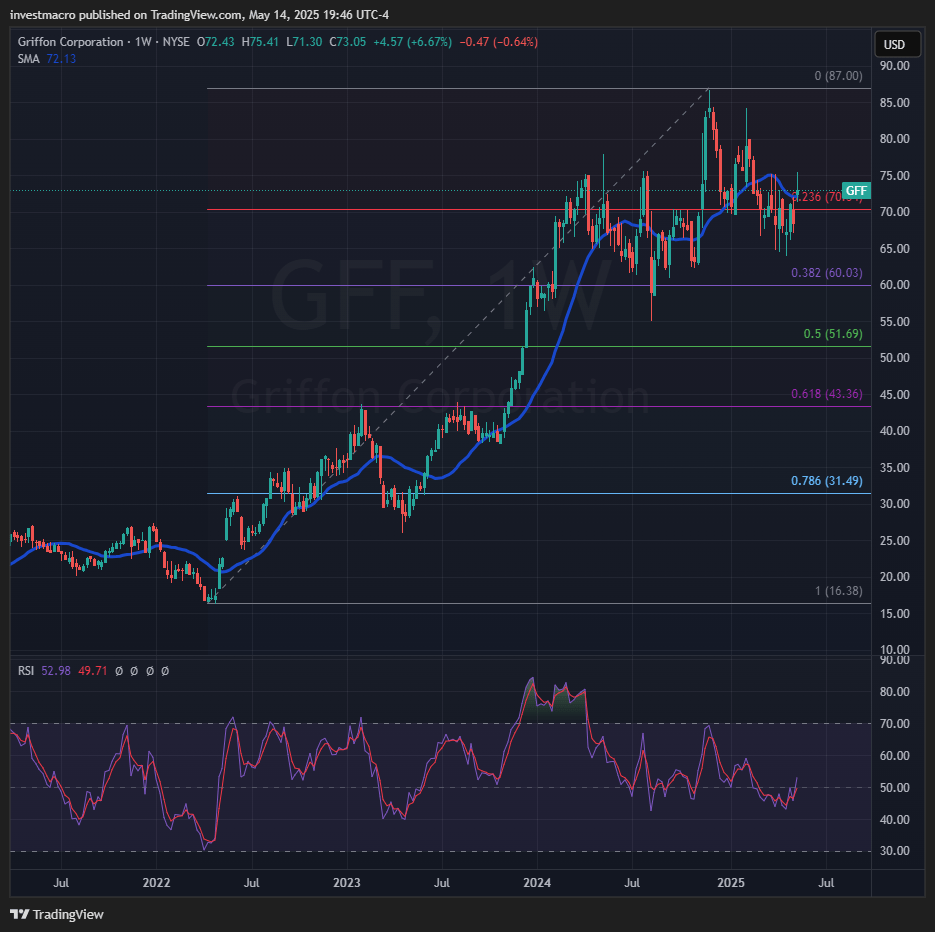
Griffon Corporation Price Performance:
– Uptrend since 2022
– Trades above 0.236 fibonacci retracement level (2020 to present)
– Up 2.50% year to date
– Up 3.60% in the last month
Company Description (courtesy of SEC.gov):
Griffon Corporation, through its subsidiaries, provides consumer and professional, and home and building products in the United States, Europe, Canada, Australia, and internationally. Company Website: https://www.griffon.com
Asset vs Sector Benchmark: *P/E Ratio (TTM) *52-Week Price Return – Stock: Griffon Corporation (GFF) 15.45 3.26 – Benchmark Symbol: XLI 24.51 12.01
* Data through May 14, 2025
TEGNA Inc. (TGNA):

TEGNA Inc. (Symbol: TGNA) was recently added to our Cosmic Rays WatchList. TGNA scored a 61 in our fundamental rating system on May 9th, 2025.
At time of writing, only 4.43% of stocks have scored a 60 or better out of a total of 12,949 scores in our earnings database. This stock has made our Watchlist a total of 4 times and rose by 25 system points from our last update.
TGNA is a Small-Cap stock and part of the Communication Services sector. The industry focus for TGNA is Broadcasting.
Tenga:
– P.E. ratio: 6.26
– Dividend ratio: slightly under 3%
– Dividend payout ratio: around 18%
– Beaten analysts’ expectations for four quarters
– EPS, P.E., and 5-year P.E. average below the industry average
Price Performance:
– Down 4% year-to-date
– Trading off the April lows
– Up over 13% in the last month
– Trades above 0.50 fibonacci retracement level (2020 to present)
Company Description (courtesy of SEC.gov):
TEGNA Inc. operates as a media company in the United States. The company operates television stations that deliver television programming and digital content. It offers news content to consumers across various platforms, including online, mobile, and social platforms; owns and operates multicast networks under the names True Crime Network, Quest, and Twist that offer on-demand episodes of shows; and operates VAULT Studios, which provides True Crime Network and Quest. Company Website: https://www.tegna.com
Asset vs Sector Benchmark: *P/E Ratio (TTM) *52-Week Price Return – Stock: TEGNA Inc. (TGNA) 6.26 16.93 – Benchmark Symbol: XLC 19.09 20.18
* Data through May 14, 2025
By InvestMacro – Be sure to join our stock market newsletter to get our updates and to see more top companies we add to our stock watch list.
All information, stock ideas and opinions on this website are for general informational purposes only and do not constitute investment advice. Stock scores are a data driven process through company fundamentals and are not a recommendation to buy or sell a security. Company descriptions provided by sec.gov.