By JustMarkets
The EUR/USD currency pair
- Prev Open: 1.0202
- Prev Close: 1.0353
- % chg. over the last day: +1.48 %
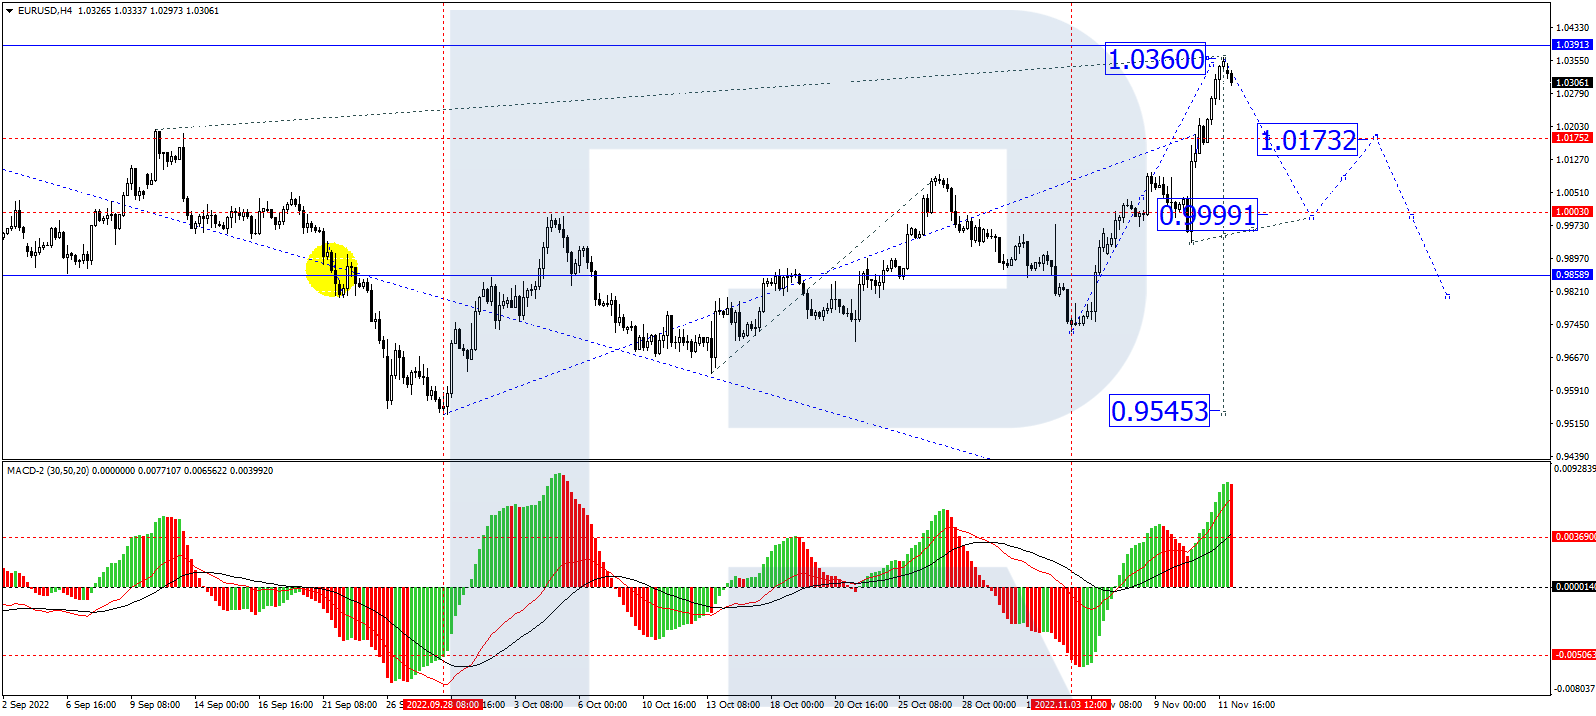
Dollar weakness on Friday continued Thursday’s move after US Consumer Inflation fell to an annualized 7.7% in October, the lowest since the beginning of the year. This strengthens the argument that the Federal Reserve will reduce the pace of interest rate hikes. But reducing the rate of increase is not “easing,” with the difference in interest rates between the ECB and the US Fed remaining substantial. According to analysts, the technical correction is coming to an end, and the dollar will once again find a new buying interest soon.
- Support levels: 1.0194, 1.0092, 1.0043, 0.9993, 0.9838, 0.9794, 0.9755
- Resistance levels: 1.0363, 1.0411, 1.0504
From the technical point of view, the trend on the EUR/USD currency pair on the hourly time frame is bullish. The price is trading above the moving averages, and the MACD indicator is in the positive zone, but the price has deviated strongly from the averages. For buy deals, it is best to wait for a corrective movement to the support levels of 1.0194 or 1.0092, but with additional confirmation. Sell deals can be considered from the resistance level of 1.0363, but it’s better with confirmation in the form of a reverse initiative.
Alternative scenario: if the price breaks down through the support level of 0.9993 and fixes below it, the downtrend will likely resume.

- – Eurozone Industrial Production (m/m) at 12:00 (GMT+2);
- – US FOMC Member Brainard Speaks at 18:30 (GMT+2).
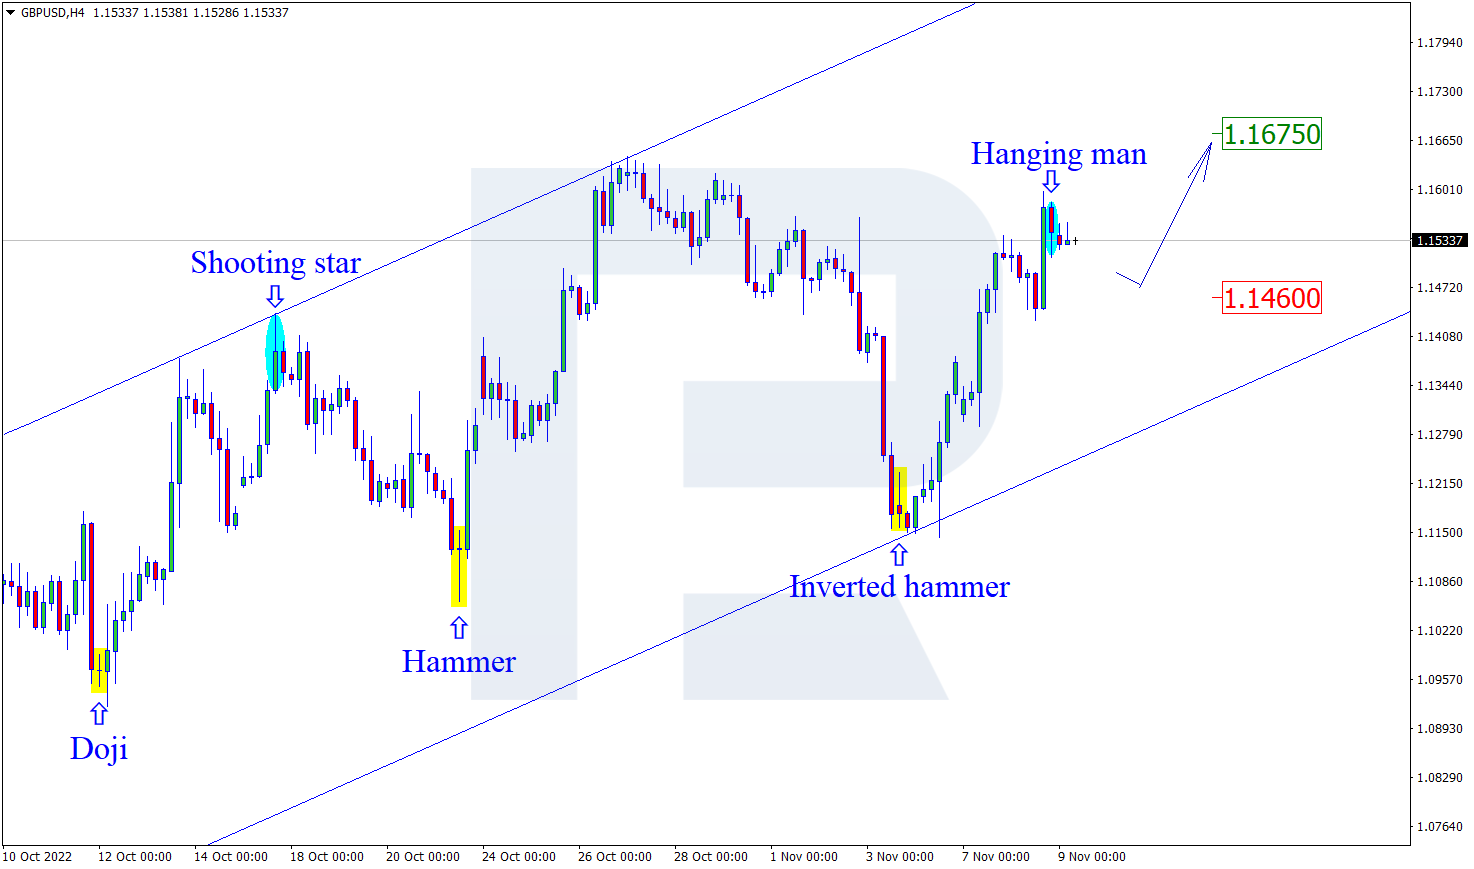
The GBP/USD currency pair
- Prev Open: 1.1704
- Prev Close: 1.1832
- % chg. over the last day: +1.01 %
UK GDP fell sharply by 0.6% in the third quarter (against expectations of 0.1%). Analysts predict that this is the beginning of a recession for the UK and expect GDP to fall 2% by summer 2023. However, much depends on how the government’s energy support develops during this period. As winter approaches, analysts expect tensions between the manufacturing, construction, and industrial sectors to increase. But much will depend on Thursday’s budget announcement this week. The focus will be on how the chancellor closes the projected budget deficit in 2026/27 and how the government will make its energy support more targeted to make policy less costly.
- Support levels: 1.1684, 1.1476, 1.1418, 1.1231, 1.1172, 1.1093, 1.0915, 1.0817
- Resistance levels: 1.1848, 1.1901
From the technical point of view, the GBP/USD currency pair trend on the hourly time frame is bullish. The price is trading above the moving averages. The MACD indicator is in the positive zone, but the first signs of divergence have appeared. Under such market conditions, it is better to look for buy deals after a slight correction to the support levels of 1.1684 or 1.1476. It is best to look for sell deals from the resistance level of 1.1848, but better with a confirmation in the form of a reverse initiative.
Alternative scenario: if the price breaks down from the 1.1418 support level and fixes below it, the downtrend will likely resume.

The USD/JPY currency pair
- Prev Open: 140.96
- Prev Close: 138.76
- % chg. over the last day: -1.58 %
The Bank of Japan should revise its inflation target and gradually abandon negative rates and radical yield restriction policies to reduce the rising cost of prolonged monetary policy easing, said Yuri Okina, a key government commissioner and possible future BOJ governor. Mrs. Okina also added that the Bank of Japan should steer a course toward policy normalization over the long term. With Consumer Prices forecast to rise later this week, the Bank of Japan is getting closer to abandoning its soft monetary policy. But the situation will likely remain the same until the end of the year.
- Support levels: 138.78, 137.65, 136.80
- Resistance levels: 138.78, 137.65, 136.80
From the technical point of view, the medium-term trend on the currency pair USD/JPY is bearish. The price is trading below the moving averages. The MACD indicator is deeply negative, and there are signs of overselling and divergence, which shows the weakness of sellers. Under such market conditions, buy trades can be sought on intraday time frames from the support level of 138.78, but only with a confirmation in the form of a false breakdown. Sell deals can be searched from the resistance level of 140.55, but only with additional confirmation.
Alternative scenario: If the price fixes above 146.06, the uptrend will likely resume.

The USD/CAD currency pair
- Prev Open: 1.3320
- Prev Close: 1.3252
- % chg. over the last day: -0.51 %
The Canadian dollar is a commodity currency and depends on factors such as the monetary policy of the Bank of Canada, the performance of the dollar index, and the oil price movement. Oil prices rose nearly 1% on Monday, continuing Friday’s gains as China eased some of its strict COVID-19 restrictions, raising hopes for a rebound in economic activity and demand from the world’s largest oil importer. Rising oil prices tend to strengthen the Canadian currency.
- Support levels: 1.3212
- Resistance levels: 1.3369, 1.3508, 1.3608, 1.3682, 1.3776, 1.3855, 1.3968
From the point of view of technical analysis, the trend on the USD/CAD currency pair is bearish. The MACD indicator is in the negative zone, but there is a divergence, and the price is in front of the support level. The best way to sell is to consider the resistance level of 1.3369. Still, there is a lot of space before this level, so buy trades are very appropriate and should be considered on the lower time frames from the support level of 1.3212, but with an additional confirmation in the form of a reverse initiative.
Alternative scenario: if the price breaks out and consolidates above the resistance level of 1.3607, the uptrend will likely resume.

By JustMarkets
This article reflects a personal opinion and should not be interpreted as an investment advice, and/or offer, and/or a persistent request for carrying out financial transactions, and/or a guarantee, and/or a forecast of future events.