Archive for Forex and Currency News – Page 334

Fibonacci Retracements Analysis 09.12.2020 (GBPUSD, EURJPY)

Article By RoboForex.com

GBPUSD, “Great Britain Pound vs US Dollar”

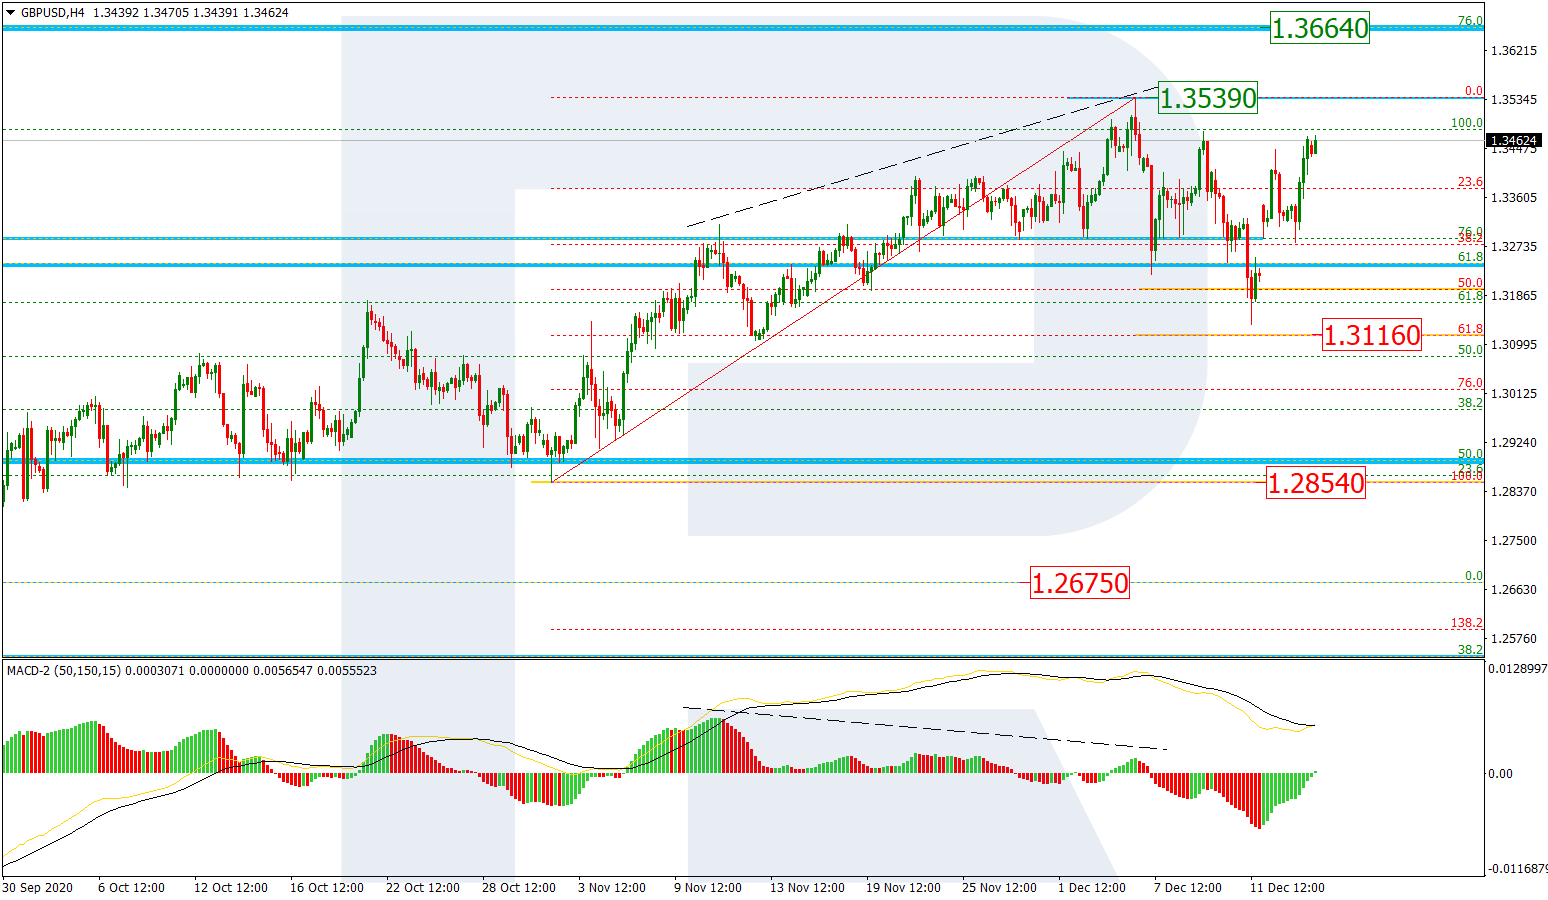
On H4, the market renewed the last important high of 1.3482, but after a divergence the quotations started pulling back. When the correction is over, the growth might resume to the long-term level of 76.0% (1.3664) and then – to the post-correctional extension area of 138.2-161.8% (1.3792-1.3980) Fibo. The local resistance is at 1.3539.

GBPUSD_H4
Risk Warning: the result of previous trading operations do not guarantee the same results in the future

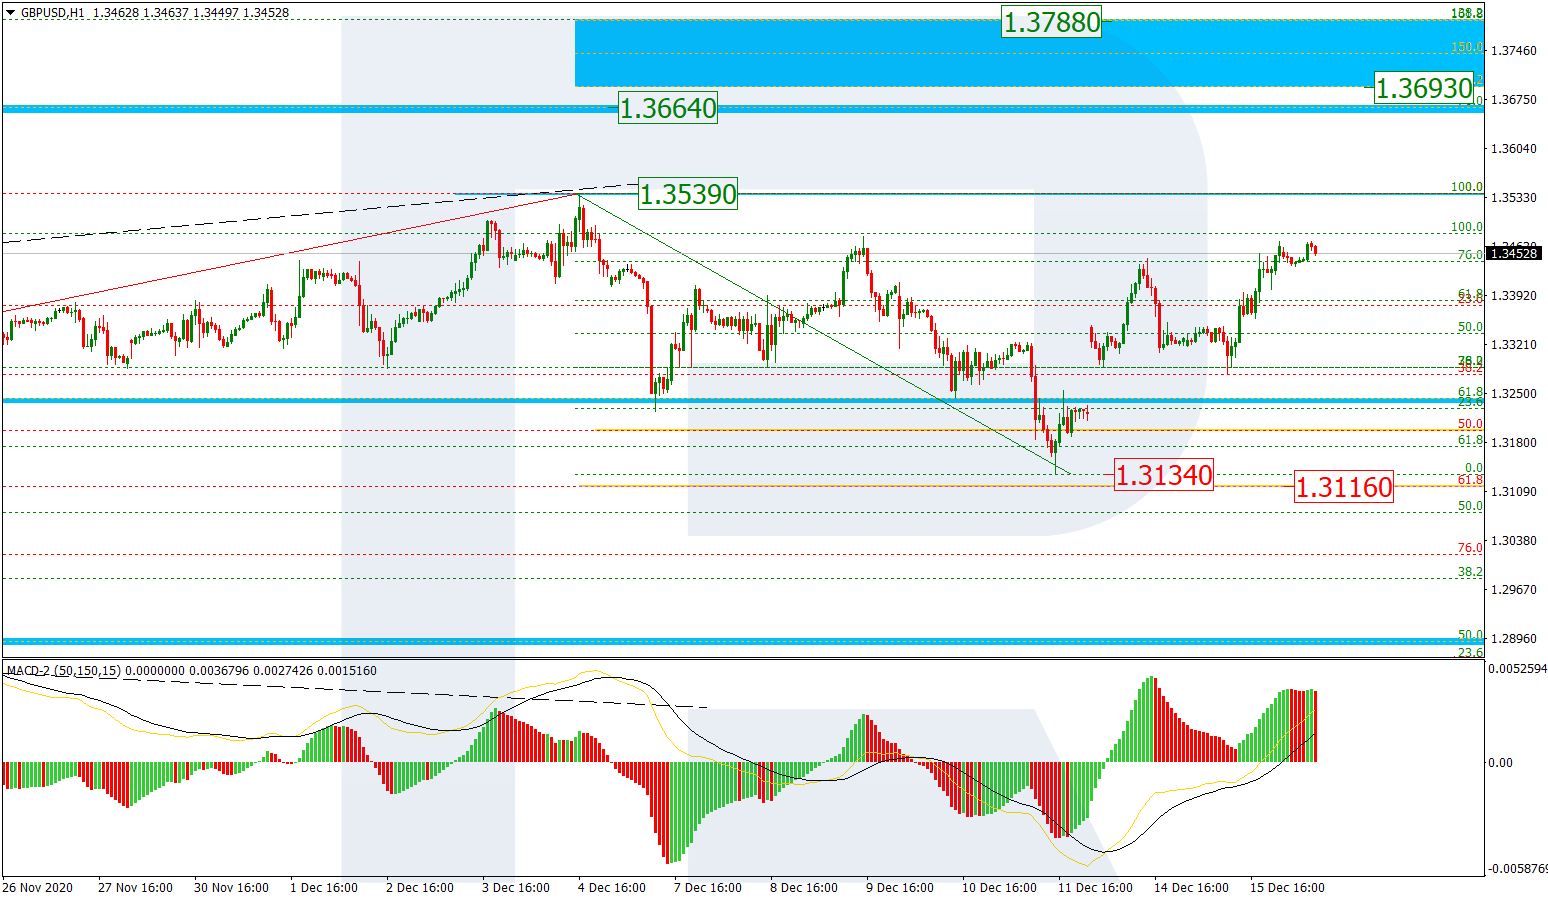
On H1, we can see a correctional phase beginning. The first fast impulse of decline has reached 38.2% Fibo. Further falling might be aimed at 50.0% (1.3196) and 61.8% (1.3115), but the correctional growth we see might turn into a full-scale new wave of growth aiming above the peak of 1.3539.

GBPUSD_H1
Risk Warning: the result of previous trading operations do not guarantee the same results in the future

EURJPY, “Euro vs Japanese Yen”

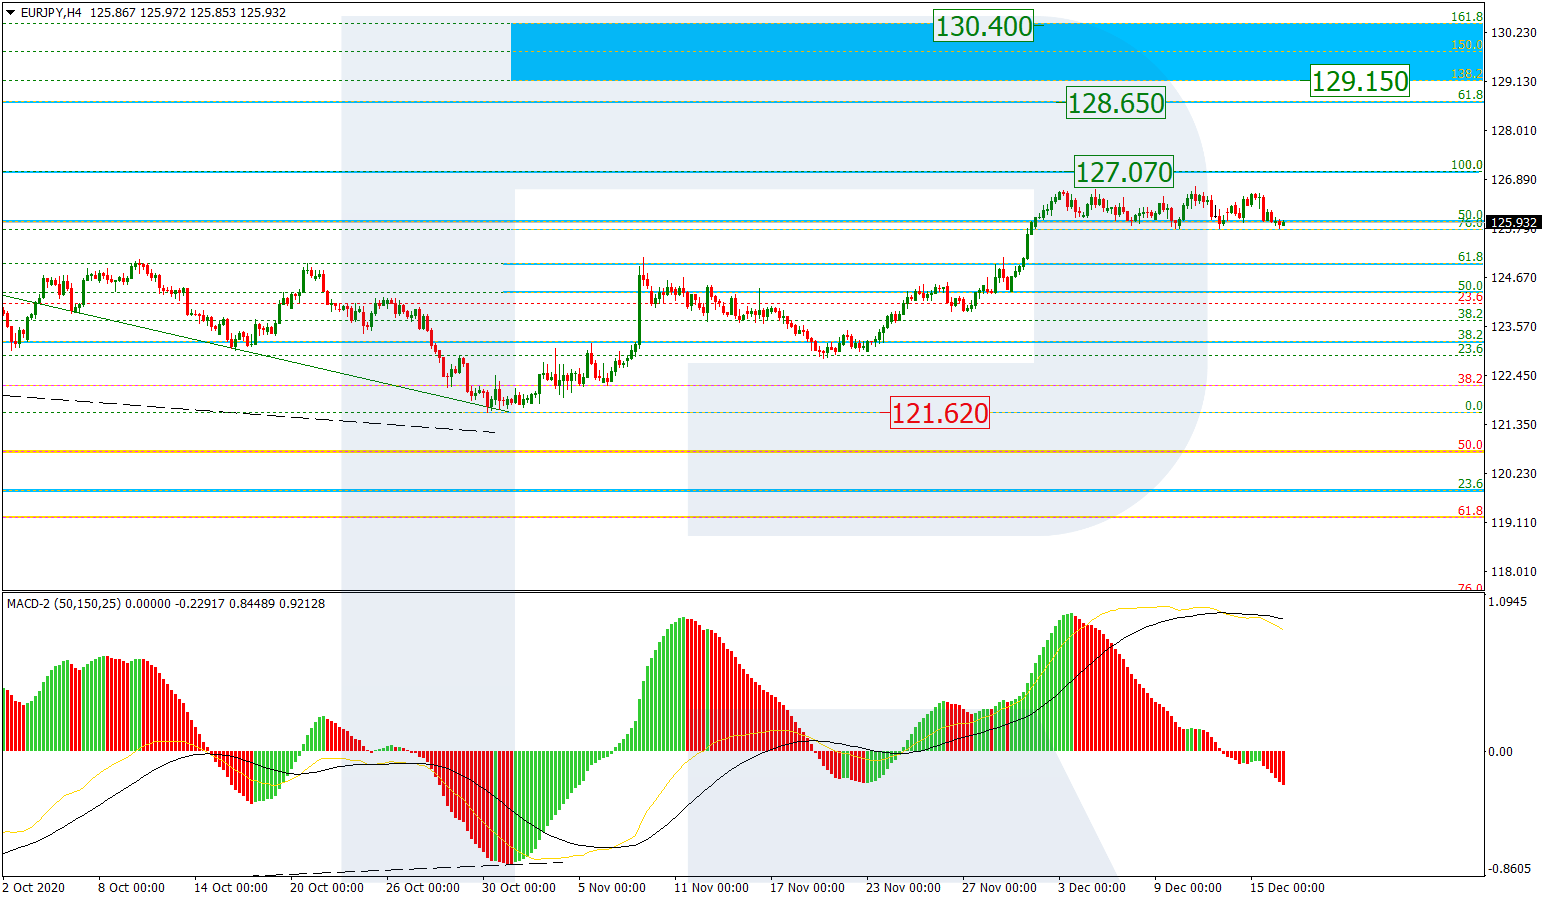
On H4, the wave of growth has stopped developing near the high of 127.07. After this high is broken, the quotations might rise to the medium-term level of 61.8% (128.65), and after it is broken – to the upper post-correctional extension range of 138.2-161.8% (129.15-130.40) Fibo. The main support is at the fractal low of 121.62.

EURJPY_H4
Risk Warning: the result of previous trading operations do not guarantee the same results in the future

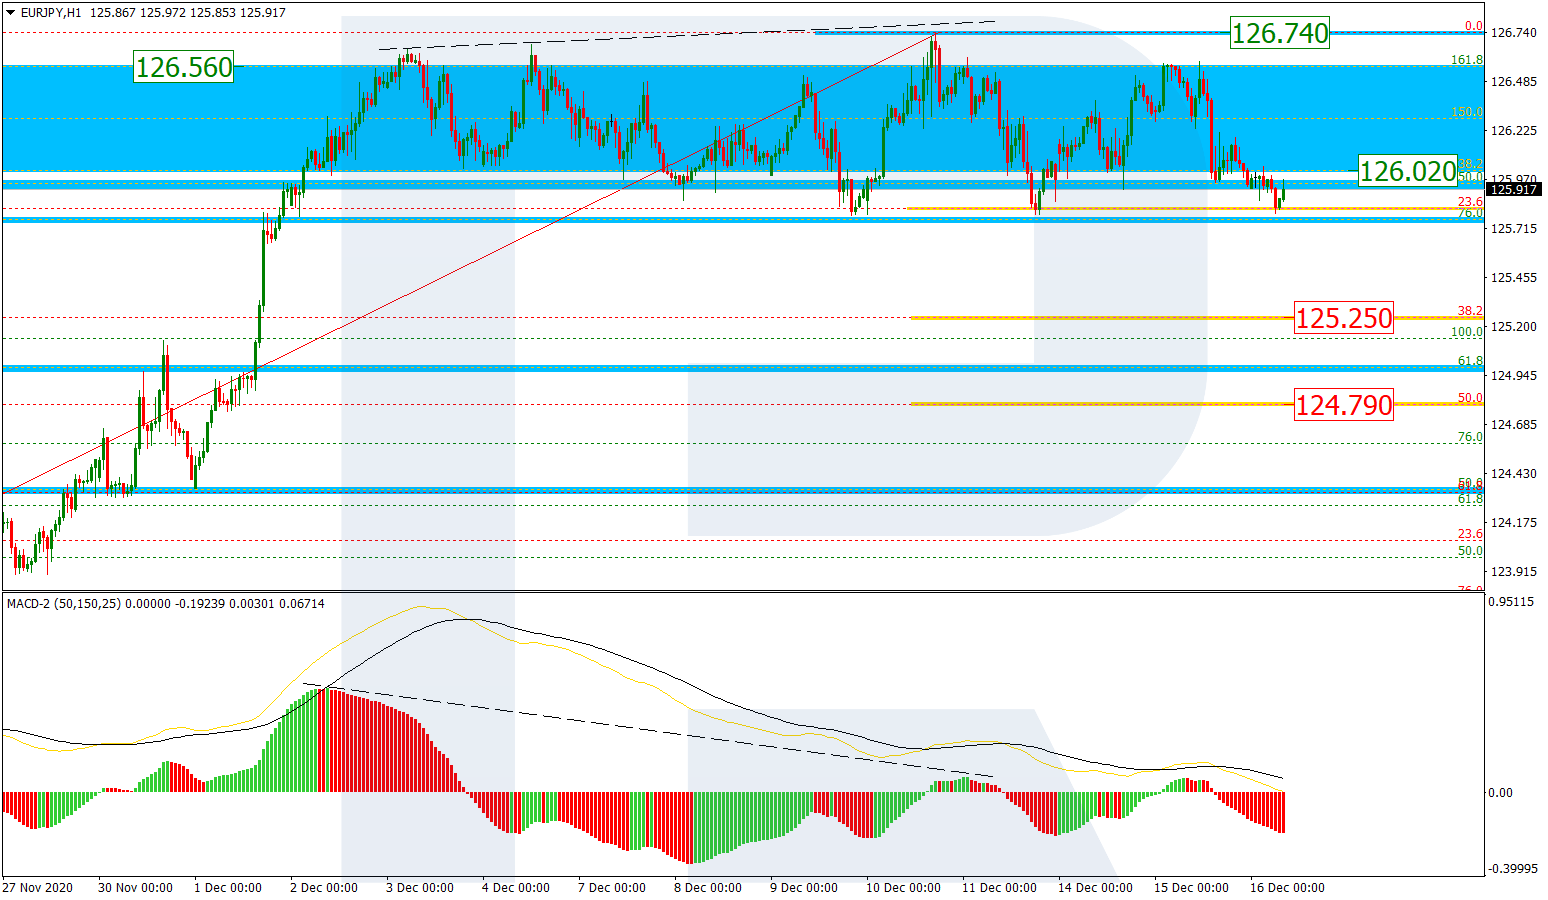
On H1, the pair demonstrates sideways correctional dynamics inside a short-term local post-correctional extension area of 138.2-161.8% (126.02-126.56) Fibo. Then we expect a breakaway of the upper border of the current flat and a rise to the high of 127.07.

EURJPY_H1

Article By RoboForex.com

Attention!
Forecasts presented in this section only reflect the author’s private opinion and should not be considered as guidance for trading. RoboForex LP bears no responsibility for trading results based on trading recommendations described in these analytical reviews.

Ichimoku Cloud Analysis 09.12.2020 (GOLD, CADJPY, NZDUSD)

Article By RoboForex.com

XAUUSD, “Gold vs US Dollar”

GOLD is trading at 1859 above the Ichimoku Cloud, suggesting an uptrend. A test of the lower border of the Cloud at 1850 is expected, followed by growth to 1900. An additional signal supporting the growth can be a bounce off the lower border of the ascending channel. The scenario can be canceled by a breakaway of the lower border of the Cloud and securing under 1835, which will entail further falling to 1805.

XAUUSD
Risk Warning: the result of previous trading operations do not guarantee the same results in the future

CADJPY, “Canadian Dollar vs Japanese Yen”

The currency pair is trading at 81.36 above the Ichimoku Cloud, suggesting an uptrend. A test of the signal lines of the indicator at 81.10 is expected, followed by growth to 82.25. An additional signal supporting the growth can be a bounce off the lower border of the ascending channel. The scenario can be canceled by a breakaway of the lower border of the Cloud and securing under 79.85, which will entail further falling to 79.05.

CADJPY
Risk Warning: the result of previous trading operations do not guarantee the same results in the future

NZDUSD, “New Zealand Dollar vs US Dollar”

The currency pair is trading at 0.7066 above the Ichimoku Cloud, suggesting an uptrend. A test of the upper border of the Cloud at 0.7055 is expected, followed by growth to 0.7195. An additional signal supporting the growth can be a bounce off the lower border of the ascending channel. The scenario can be canceled by a breakaway of the lower border of the Cloud and securing under 0.6975, which will entail further falling to 0.6895.

NZDUSD

Article By RoboForex.com

Attention!
Forecasts presented in this section only reflect the author’s private opinion and should not be considered as guidance for trading. RoboForex LP bears no responsibility for trading results based on trading recommendations described in these analytical reviews.
Extreme market volatility on the horizon?

By Lukman Otunuga, Research Analyst, ForexTime

Fasten your seatbelts and brace for potential volatility over the next few days!

Investors have been juggling with conflicting themes since the start of the week. On one side of the equation, surging coronavirus cases in the United States and US-China tensions promoted caution. However, hopes for a stimulus deal and positive news on the Covid-19 vaccine sweetened risk appetite.

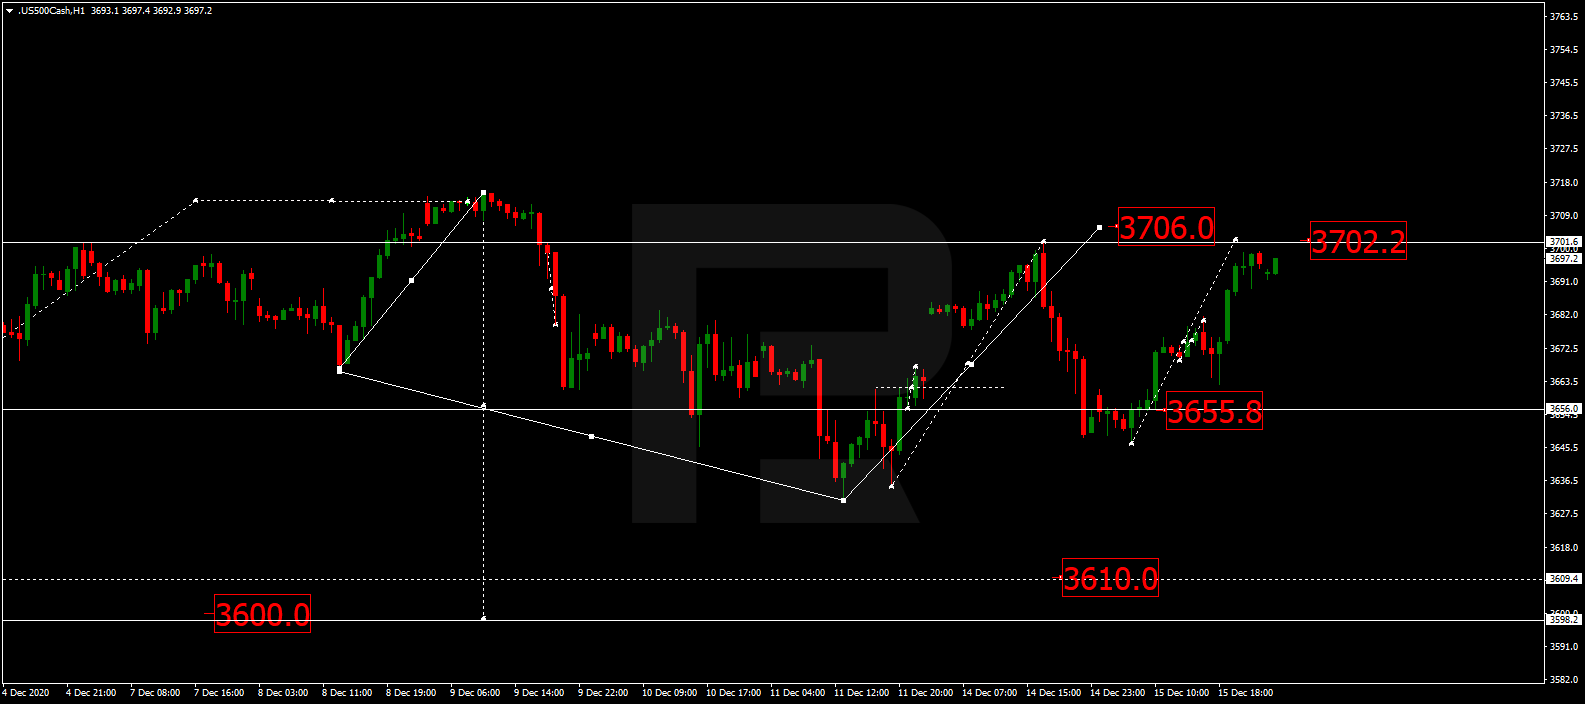
Although the risk pendulum has swung back and forth this week, the mood across markets is positive this morning with Asian shares marching to fresh record highs. European markets are looking pretty while US futures are green after the S&P 500 closed above 3,700 for the first time in history. While the stimulus charmed life could inject equity bulls with further confidence, there a couple of key events that could spoil the party, spark volatility, and dampen the mood.

In the United Kingdom, all eyes will be on Prime Minister Boris Johnson as he gets suited and booted for an 11th-hour dinner with the European commission president, Ursula von der Leyen on Wednesday. Considering how the future of Britain’s relationship with the rest of Europe may hang on the success of this three-course meal, it is a big deal for the Pound and UK economy.

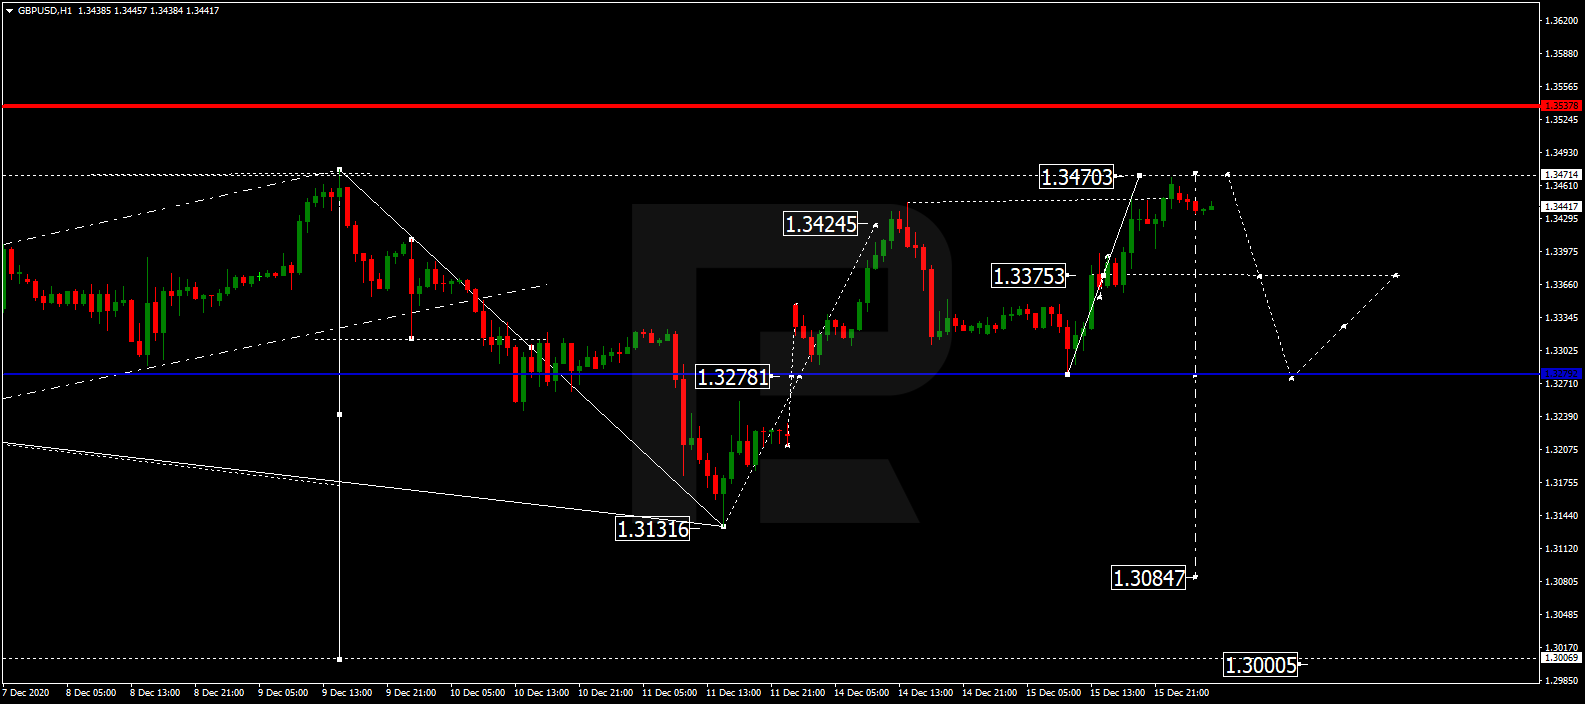
Talking technicals, the GBPUSD remains bullish on the weekly charts. Key levels of interest can be found at 1.3200, 1.3300, 1.3482.

Euro set to extend gains?

Traveling to Europe, the European Central Bank (ECB) meeting and EU summit on Thursday could inject more life into the Euro. The ECB is expected to ease policy but the major question is what form will the stimulus take. Markets project the central bank to increase its Pandemic Emergency Purchase Programme to 1.8 trillion euros from 1.35 trillion euros, while potentially extending the program by six months.

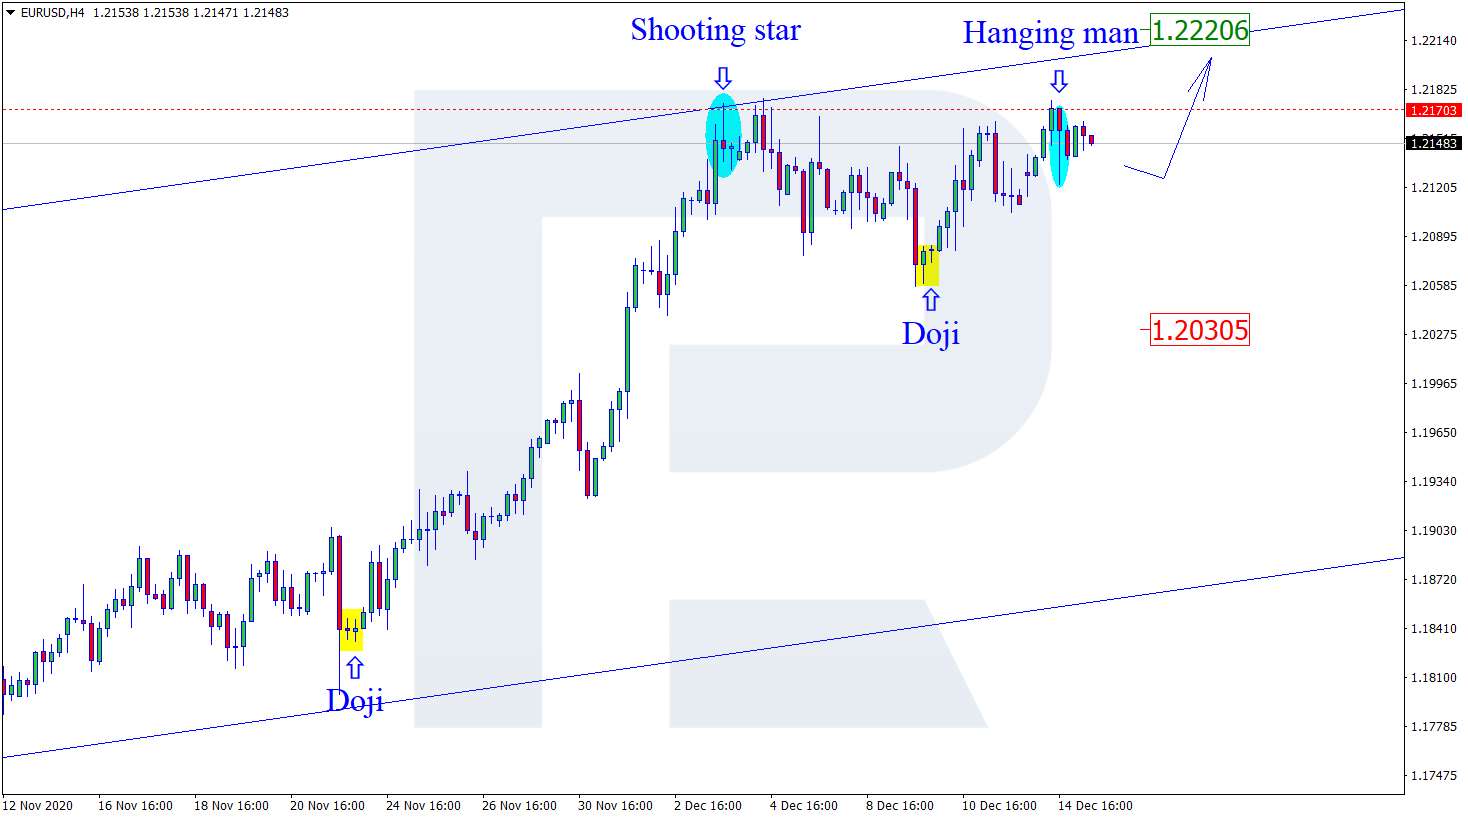
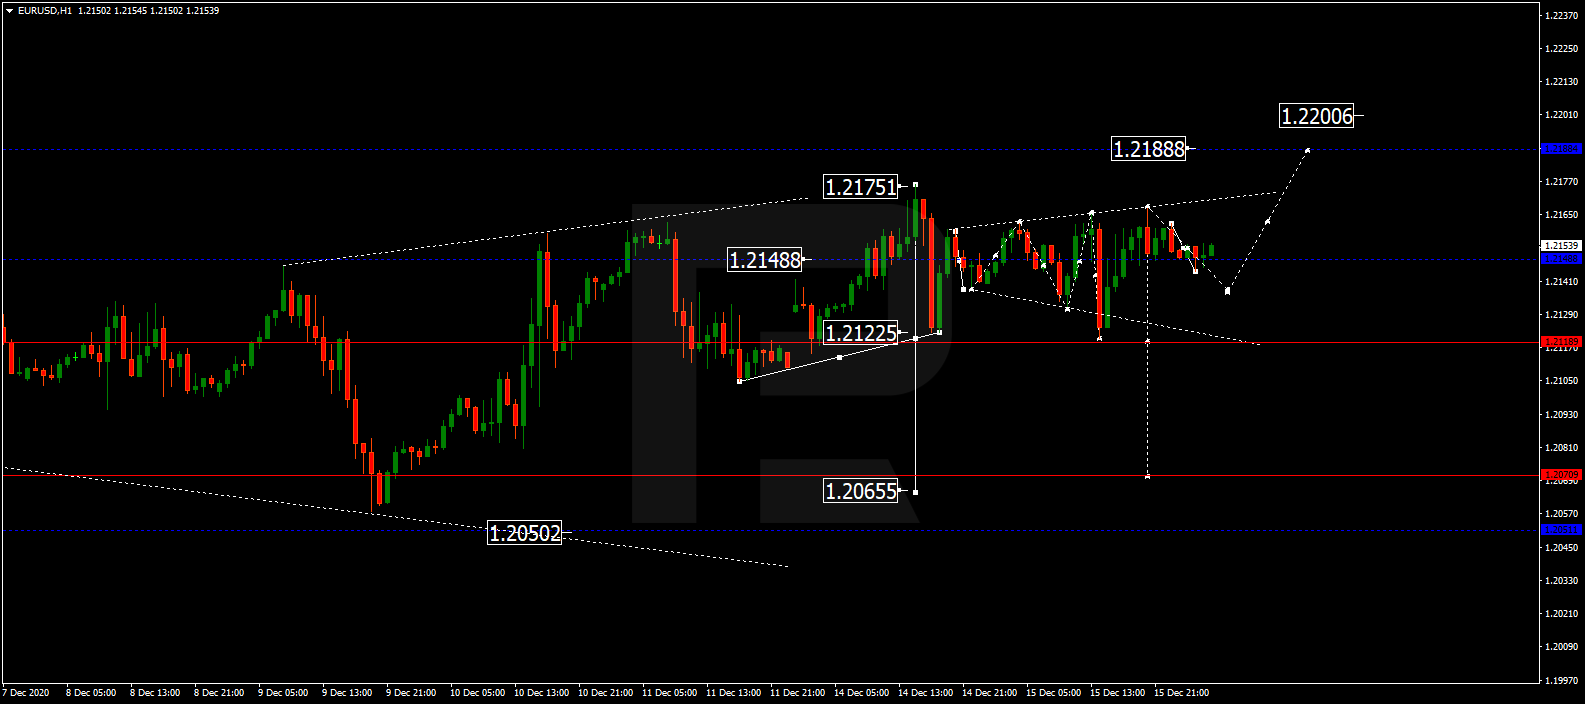
Looking at the charts, the EURUSD is firmly bullish. A solid daily close above 1.2175 could open a path towards 1.2300.

Keep a look out for US inflation

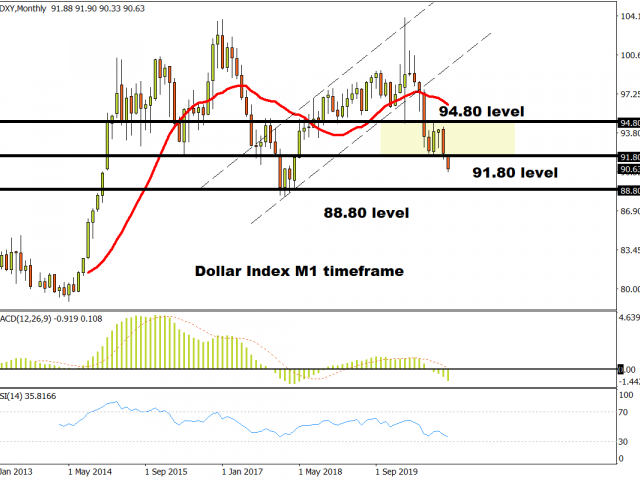
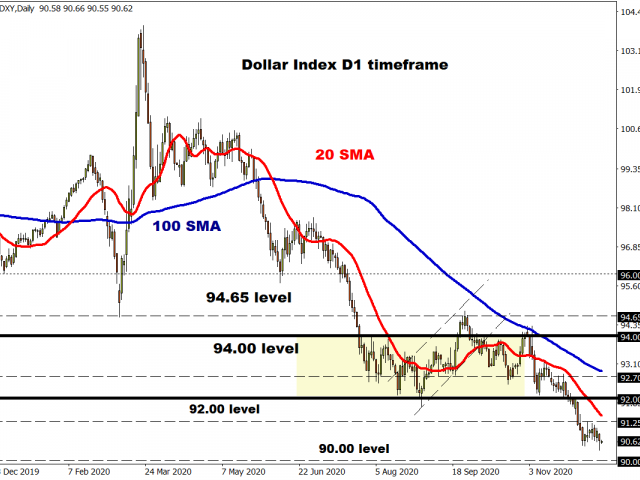
Across the Atlantic, the latest US inflation figures will be in focus on Thursday. Inflation is forecast to cool 1.1% from 1.2% in October while core inflation is expected to remain unchanged at 1.6%. Taking a quick look at the Dollar Index, bears remain in control with sustained weakness below 91.00 opening a path towards 90.00.

Let’s not forget about Gold…

The $1850 resistance could transform into dynamic support. This may open the doors towards $1900. Should prices slip back under $1850, prices are seen declining towards $1815.

Disclaimer: The content in this article comprises personal opinions and should not be construed as containing personal and/or other investment advice and/or an offer of and/or solicitation for any transactions in financial instruments and/or a guarantee and/or prediction of future performance. ForexTime (FXTM), its affiliates, agents, directors, officers or employees do not guarantee the accuracy, validity, timeliness or completeness, of any information or data made available and assume no liability as to any loss arising from any investment based on the same.


Forex-Time-LogoArticle by ForexTime

ForexTime Ltd (FXTM) is an award winning international online forex broker regulated by CySEC 185/12 www.forextime.com

Fibonacci Retracements Analysis 08.12.2020 (EURUSD, USDJPY)

Article By RoboForex.com

EURUSD, “Euro vs US Dollar”

On H4, the quotations overcame the long-term high of 1.2011 and paused in the uptrend. The pair might be on the verge of a descending correction. When it is over, we can expect a new wave of growth to a post-correctional extension range of 138.2-161.8% (1.2167-1.2262) Fibo. The main support is at the fractal level of 1.1603.

EURUSD_H4
Risk Warning: the result of previous trading operations do not guarantee the same results in the future

На 1-часовом графике EURUSD можно рассмотреть начало нисходящей коррекции после дивергенции на MACD. Первая волна спада нацелена на уровень 23,6% по шкале Фибоначчи (1,2043), а следующая может направиться к уровням 38,2% (1,1958) и 50,0% (1,1890). Прорыв максимума на 1,2178 станет сигналом продолжения восходящей тенденции.

EURUSD_H1
Risk Warning: the result of previous trading operations do not guarantee the same results in the future

USDJPY, “US Dollar vs Japanese Yen”

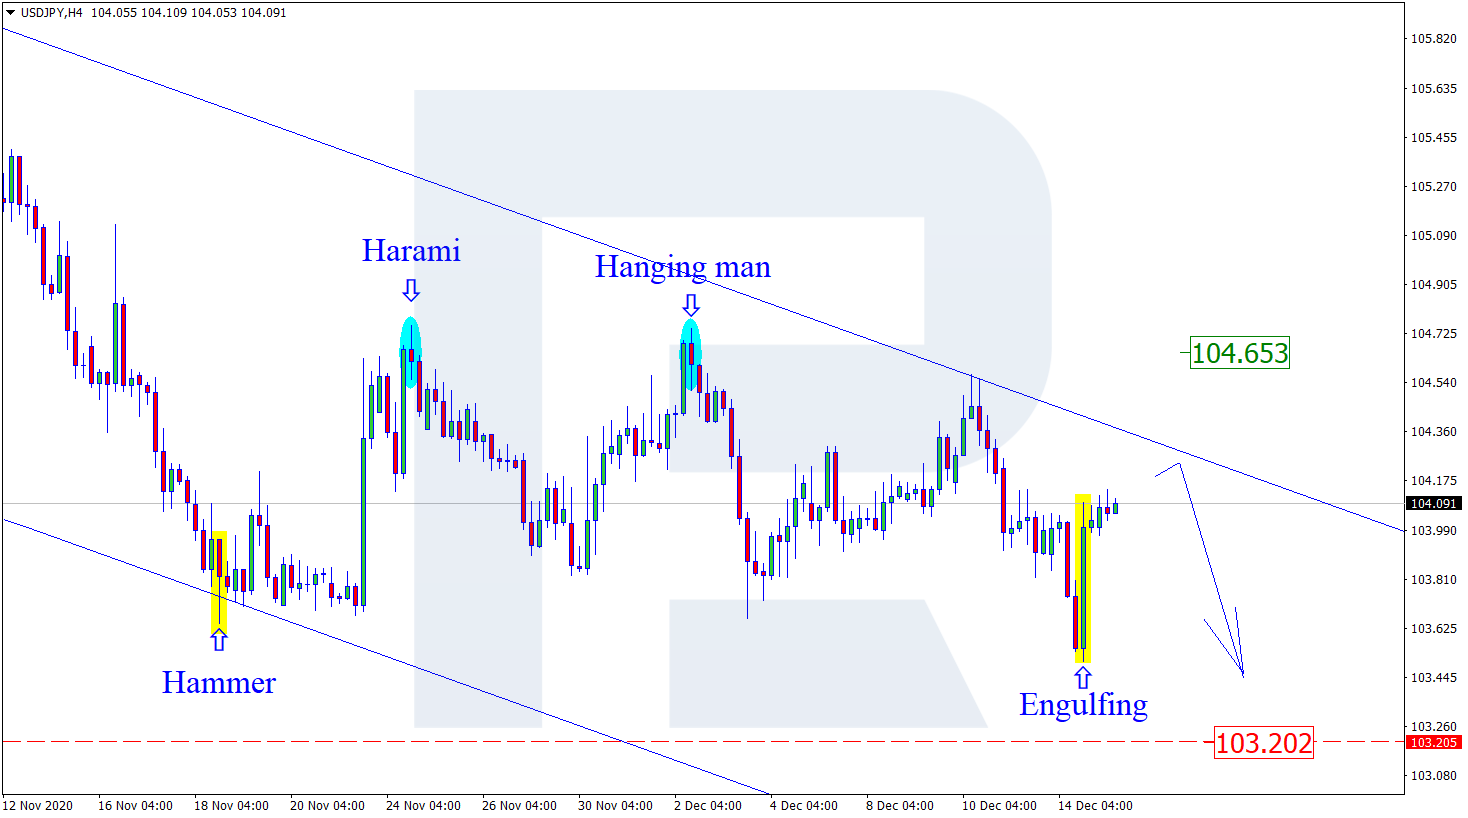
On H4, the technical picture of the pair has hardly changed since a week ago. The pair keeps forming a consolidation channel. As long as there is a convergence on the MACD, we can expect the market to be preparing another wave of growth to 38.2% (106.43), 50.0% (107.44) Fibo. The main support is at 103.17, a breakaway of which will open a pathway down to the fractal low of 101.18.

USDJPY_H4
Risk Warning: the result of previous trading operations do not guarantee the same results in the future

On H1, there is a sideways movement going between 61.8% (104.91) and the low of 103.65. A breakaway of the highs might open a pathway to 76.0% (105.19) and the fractal level of 105.68. A breakaway of the local low at 103.65 might let the quotations decline to the main low of 103.17.

USDJPY_H1

Article By RoboForex.com

Attention!
Forecasts presented in this section only reflect the author’s private opinion and should not be considered as guidance for trading. RoboForex LP bears no responsibility for trading results based on trading recommendations described in these analytical reviews.
Murrey Math Lines 08.12.2020 (AUDUSD, NZDUSD)

Article By RoboForex.com

AUDUSD, “Australian Dollar vs US Dollar”

On H4, the quotations are trading above the 200-days Moving Average, indicating an uptrend. We expect a breakaway of 6/8 and further growth of the quotations to the resistance level of 8/8. The scenario might be canceled by a breakaway of 5/8 top-down, which will drive the price down to the support at 4/8.

AUDUSD_H4
Risk Warning: the result of previous trading operations do not guarantee the same results in the future

On M15, a breakaway of the upper border of the VoltyChannel indicator will additionally support the growth.

AUDUSD_M15
Risk Warning: the result of previous trading operations do not guarantee the same results in the future

NZDUSD, “New Zealand Dollar vs US Dollar”

On H4, the quotations are trading above the 200-days Moving Average and near 6/8. A breakaway of this level might catalyze further growth to the resistance level at 8/8. This scenario might be canceled by a breakaway of the support at 5/8. In this case, the quotations might decline to 4/8.

NZDUSD_H4
Risk Warning: the result of previous trading operations do not guarantee the same results in the future

On M15, a breakaway of the upper border of VoltyChannel will increase the probability of the growth of the price.

NZDUSD_M15

Article By RoboForex.com

Attention!
Forecasts presented in this section only reflect the author’s private opinion and should not be considered as guidance for trading. RoboForex LP bears no responsibility for trading results based on trading recommendations described in these analytical reviews.
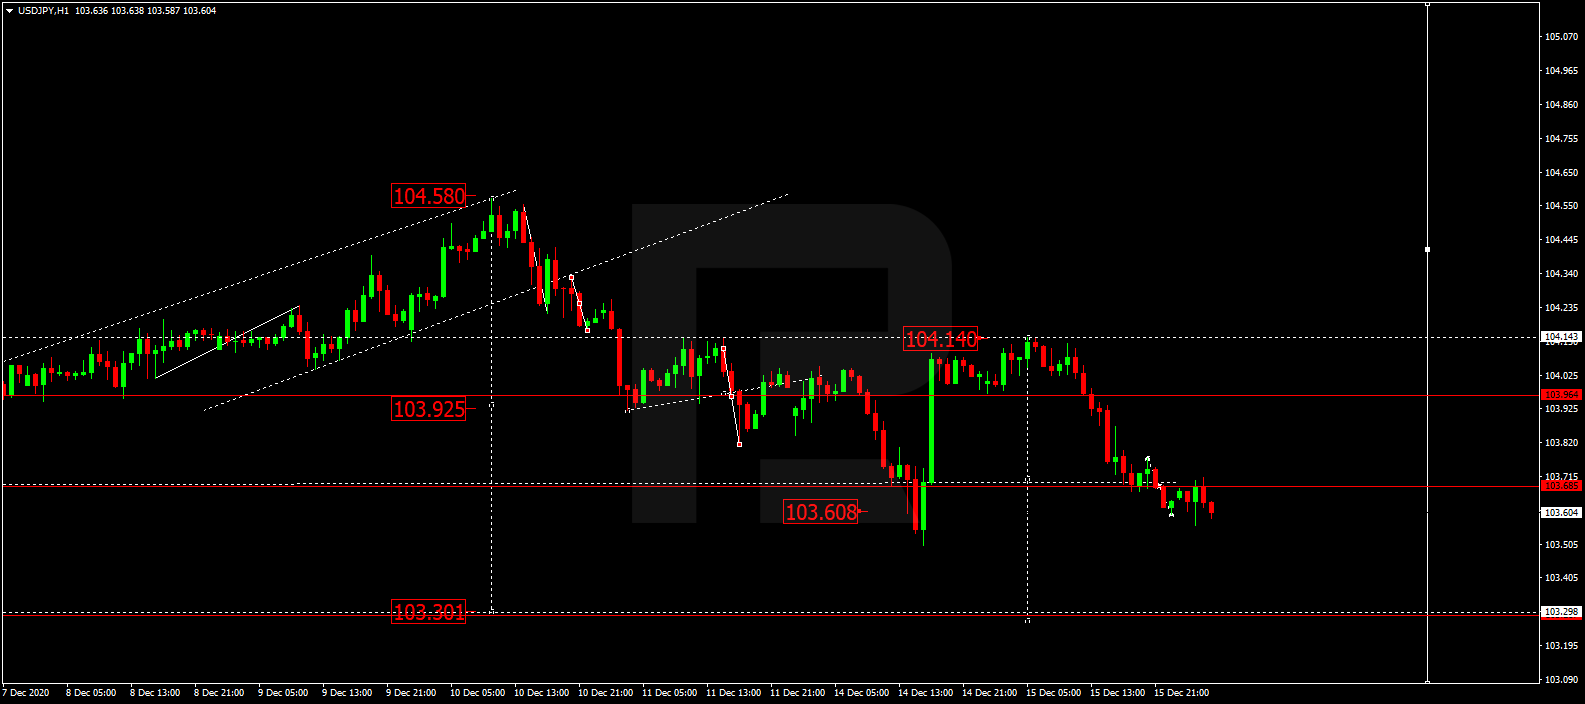
Risk sentiment tainted with pandemic concerns

By Lukman Otunuga, Research Analyst, ForexTime

Caution may be the name of the game on Tuesday as surging coronavirus infections across the United States whack risk sentiment and drain investor confidence.

Asian stocks are already positioned to conclude today’s session on a mixed note thanks to the growing anxiety over a surge in COVID-19 infections. Given how renewed tensions between the United States and China will probably compound to the growing list of negative themes fuelling risk aversion, equity bulls could be missing in action. For those who need further confirmation, just take a look at the futures markets – both European and US indices are in the red.

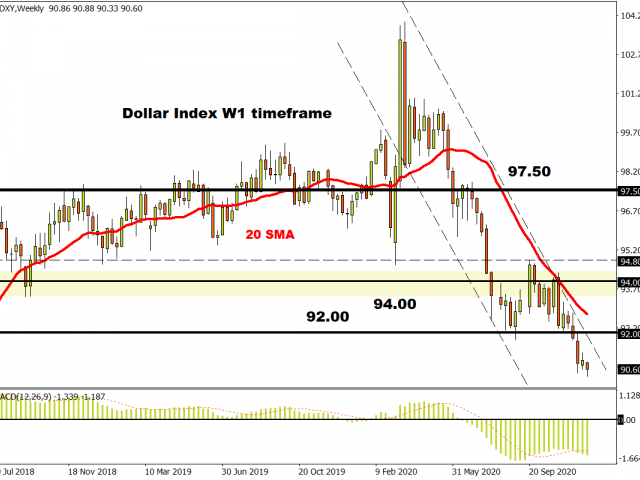
As the coronavirus menace spreads its poisonous tentacles across the largest economy in the world, investors are increasingly looking for a stimulus deal to be done. However, Republicans and Democratic have repeatedly failed to reach a middle ground with lawmakers set to postpone the Friday evening deadline for passing a bill. Considering the latest run of disappointing economic reports and how last week’s jobless data missed expectations, the absence of further stimulus is likely to weigh heavily on the US economy despite the vaccine optimsim.  Since we are speaking about the U.S. let us take a quick look at the Dollar Index. Prices remain under pressure on the daily charts as there have been consistently lower lows and lower highs. The daily close below 91.00 may signal a further decline towards 90.00. Should prices push back above 91.00, the next key levels of interest may be found at 92.00 and 92.70.

In the United Kingdom, all eyes remain on the latest Brexit developments. After being smashed by uncertainty, Sterling pared overnight losses as the U.K. backed down from a threat to walk away from Brexit talks. UK Prime Minister Boris Johnson is set to travel to Brussels for critical talks with European Commission President Ursula von der Leyen. As the clock ticks down to the official transition deadline on the 31st of December, time is running out for a trade deal. These fears and concerns may translate to more weakness on the British Pound. We normally talk about the GBPUSD, but this morning let us take a look at the EURGBP.

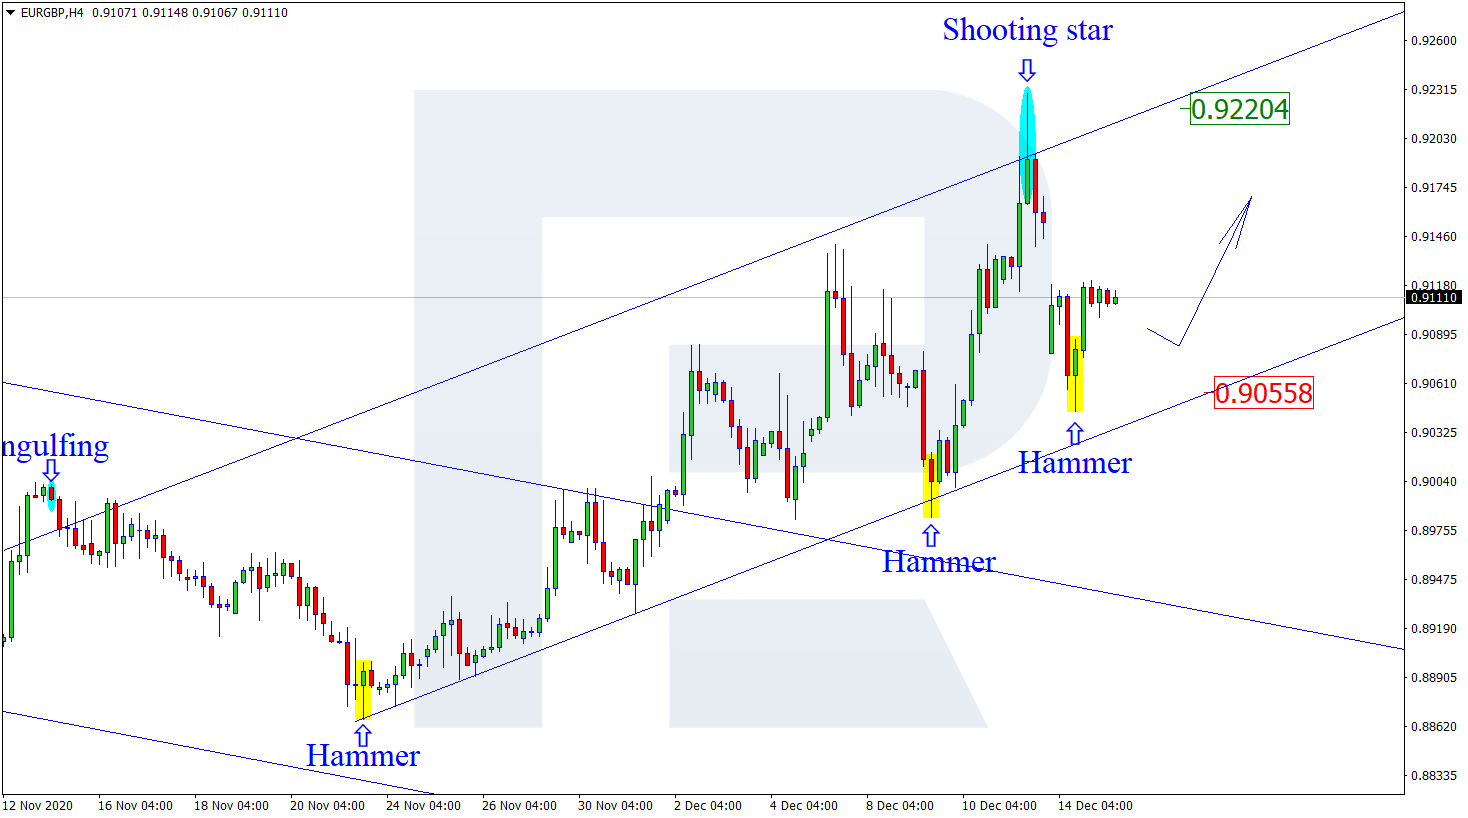
The first word that comes to mind when looking at the currency pair is choppy. It looks like bulls and bears fiercely battle to gain control on a day-to-day basis. Prices are currently trading above the 0.9000 support level while prices are trading above the 200 Simple Moving Average. A solid breakout above 0.9100 could trigger an incline towards 0.9260. Should 0.9000 prove to be unreliable support, the next key level of interest may be found around 0.8850.

Commodity spotlight: Gold

It looks like Gold bulls are back in the game. The daily close above $1850 signals further upside with $1900 acting as the next key point of interest. If prices end up slipping back under $1850, the precious metal could descend back towards $1815.

Disclaimer: The content in this article comprises personal opinions and should not be construed as containing personal and/or other investment advice and/or an offer of and/or solicitation for any transactions in financial instruments and/or a guarantee and/or prediction of future performance. ForexTime (FXTM), its affiliates, agents, directors, officers or employees do not guarantee the accuracy, validity, timeliness or completeness, of any information or data made available and assume no liability as to any loss arising from any investment based on the same.


Forex-Time-LogoArticle by ForexTime

ForexTime Ltd (FXTM) is an award winning international online forex broker regulated by CySEC 185/12 www.forextime.com

The Analytical Overview of the Main Currency Pairs on 2020.12.08

by JustForex

The EUR/USD currency pair

Technical indicators of the currency pair:
  • Prev Open: 1.2125
  • Prev Close: 1.2109
  • % chg. over the last day: -0.13%

On Monday, the EUR/USD price failed to bounce above the SMA 50 and SMA 100 averages. Having closed the day lower on the H1 timeframe, it is indicated that bears are still prevailing, and the southern pattern remains a priority on Tuesday. The MACD indicator is in the negative zone. Stochastic indicates short-term oversold, which states a pullback or consolidation around 1.2110.

Trading recommendations
  • Support levels: 1.2040, 1.1924
  • Resistance levels: 1.2175, 1.2167

The main scenario for trading EUR/USD is selling on growth. There is now a pullback after the first southern impulse. Fundamental and technical background continues to point more towards the south. Targets – 1.2040 intraday and 1.1924 mid-term.

Alternative scenario: if the price fixes above the level of 1.2135 on the H1 timeframe, the currency pair is likely to return to the growth to 1.2175.

EUR/USD
News feed for 2020.12.08:
  • – ZEW Economic Sentiment Index in Germany at 12:00 (GMT+2).

The GBP/USD currency pair

Technical indicators of the currency pair:
  • Prev Open: 1.3426
  • Prev Close: 1.3383
  • % chg. over the last day: -0.32%

On Monday, sterling recovered most of its losses amid officials’ statements that a deal is still possible. The asset has left a long shadow at the bottom, which is a little confusing. But the day closed confidently below SMA 100 and SMA 50. On the pullback from the bearish momentum, Stochastic reacted by quickly hitting the overbought area. The MACD was unable to return to the positive zone, all technical indicators demonstrate the dominance of bears.

Trading recommendations
  • Support levels: 1.3196
  • Resistance levels: 1.3404, 1.3439

The main scenario: selling on growth. The southern impulse has weakened but remained dominant in the sterling. Buyings remain the most dangerous until the price fixes above 1.3400.

Alternative scenario: if the price consolidates above 1.3400, you can consider buying the asset.

GBP/USD
News feed for 2020.12.08:
  • There is no newsfeed for today.

The USD/JPY currency pair

Technical indicators of the currency pair:
  • Prev Open: 104.17
  • Prev Close: 104.05
  • % chg. over the last day: -0.12%

On Monday, the pair failed to hold on to its regained positions, and the price closed just below its opening. Market concerns took a piece of the action, and defensive assets were in demand. However, this didn’t affect USD/JPY that much. Price changes are minimal. Stochastic moves quickly from oversold to overbought levels and back. The MACD is neutral. Everything points to continuing trading in a narrow range.

Trading recommendations
  • Support levels: 103.83, 103.68
  • Resistance levels: 104.74

The main trading scenario for the pair – trading in a sideways range. Due to the rapid change in the market sentiment to negative, a decrease to the support level 103.68 in the first place and another rebound to the current levels is possible.

An alternative scenario assumes consolidation above the level of 104.20 and the resumption of growth to 104.74.

USD/JPY
News feed for 2020.12.08:
  • There is no newsfeed for today.

The USD/CAD currency pair

Technical indicators of the currency pair:
  • Prev Open: 1.2781
  • Prev Close: 1.2797
  • % chg. over the last day: -0.13%

On Monday, the asset showed low volatility. The pair failed to fix above the moving averages. The MACD remains in the negative zone. Stochastic is neutral. The bullish sentiment is still weak and you should probably be careful with purchases, although the pair seems to be significantly oversold.

Trading recommendations
  • Support levels: 1.2770
  • Resistance levels: 1.2835, 1.2886, 1.3026

The main scenario: we recommend considering buying an asset as part of the correction after it fixes above the average SMA 50 and SMA 100 on the H1 timeframe, or from the support level 1.2770 with a short stop-loss.

Alternative scenario: if the price can break through the support of 1.2770, it’s likely to continue falling to 1.2527.

USD/CAD
News feed for 2020.12.08:
  • There is no newsfeed for today.

by JustForex


This article reflects a personal opinion and should not be interpreted as an investment advice, and/or offer, and/or a persistent request for carrying out financial transactions, and/or a guarantee, and/or a forecast of future events.

Pound smashed by Brexit wrecking ball

By Lukman Otunuga, Research Analyst, ForexTime

Anyone else feeling sorry for the British Pound?

It was treated without mercy by G10 currencies today, falling more than 1% against the Dollar as deadlocked Brexit talks left investors empty-handed. As negotiations over the future trading relationship between the UK and EU remain on a knife-edge, fears are set to mount over a no-deal Brexit becoming reality.

UK Prime Minister Boris Johnson is expected to call EU President Ursula von der Leyen this evening after initially threatening to walk away from negotiations! While a successful outcome to the call could soothe tensions and open the doors to further talks, this all sounds too familiar. It must be kept in mind that the three outstanding topics of fisheries, level playing field rules, and governance remain unsolved. With both sides refusing to budge from their stand, the next few days promises to be filled with more drama and uncertainty.

Much attention will be directed towards the European Union summit on Thursday the 10th of December. For those who are banking on a potential breakthrough at the “eleventh-hour”, the two-day summit could present such an improbable opportunity. One of the greatest lessons from the Brexit saga is to always expect the unexpected – and this could hold as the series slowly comes to an end.

Outside of Brexit, the weather in the United Kingdom remains gloomy as usual – accompanied by a winter chill. The same can be said for the macroeconomic landscape. Although the UK has moved into its new tiered system of restrictions, early data suggests that a double-dip recession could be around the corner.

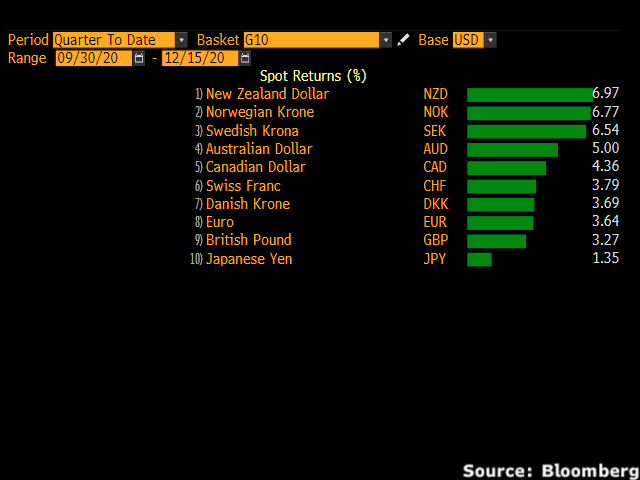
You might be wondering what this all means for the Pound which has surprisingly gained over 3% against the dollar this quarter?

Although the Pound has appreciated against the Dollar, it has weakened against practically every other G10 currency since the start of October. This confirms that the Pound’s upside has nothing to do with a change of sentiment towards the currency or UK economy but Dollar weakness.

Looking at the technicals, the GBPUSD remains bullish on the weekly charts. Prices have the potential to test 1.3482 if 1.3300 proves to be reliable support. A solid breakout above 1.3482 could open the doors towards 1.3500 and 1.3600.

On the daily charts, there is still hope for Pound bulls despite the currency pair experiencing its biggest one day drop in three months! It’s all about where the GBPUSD closes today. A solid daily close above 1.3300 could inject bulls with some confidence to send prices back towards 1.3482. However, a daily close  under 1.3300 is likely to signal further downside with the next key level of interest around 1.3100.

Disclaimer: The content in this article comprises personal opinions and should not be construed as containing personal and/or other investment advice and/or an offer of and/or solicitation for any transactions in financial instruments and/or a guarantee and/or prediction of future performance. ForexTime (FXTM), its affiliates, agents, directors, officers or employees do not guarantee the accuracy, validity, timeliness or completeness, of any information or data made available and assume no liability as to any loss arising from any investment based on the same.


Forex-Time-LogoArticle by ForexTime

ForexTime Ltd (FXTM) is an award winning international online forex broker regulated by CySEC 185/12 www.forextime.com

The Week Ahead: Risk Seeker

By Orbex

USDCAD Battered by Risk Rally

Hopes of recovery have reached a new high bolstered by vaccine headlines, second reopening across Europe, and unwavering government aid. This bullish fever in risky assets continues to be detrimental to the greenback.

In contrast, its Canadian counterpart reaps the benefit of increased risk appetite and higher oil prices. Additionally, the expectation that the Bank of Canada may maintain its current policy is another tailwind for the loonie.

Following a bearish break below 1.2970, the pair is tumbling towards 1.27s, the trough from early 2018. Any rebound is likely to meet stiff selling pressure along 1.3000.

GBPCHF on Thin Ice as No-Deal Looms

The Sterling has repeatedly tested last June’s high as Brexit headlines ebbed and flowed. Traders are unlikely to commit beyond the 5-month long trading range unless there is a substantial catalyst.

The UK is under pressure this week to secure a deal if the government wants to have it ratified in Parliament by the end of the year. As France threatens to veto a ‘bad deal’ in regards to fishing rights, the margin for compromise seems rather limited.

A last-minute breakthrough would lift the pound above 1.2200 with a surge in momentum. Failing that, the current downside bias would prevail and trigger a sell-off into 1.16s.

EURNZD Lifts Ahead of ECB Meeting

The single currency rallied across the board as the bloc emerged from a second lockdown before Christmas. Ongoing sell-off of the US dollar and vaccine-fuelled optimism may have helped the euro fare better. More importantly, investors are repositioning in anticipation of new ECB actions this week.

The central bank is expected to support devastated economies and cement market confidence, probably by extending liquidity and its timeframe. An assertive ECB may actually back the euro in its bounce off the psychological support of 1.7000. On the upside, 1.7550 is a major resistance that short-term bulls need to be aware of.

AUDJPY Climbs on Weak Japanese Outlook

Improving risk sentiment and a weak Japanese economy favor the Australian dollar. Japan’s latest inflation has remained soft, at 0% well below the Bank of Japan’s target of 2%.

The economy’s recovery could stay fragile for an extended period of time as markets forecast an 8.1% GDP contraction for Q3. Signs of actual stagnation could keep the yen underwater as traders follow the uptrend of a more dynamic Aussie.

The pair is pushing towards last September’s high of 78.20, and a bullish breakout may trigger an extended rally. On the downside, 76.50 is the immediate support level in case of a retracement.

By Orbex

Ichimoku Cloud Analysis 07.12.2020 (BTCUSD, BRENT, USDJPY)

Article By RoboForex.com

BTCUSD, “Bitcoin vs US Dollar”

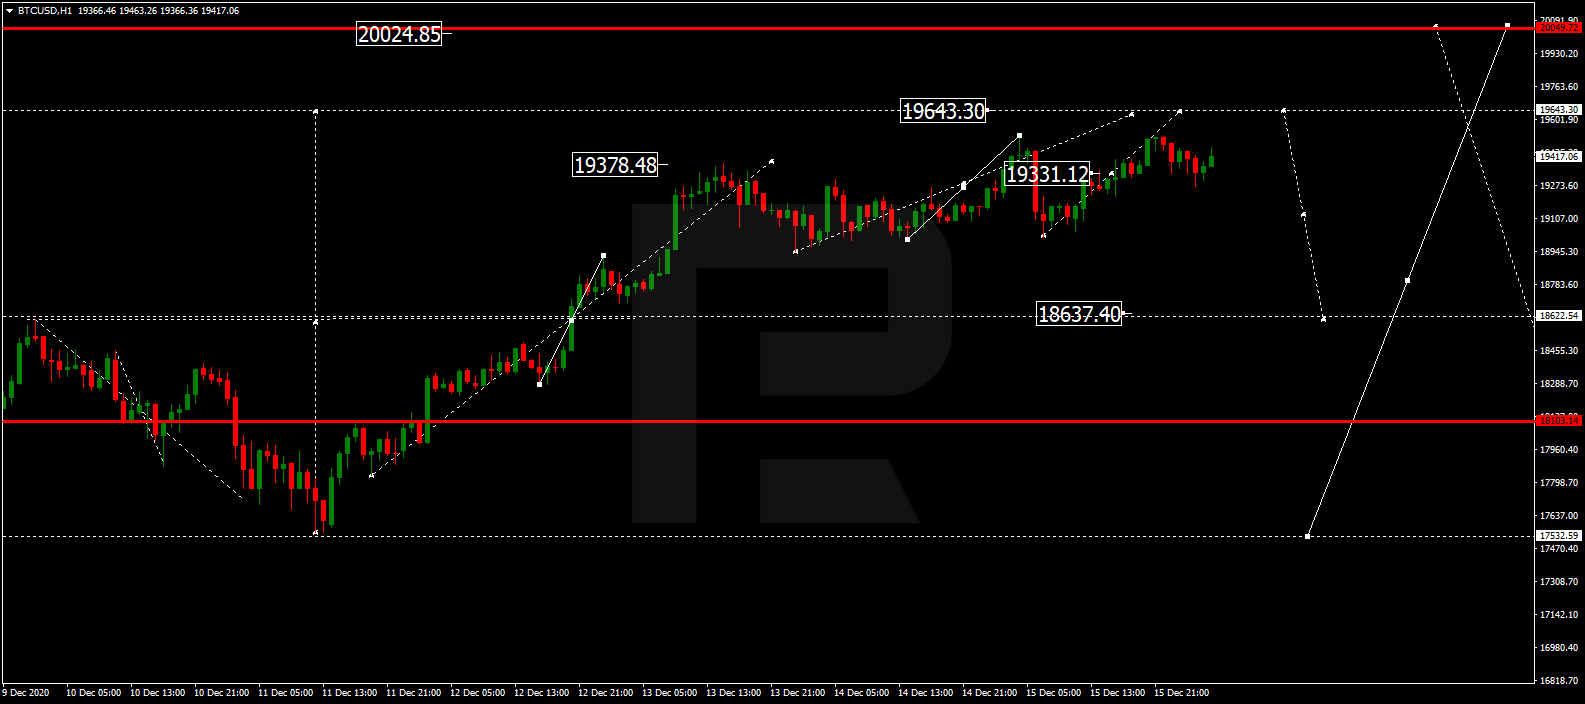
Cloud near 18,915 is expected, followed by growth to 20,715. An additional signal for growth might be a bounce off the lower border of the Triangle pattern. The growth might be canceled by a breakaway of the lower border of the Cloud and securing under 17,855, which will mean further falling to 17,055. The growth can be confirmed by a breakaway of the upper border of the Triangle and securing under 19,895.

BTCUSD
Risk Warning: the result of previous trading operations do not guarantee the same results in the future

BRENT

Oil is trading at 49.07 above the Ichimoku Cloud, indicating an uptrend. A test of the upper border of the Cloud near 48.75 is expected, followed by growth to 50.80. An additional signal for growth might be a bounce off the lower border of ascending channel. The growth might be canceled by a breakaway of the lower border of the Cloud and securing under 47.75, which will mean further falling to 44.75.

BRENT
Risk Warning: the result of previous trading operations do not guarantee the same results in the future

USDJPY, “US Dollar vs Japanese Yen”

USDJPY is trading at 104.08 under the Ichimoku Cloud, indicating a downtrend. A test of the upper border of the Cloud near 104.20 is expected, followed by falling to 103.15. An additional signal for the decline might be a bounce off the resistance level. The decline might be canceled by a breakaway of the upper border of the Cloud and securing above 104.55, which will mean further growth to 105.45. The decline can be confirmed by a breakaway of the lower border of the Triangle and securing above 103.55.

USDJPY

Article By RoboForex.com

Attention!
Forecasts presented in this section only reflect the author’s private opinion and should not be considered as guidance for trading. RoboForex LP bears no responsibility for trading results based on trading recommendations described in these analytical reviews.