Archive for Forex and Currency News – Page 330

Ichimoku Cloud Analysis 21.12.2020 (XAUUSD, AUDUSD, EURUSD)

Article By RoboForex.com

XAUUSD, “Gold vs US Dollar”

XAUUSD is trading at 1906.00; the instrument is moving above Ichimoku Cloud, thus indicating an ascending tendency. The markets could indicate that the price may test Tenkan-Sen and Kijun-Sen at 1895.00 and then resume moving upwards to reach 1945.00. Another signal in favor of further uptrend will be a rebound from the rising channel’s downside border. However, the bullish scenario may no longer be valid if the price breaks the cloud’s downside border and fixes below 1860.00. In this case, the pair may continue falling towards 1805.00.

XAUUSD
Risk Warning: the result of previous trading operations do not guarantee the same results in the future

AUDUSD, “Australian Dollar vs US Dollar”

AUDUSD is trading at 0.7562; the instrument is moving below Ichimoku Cloud, thus indicating a descending tendency. The markets could indicate that the price may test Tenkan-Sen and Kijun-Sen at 0.7585 and then resume moving downwards to reach 0.7445. Another signal in favor of further downtrend will be a rebound from the rising channel’s downside border. However, the bearish scenario may no longer be valid if the price breaks the cloud’s upside border and fixes above 0.7635. In this case, the pair may continue growing towards 0.7765.

AUDUSD
Risk Warning: the result of previous trading operations do not guarantee the same results in the future

EURUSD, “Euro vs US Dollar”

EURUSD is trading at 1.2183; the instrument is moving below Ichimoku Cloud, thus indicating a descending tendency. The markets could indicate that the price may test the cloud’s downside border at 1.2195 and then resume moving downwards to reach 1.2065. Another signal in favor of further downtrend will be a rebound from the rising channel’s downside border. However, the bearish scenario may be canceled if the price breaks the cloud’s upside border and fixes above 1.2275. In this case, the pair may continue growing towards 1.2365.

EURUSD

Article By RoboForex.com

Attention!
Forecasts presented in this section only reflect the author’s private opinion and should not be considered as guidance for trading. RoboForex LP bears no responsibility for trading results based on trading recommendations described in these analytical reviews.

Fibonacci Retracements Analysis 21.12.2020 (GOLD, USDCHF)

Article By RoboForex.com

XAUUSD, “Gold vs US Dollar”

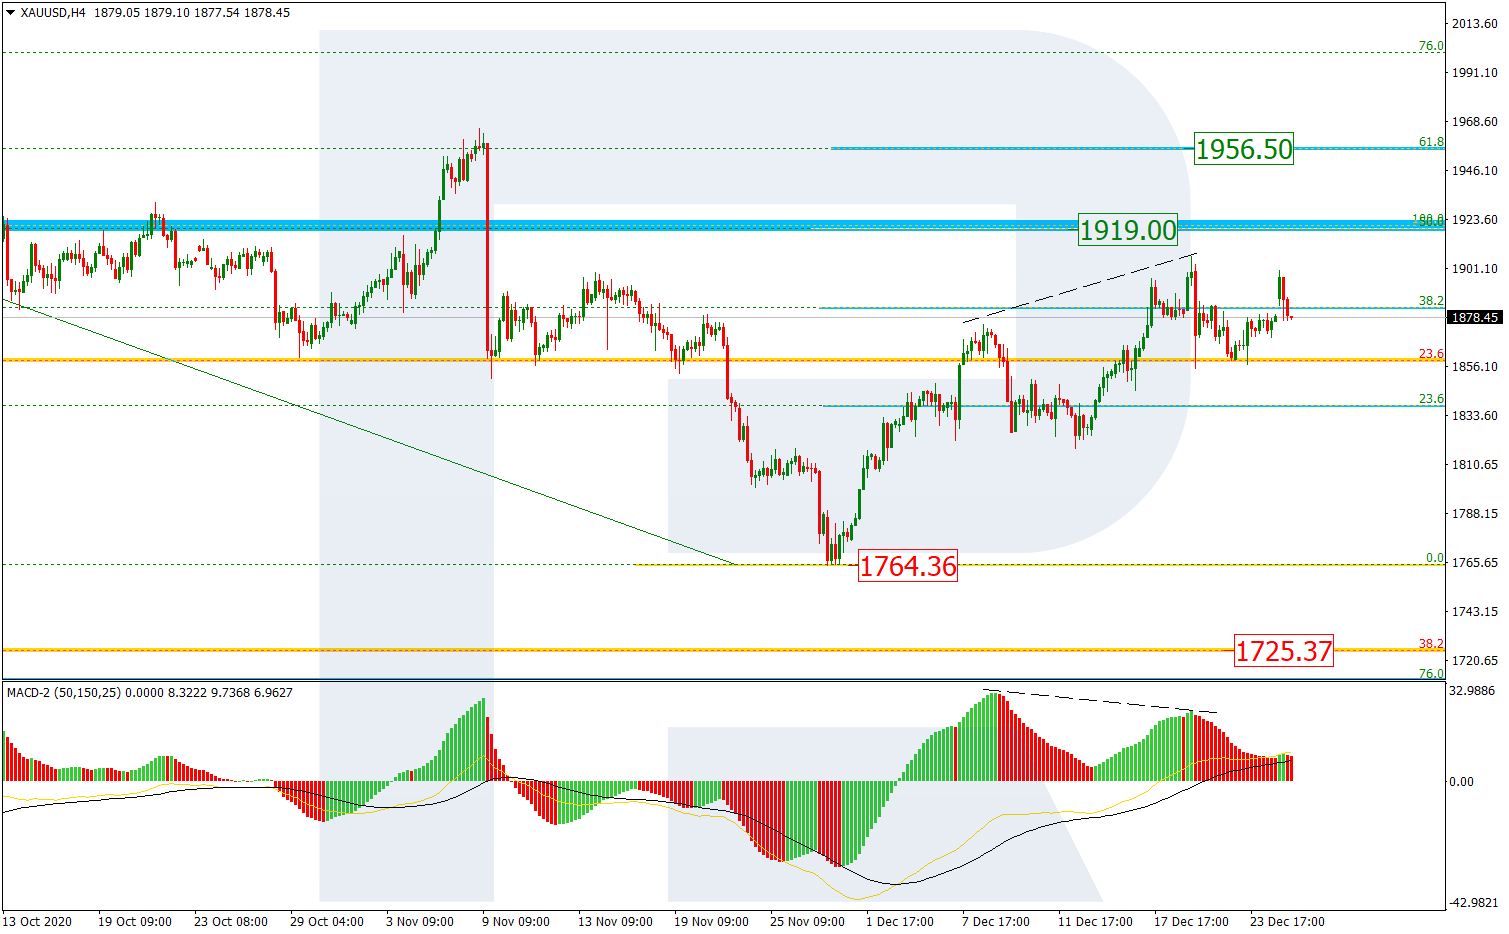
As we can see in the H4 chart, after updating the previous local high and breaking 38.2% fibo, XAUUSD couldn’t reach 50.0% fibo at 1919.00. At the same time, there was a divergence on MACD, which made the pair plunge. However, the asset may yet start a new rising impulse to reach a more significant target, 61.8% fibo at 1956.50. On the other hand, if the instrument continues falling and breaks the low at 1764.36, it will continue falling to reach its mid-term target at 38.2% fibo at 1725.37.

GOLD_H4
Risk Warning: the result of previous trading operations do not guarantee the same results in the future

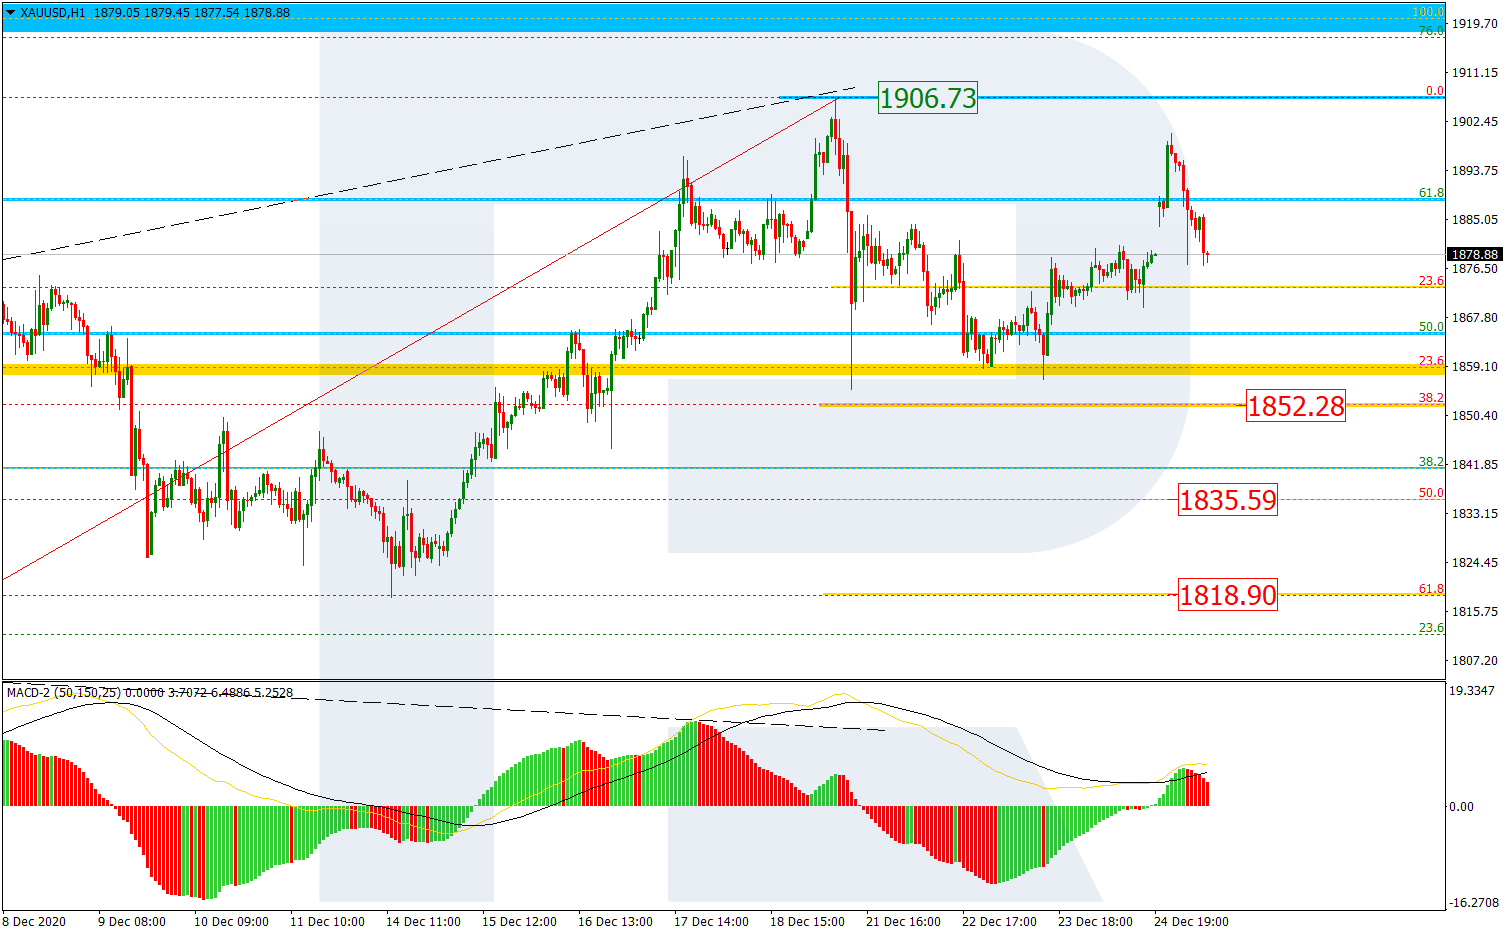
The H1 chart shows a more detailed structure of the current descending tendency after a divergence on MACD. By now, it has already broken 23.6% fibo and may later continue towards 38.2%, 50.0%, 61.8%, and 76.0% fibo at 1852.28, 1835.59, 1818.90, and 1798.66 respectively. However, a breakout of the local high at 1906.73 will result in further trend to the upside.

GOLD_H1
Risk Warning: the result of previous trading operations do not guarantee the same results in the future

USDCHF, “US Dollar vs Swiss Franc”

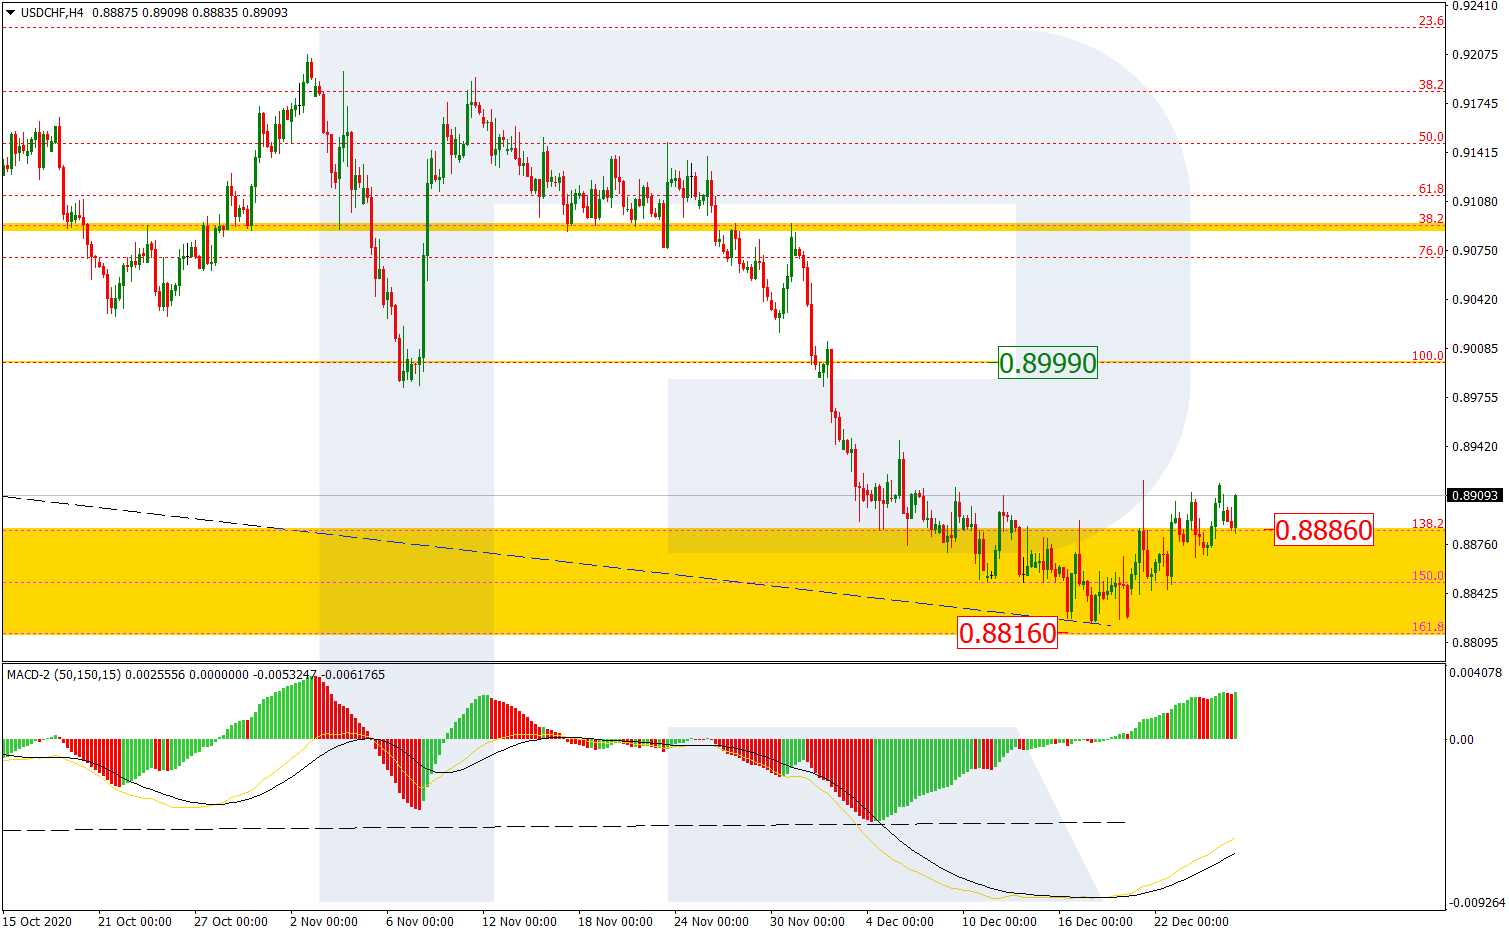
As we can see in the H4 chart, after testing the post-correctional extension area between 138.2% and 161.8% fibo at 0.8886 and 0.8816 respectively, USDCHF has started a new correction towards the resistance area at 0.8999 because of the long-term convergence on MACD. After completing the correction, the asset may start another descending wave; the downside target is the long-term 50.0% fibo at 0.8707.

USDCHF_H4
Risk Warning: the result of previous trading operations do not guarantee the same results in the future

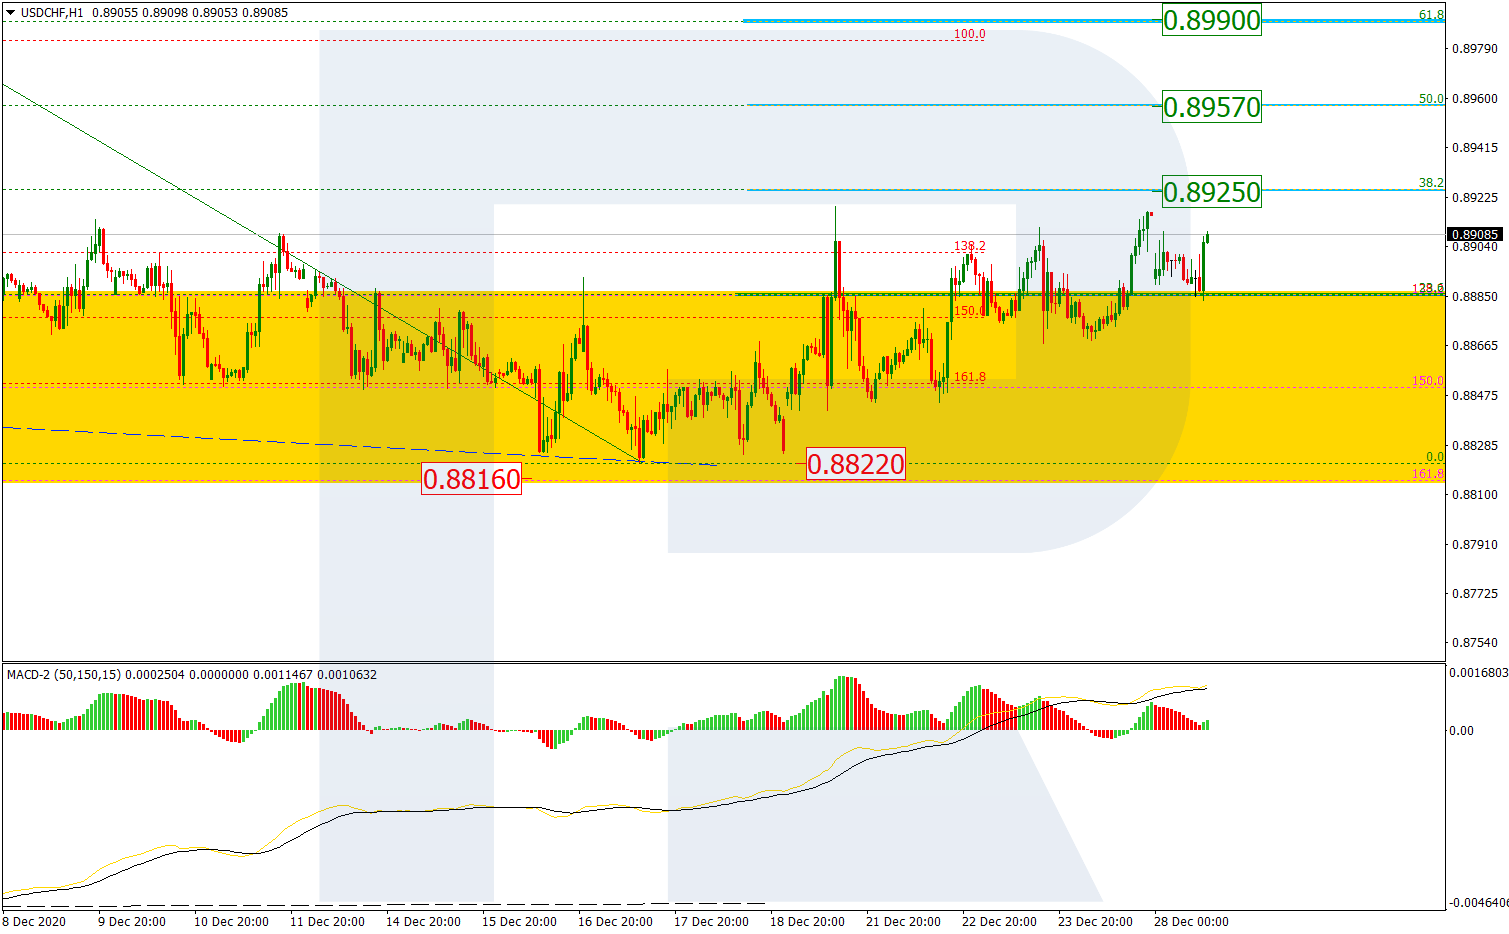
In the H1 chart, after breaking 236% fibo, the pair is still moving upwards to reach 38.2% fibo at 0.8926. Later, the market may continue growing towards 50.0% and 61.8% fibo at 0.8957 and 0.8990 respectively. A breakout of the support at 0.8822 will complete this local correction and result in further mid-term downtrend.

USDCHF_H1

Article By RoboForex.com

Attention!
Forecasts presented in this section only reflect the author’s private opinion and should not be considered as guidance for trading. RoboForex LP bears no responsibility for trading results based on trading recommendations described in these analytical reviews.

The aggravation of the coronavirus situation caused sharp changes in market sentiments

by JustForex

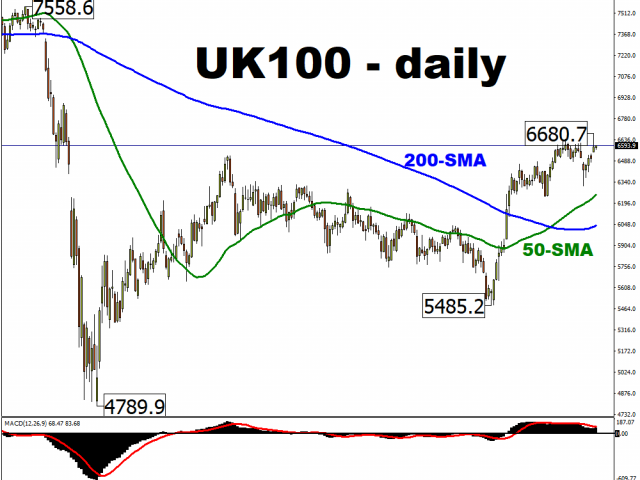
After the stock indexes stopped growing on Friday, the situation with risky assets worsened later on Monday. After the discovery of a new strain of the Covid-19 virus in the UK, which – the British authorities claim – is spreading 70% faster and out of control, investors have begun to flee to defensive assets. The main blow will again fall on the tourism sector and airlines. Thousands of flights are canceled.

The situation is further aggravated with the lack of a breakthrough in the Brexit negotiations. Another “last day” was missed when the main controversial issues must have been settled. Taking into account the issues at the border due to the coronavirus, a panic has set out in logistics companies, as the roads on both sides of the English Channel have been clogged for several days. The Food and Beverage Federation has warned of the possibility of serious disruptions in the supply of fresh food during the Christmas season.

Stock indices are at risk of a triple hit this week. Firstly, of course, the market has taken into account that the end of the year would be unsatisfactory in terms of the epidemiological situation. Big players, however, are already saying that no one expected this time to be “that bad.” Second, the deadline for an agreement between the EU and the UK is getting close. If there is no agreement, then on January 1, Britain will begin trade with the EU in accordance with WTO rules, and this promises additional customs duties. Thirdly, by the end of the year, investors can close long positions which will accelerate the fall of stock markets. Taking into account that there are few bullish drivers at the beginning of the week, the market risks becoming bearish.

Given the backdrop of new shocks, the dollar index has accelerated its corrective growth and returned above the key level of 90, adding 0.57%. The yield on benchmark US Treasuries has fallen by 40 basis points at once to 0.908%. The British Gilts have suffered the largest losses – 65 basis points.

Major stock indices are trading down:

S&P 500 (F) 3,686.88 -19.37 -0.52%

Dow Jones 30,179.05 -124.32 -0.41%

DAX 13,341.20 -289.31 -2.12%

FTSE 100 6,434.06 -95.12 -1.46%

Important venets:
  • – 14:00 (GMT+3). UK Industrial Orders Index (CBI) (dec).

by JustForex


This article reflects a personal opinion and should not be interpreted as an investment advice, and/or offer, and/or a persistent request for carrying out financial transactions, and/or a guarantee, and/or a forecast of future events.
Ichimoku Cloud Analysis 18.12.2020 (AUDUSD, EURUSD, USDJPY)

Article By RoboForex.com

AUDUSD, “Australian Dollar vs US Dollar”

AUDUSD is trading at 0.7592; the instrument is moving above Ichimoku Cloud, thus indicating an ascending tendency. The markets could indicate that the price may test the cloud’s downside border at 0.7575 and then resume moving upwards to reach 0.7690. Another signal in favor of further uptrend will be a rebound from the rising channel’s downside border. However, the bullish scenario may no longer be valid if the price breaks the cloud’s downside border and fixes below 0.7530. In this case, the pair may continue falling towards 0.7445.

AUDUSD
Risk Warning: the result of previous trading operations do not guarantee the same results in the future

EURUSD, “Euro vs US Dollar”

EURUSD is trading at 1.2240; the instrument is moving above Ichimoku Cloud, thus indicating an ascending tendency. The markets could indicate that the price may test the cloud’s upside border at 1.2205 and then resume moving upwards to reach 1.2350. Another signal in favor of further uptrend will be a rebound from the rising channel’s downside border. However, the bullish scenario may be canceled if the price breaks the cloud’s downside border and fixes below 1.2155. In this case, the pair may continue falling towards 1.2065.

EURUSD
Risk Warning: the result of previous trading operations do not guarantee the same results in the future

USDJPY, “US Dollar vs Japanese Yen”

USDJPY is trading at 103.36; the instrument is moving below Ichimoku Cloud, thus indicating a descending tendency. The markets could indicate that the price may test the cloud’s upside border at 103.50 and then resume moving downwards to reach 102.55. Another signal in favor of further downtrend will be a rebound from the descending channel’s upside border. However, the bearish scenario may no longer be valid if the price breaks the cloud’s upside border and fixes above 103.75. In this case, the pair may continue growing towards 104.85.

USDJPY

Article By RoboForex.com

Attention!
Forecasts presented in this section only reflect the author’s private opinion and should not be considered as guidance for trading. RoboForex LP bears no responsibility for trading results based on trading recommendations described in these analytical reviews.

Growing tensions between the US and China, as well as another halt in Brexit negotiations

by JustForex

Stock market indices have stopped going up as the news about renewed tensions between the US and China was released. On Thursday evening, it became known that the United States was ready to blacklist dozens of Chinese companies. Investors’ appetite for risk has plummeted, but the indices show more consolidation than preparation for a correction.

The Brexit issue is still of greater importance to the market. David Frost claims that negotiations are blocked again, and time is running out. Still no consensus has been found in the fishing question. Ursula von der Leyen, for her part, warns that “great differences” persist and that “overcoming them will be very difficult.” Given such conditions, sterling started declining.British Gilts has increased in price since the opening of the European session, while the yield has fallen to 0.253%.

The market in the Brexit issue will take into account the statements of the Bank of England. On Thursday, the British monetary regulator stated it would leave interest rates unchanged at 0.1% and bond buyback at £875 bn. However, the regulator is ready to quickly adjust the policy in case of failure in the negotiations. Any aggravation in the negotiations between the EU and the UK will imply for investors milder terms of the Bank of England lending in the future.

As a result of new shocks, the dollar index has transitioned to correctional growth. In the European session, USDX has reached 89.838 (+0.11%). The dollar bulls are backed by pending talks in Washington, DC for a new aid package. No agreement has yet been reached, and negotiations have been postponed until the weekend.

Market indicators

Major market stocks are trading as usual:

S&P 500 (F) 3.712,38 -0,37 -0,01%

DAX 13.691,25 +24,00 +0,18%

FTSE 100 6.576,29 +25,23 +0,39%

The news feed for 2020.12.18:
  • – 10:00 UK Retail Sales (MoM) (GMT+3);
  • – 12:00 German IFO Business Climate Index (GMT+3);
  • – 12:00 Baseline Retail Sales (MoM) in Canada (GMT+3).

by JustForex


This article reflects a personal opinion and should not be interpreted as an investment advice, and/or offer, and/or a persistent request for carrying out financial transactions, and/or a guarantee, and/or a forecast of future events.
A nerve-wracking end to 2020?

By Han Tan, Market Analyst, ForexTime

Just two weeks before the curtains are drawn on 2020, and investors are still being made to wait on the ultimate fate of market-defining events.

US politicians continue to jostle over the fate of the next fiscal stimulus package, while the EU and the UK have yet to reconcile their differences surrounding a Brexit trade deal. A common feature between proceedings on either side of the Atlantic: time is running out.

Although such major uncertainties refuse to vanish, that isn’t stopping markets from already making their assumptions.

Fiscal stimulus deal to boost US stocks higher

US stocks climbed to fresh record heights once more on Thursday on the hopes that Congress can seal a deal by the weekend. However, recent commentary out of Congressional leaders have doused such expectations, even hinting at a brief federal government shutdown. US stock futures are dipping during the Asian morning session.

Investors are willing to believe that more fiscal stimulus will arrive; it’s just a matter of ‘when’, not ‘if’.

After all, the current state of the US economy clearly warrants more financial support. Thursday’s initial jobless claims were worse than expected, while consumers were shown to have reined back their spending in November. The pandemic is still claiming lives at an alarming rate, and the total number of US Covid-19 cases has exceeded 17 million.

The fresh injection of government funds into the economy would serve as justification for the already-lofty valuations in US equities. Otherwise, the longer risk assets are made to wait, the bigger the risk of a pullback as ‘fiscal stimulus fatigue’ sets in.

Plenty of support for risk sentiment

Still, risk assets should have enough reasons to patiently wait for a positive outcome, despite having endured multiple false dawns after months of negotiations that yielded naught. The expected FDA approval for Moderna’s vaccine, which could happen by today, is set to tide risk sentiment over while waiting for the political impasse to be resolved. Also, stock markets can continue taking heart by the Fed’s latest pledge to continue supporting the US economy and financial conditions, which ultimately translates into a conducive environment for further equity gains.

Brexit’s umpteenth ‘last-chance saloon’

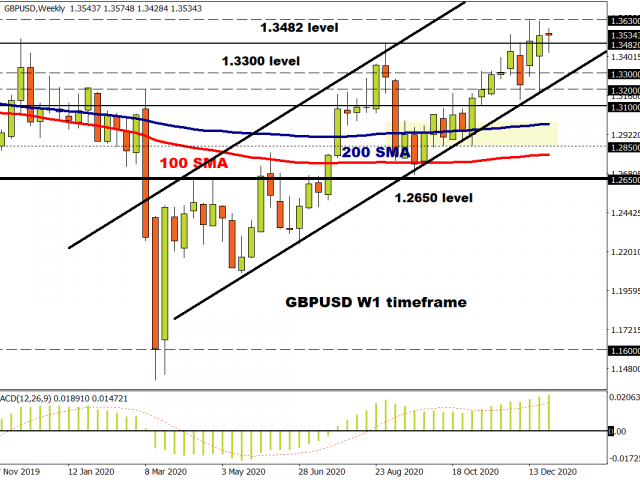
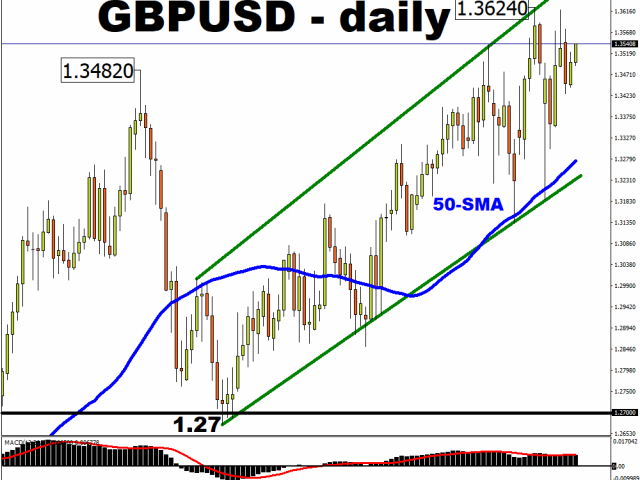
Brexit trade talks have been issued a fresh deadline by the European Parliament who said that an agreement must be reached by this Sunday in order to allow enough time for its ratification. The Pound is still willing to cling on to hopes that a deal can be struck, going by the fact that GBPUSD continues to trade around its highest levels in over two years.

Yet, despite there being only two weeks left before the Brexit transition period ends, both sides continue to harp on about the “big differences” between the UK and EU’s respective stances. The Pound’s performance of late indicates that more of the trade deal optimism has been baked in compared to the risk of a hard Brexit. This Brexit finale could bring either sweet confirmation or a rude shock for markets, while leaving investors on tenterhooks in the interim as we see out this tumultuous year.

Disclaimer: The content in this article comprises personal opinions and should not be construed as containing personal and/or other investment advice and/or an offer of and/or solicitation for any transactions in financial instruments and/or a guarantee and/or prediction of future performance. ForexTime (FXTM), its affiliates, agents, directors, officers or employees do not guarantee the accuracy, validity, timeliness or completeness, of any information or data made available and assume no liability as to any loss arising from any investment based on the same.


Forex-Time-LogoArticle by ForexTime

ForexTime Ltd (FXTM) is an award winning international online forex broker regulated by CySEC 185/12 www.forextime.com

U.S. Dollar Index: Breaking 90

By Lukman Otunuga, Research Analyst, ForexTime

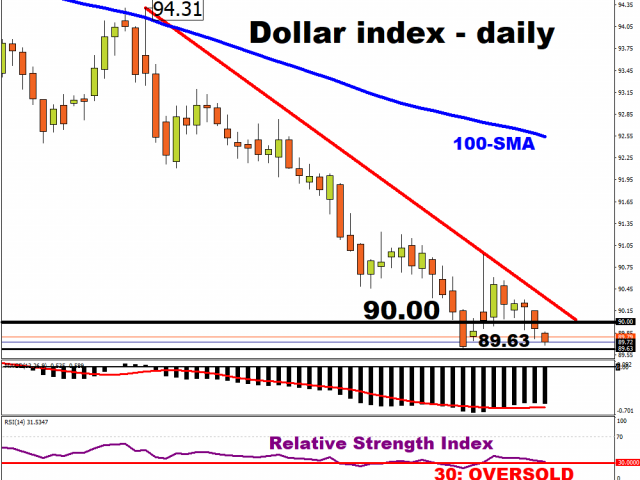
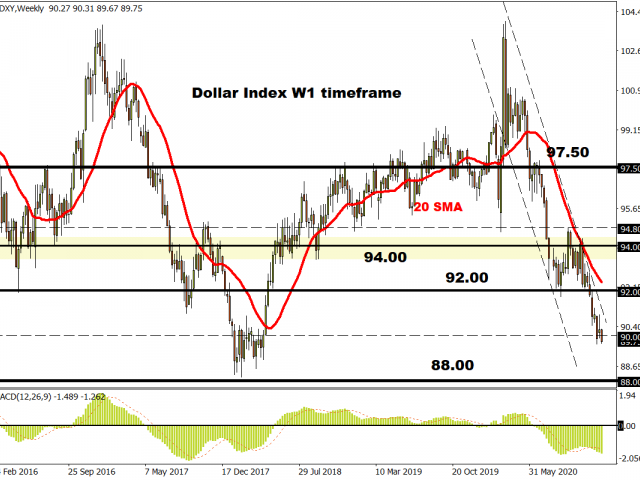
When we look at a number of majors and say there is no obvious resistance ahead, then you know something is up…literally! And so there are key breakouts in nearly every major currency pair today as King Dollar wilts and slides through the 90 level in DXY for the first time since early 2018.

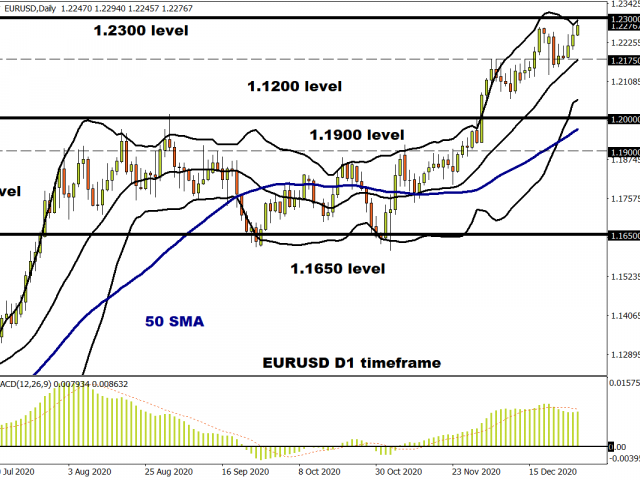
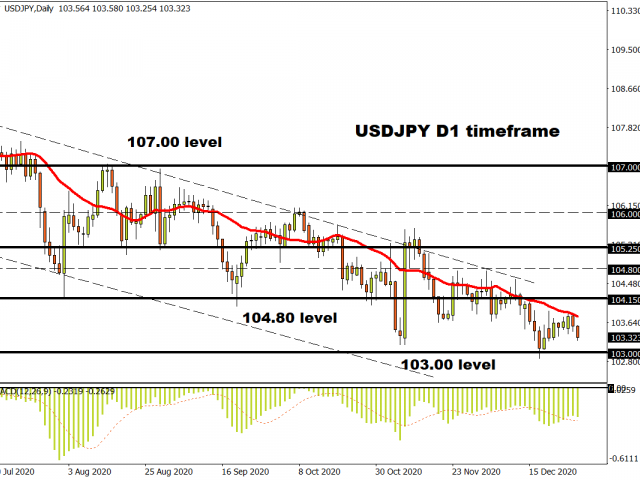
Where to look for the big moves? The Euro has pushed through 1.22 to new highs, cable powered past 1.36, USD/JPY went through 103 and the Aussie surged above 0.76.

When the downtrend is strong and you have a pause in price action, history tells us that compression of trading ranges leads to expansion and a move in line with the dominant long-term trend. Last night’s FOMC meeting didn’t exactly help the greenback either as it disappointed those looking for an increase in bond buying and a focus on long-end bond buying. Fed policy has still to translate into negative real rates and as the odds of US fiscal stimulus rise, so there is more downside for the Dollar. The weekly initial jobless claims numbers have also kicked the bulls whilst down, rising for a second week and way above expectations.

Wait-and-see BoE

The Bank of England meeting came and went earlier today with measures and rates left unchanged. There was no mention of negative interest rates as the MPC, like the rest of us, wait anxiously for any white smoke and agreement around a Brexit deal from Brussels. The bank stands ready to act should the need arise, but having increased bond buying at its last meeting, is watching events closely with bank staff estimating that UK GDP will contract by a little over 1% in Q4 of this year.

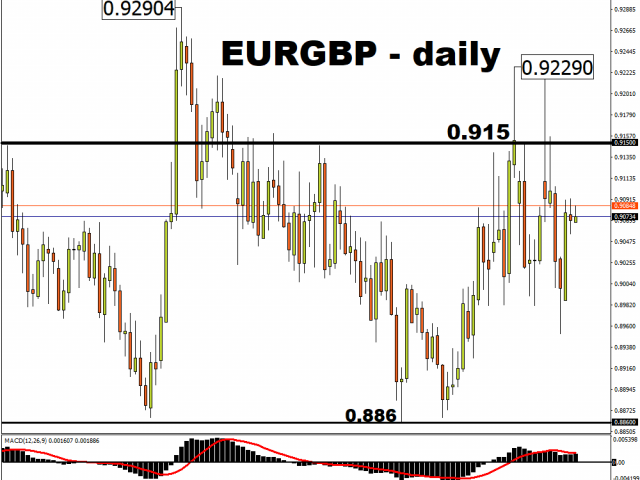
Of course, Brexit is the driver of sterling and GBP has pulled back from its earlier gains. EUR/GBP has been held up a few times at an important Fib level around 0.8990 this month. Do current levels indicate a lot of the good news is factored in already?

Job gains fuel the Aussie

Overnight jobs data down under came in much better than expected, in stark contrast to this afternoon’s figures from the US.  A stellar +90k print in November beat expectations of a gain of 50k, following an equally impressive rise in October, while the jobless rate eased to 6.8%. This data simply adds further evidence that Australia is on the road to recovery, having slipped to its first recession in three decades earlier in the year.

AUD/USD has been on a tear, surging for a seventh straight week since the start of November. We are printing levels not seen since June 2018 and momentum indicators are now just touching overbought levels on the weekly chart while the daily is heavily overbought. Bulls would need to see prices below this week’s low of 0.7507 to pull back from their euphoria.

Global reflation is the name of the game with the Aussie, and iron ore especially has boosted AUD as it amounts to over a third of the country’s exports. The China industrial rebound underpinned by vaccine rollouts should keep the uptrend going, although any more QE from the RBA as the bank endeavours to lift wages may see some temporary setbacks for the Aussie.

Disclaimer: The content in this article comprises personal opinions and should not be construed as containing personal and/or other investment advice and/or an offer of and/or solicitation for any transactions in financial instruments and/or a guarantee and/or prediction of future performance. ForexTime (FXTM), its affiliates, agents, directors, officers or employees do not guarantee the accuracy, validity, timeliness or completeness, of any information or data made available and assume no liability as to any loss arising from any investment based on the same.


Forex-Time-LogoArticle by ForexTime

ForexTime Ltd (FXTM) is an award winning international online forex broker regulated by CySEC 185/12 www.forextime.com

Japanese Candlesticks Analysis 17.12.2020 (USDCAD, AUDUSD, USDCHF)

Article By RoboForex.com

USDCAD, “US Dollar vs Canadian Dollar”

As we can see in the H4 chart, the descending tendency continues. Right now, after forming several reversal patterns, such as Hammer, not far from the support level, USDCAD has reversed in the form of another correction and may later continue falling within the descending channel. in this case, the downside target will be at 1.2635. However, an alternative scenario implies that the price may start a new pullback to return to 1.2825 before resuming the downtrend.

USDCAD
Risk Warning: the result of previous trading operations do not guarantee the same results in the future

AUDUSD, “Australian Dollar vs US Dollar”

As we can see in the H4 chart, after forming a Shooting Star pattern and reversing, AUDUSD continues growing within the rising channel. In this case, the upside target will be the next resistance level at 0.7660. At the same time, an opposite scenario says that the price may continue falling to return to 0.7545 before resuming its growth.

AUDUSD
Risk Warning: the result of previous trading operations do not guarantee the same results in the future

USDCHF, “US Dollar vs Swiss Franc”

As we can see in the H4 chart, after breaking the descending channel’s downside border and forming several reversal patterns, such as Doji, not far from the support area, USDCHF may later resume the descending tendency. In this case, the next downside target may be the support area at 0.8790. Still, there might be an alternative scenario, according to which the asset may return to 0.8930 before resuming its decline.

USDCHF

Article By RoboForex.com

Attention!
Forecasts presented in this section only reflect the author’s private opinion and should not be considered as guidance for trading. RoboForex LP bears no responsibility for trading results based on trading recommendations described in these analytical reviews.

Murrey Math Lines 17.12.2020 (USDCHF, GOLD)

Article By RoboForex.com

USDCHF, “US Dollar vs Swiss Franc”

As we can see in the H4 chart, USDCHF is moving below the 200-day Moving Average, thus indicating a descending tendency. In this case, the price is expected to continue falling to reach the closest support at 0/8. Still, this scenario may no longer be valid if the price breaks 1/8 to the upside. After that, the instrument may reverse and correct towards the resistance at 2/8.

USDCHF_H4
Risk Warning: the result of previous trading operations do not guarantee the same results in the future

In the M15 chart, the pair may break the downside line of the VoltyChannel indicator and, as a result, continue the descending tendency.

USDCHF_M15
Risk Warning: the result of previous trading operations do not guarantee the same results in the future

XAUUSD, “Gold vs US Dollar”

In the H4 chart, XAUUSD is consolidating. In this case, the price is expected to break 4/8 upwards and continue growing to reach the resistance at 5/8. However, this scenario may no longer be valid if the price breaks the support at 3/8 to the downside. After that, the instrument may continue falling towards 2/8.

XAUUSD_H4
Risk Warning: the result of previous trading operations do not guarantee the same results in the future

As we can see in the M15 chart, the price has broken the upside line of the VoltyChannel indicator and, as a result, may continue growing.

XAUUSD_M15

Article By RoboForex.com

Attention!
Forecasts presented in this section only reflect the author’s private opinion and should not be considered as guidance for trading. RoboForex LP bears no responsibility for trading results based on trading recommendations described in these analytical reviews.

The Analytical Overview of the Main Currency Pairs on 2020.12.17

by JustForex

The EUR/USD currency pair

Technical indicators of the currency pair:
  • Prev Open: 1.2149
  • Prev Close: 1.2198
  • % chg. over the last day: +0.40%

On Wednesday afternoon, together with the positive PMI data, EUR/USD was able to break through the upper border of consolidation and, possibly, headed to conquer new highs at the level of 1.2414, which is the maximum of April 2018. The Fed didn’t support the precipitous dollar, promising to extend the asset purchase program as long as it will be necessary. Both factors are bullish for the pair.

Trading recommendations
  • Support levels: 1.2177, 1.2124
  • Resistance levels: 1.2414

The main scenario: buying on a decline. The broken upper border of the range is likely to provide the support. The MACD confirms the rise. The ADX also indicates an uptrend scenario, but at a slow pace. Most likely, the pair will soon form a new maximum and show the boundaries of a new range.

Alternative scenario: if the price can fix below the level of 1.2177, it is possible that the price will return to the previous range or move to correction.

EUR/USD
News feed for 2020.12.17:
  • – Philadelphia Fed Manufacturing Index (Dec) at 16:30 (GMT+2).

The GBP/USD currency pair

Technical indicators of the currency pair:
  • Prev Open: 1.3458
  • Prev Close: 1.3504
  • % chg. over the last day: +0,34%

The sterling continues to demonstrate a steady uptrend. On Wednesday, the quotes reached 1.3552 – the highest level since May last year. The bulls could do with disappointing statistics from the service sector – the most economically important one for the Foggy Albion. The figures didn’t demonstrate the transition to growth and remained in the contraction zone at the level of 49.9. The consumer price index reflects deflation in November at the level of -0.1%, and in annual terms, there is a slowdown in the pace to 0.3% from 0.7% a month earlier.

Trading recommendations
  • Support levels: 1.3449, 1.3287
  • Resistance levels: 1.3613, 1.3657

The main scenario: alertness on a decline. The ADX shows the presence of bullish potential, but it’s constantly slowing down. The MACD still signals an approaching correction, as the divergence doesn’t disappear. The pair has moved far from the moving averages located at 1.3456 (SMA 50) and 1.3377 (SMA 100), which indirectly indicates a short-term overbought. It is advisable to wait for the rollback of the price to open long positions.

Alternative scenario: if the price fixes below 1.3456, the bullish momentum will be lost and we can consider selling the currency pair.

GBP/USD
News feed for 2020.12.17:
  • – BOE Interest Rate Decision at 15:00.

The USD/JPY currency pair

Technical indicators of the currency pair:
  • Prev Open: 103.66
  • Prev Close: 103.45
  • % chg. over the last day: -0.20%

The USD/JPY currency pair is somewhat surprising in the currency market. The bearish direction can be explained by the decline in the dollar index, but only partially. A positive sentiment in the stock market and a lack of fear in the credit market usually support the pair. But while the yields of the benchmark US Treasuries are far from their minimum and the stock market is trading at its maximum, USD/JPY is near the minimum of this March.

Trading recommendations
  • Support levels: 103.17, 103.09
  • Resistance levels: 103.93, 104.15

The main trading scenario for the pai: selling on growth, but after a rollback to the moving averages. An uptrend correction is possible during the day, as the pair has reached support levels. In the Asian session, the southern impetus is ineffectually supporting the ADX, showing a slow rise. The trend potential is falling. The MACD is in the negative zone, but it will form a divergence in case of a rollback. The rise to the moving averages 103.59 – 103.79 and renewal of the fall is possible.

An alternative scenario assumes a break-through of 103.79 and the development of a deeper correction to 103.93 and 104.15.

USD/JPY
News feed for 2020.12.17:
  • – Philadelphia Fed Manufacturing Index (Dec) at 16:30 (GMT+2).

The USD/CAD currency pair

Technical indicators of the currency pair:
  • Prev Open: 1.2697
  • Prev Close: 1.2736
  • % chg. over the last day: +0.31%

Yesterday this currency pair was the only one of the majors where the US dollar was in the positive zone by the end of the day. But it’s most likely that there will be no tendency to continue strengthening the USD. The oil market continues to grow, supporting the Canadian and other commodity currencies. There are no signs of a reversal.
Trading recommendations
  • Support levels: 1.2688, 1.2528
  • Resistance levels: 1.2792, 1.2835

We are considering selling up to the level of 1.2528. The movement may be accelerated due to oil prices. The ADX indicates growth of the potential and there is a possibility of a break-through of the first support level.

Alternative scenario: if the price manages to return above 1.2792, the south trend will be broken and a buy signal will appear towards the level of 1.2835.

USD/CAD
There is no news feed for today.

by JustForex
 

This article reflects a personal opinion and should not be interpreted as an investment advice, and/or offer, and/or a persistent request for carrying out financial transactions, and/or a guarantee, and/or a forecast of future events.