Archive for Forex and Currency News – Page 328

Fibonacci Retracements Analysis 28.12.2020 (GOLD, USDCHF)

Article By RoboForex.com

XAUUSD, “Gold vs US Dollar”

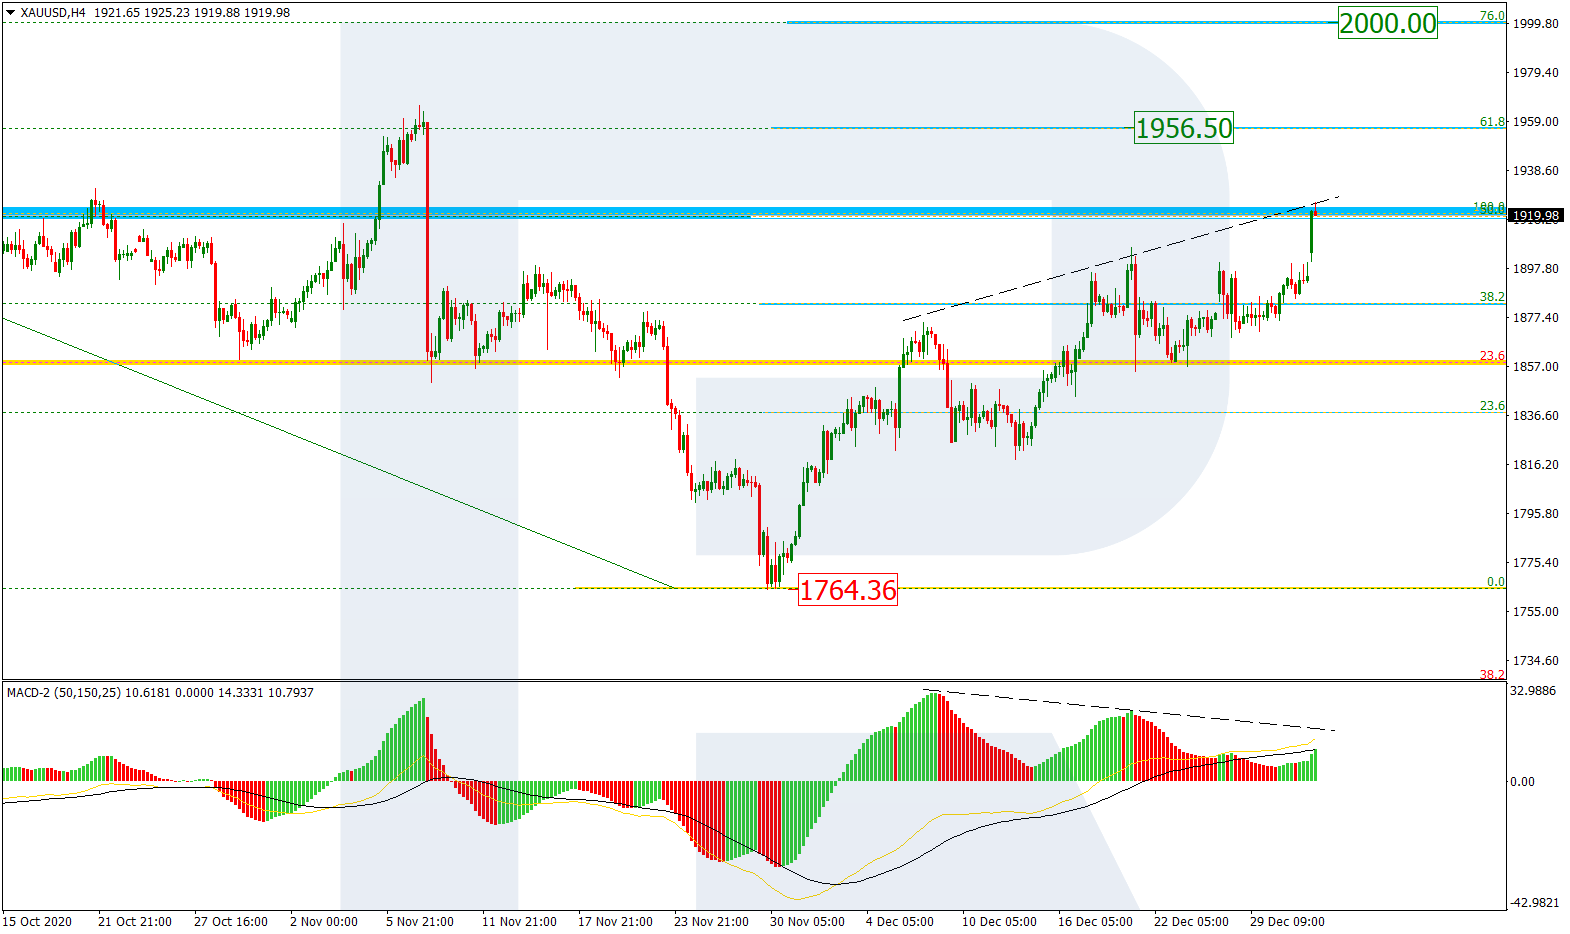
As we can see in the H4 chart, after completing the descending impulse, the asset started growing and has already tested the previous local high. If XAUUSD isn’t strong enough to start a new decline, then the price may continue growing to reach 50.0% and 61.8% fibo at 1919.00 and 1956.50 respectively. However, one shouldn’t disregard a divergence on MACD, which may hint at further mid-term decline towards the low at 1764.36. If the pair breaks this level, it will continue falling to reach the target at 38.2% fibo (1725.37).

GOLD_H4
Risk Warning: the result of previous trading operations do not guarantee the same results in the future

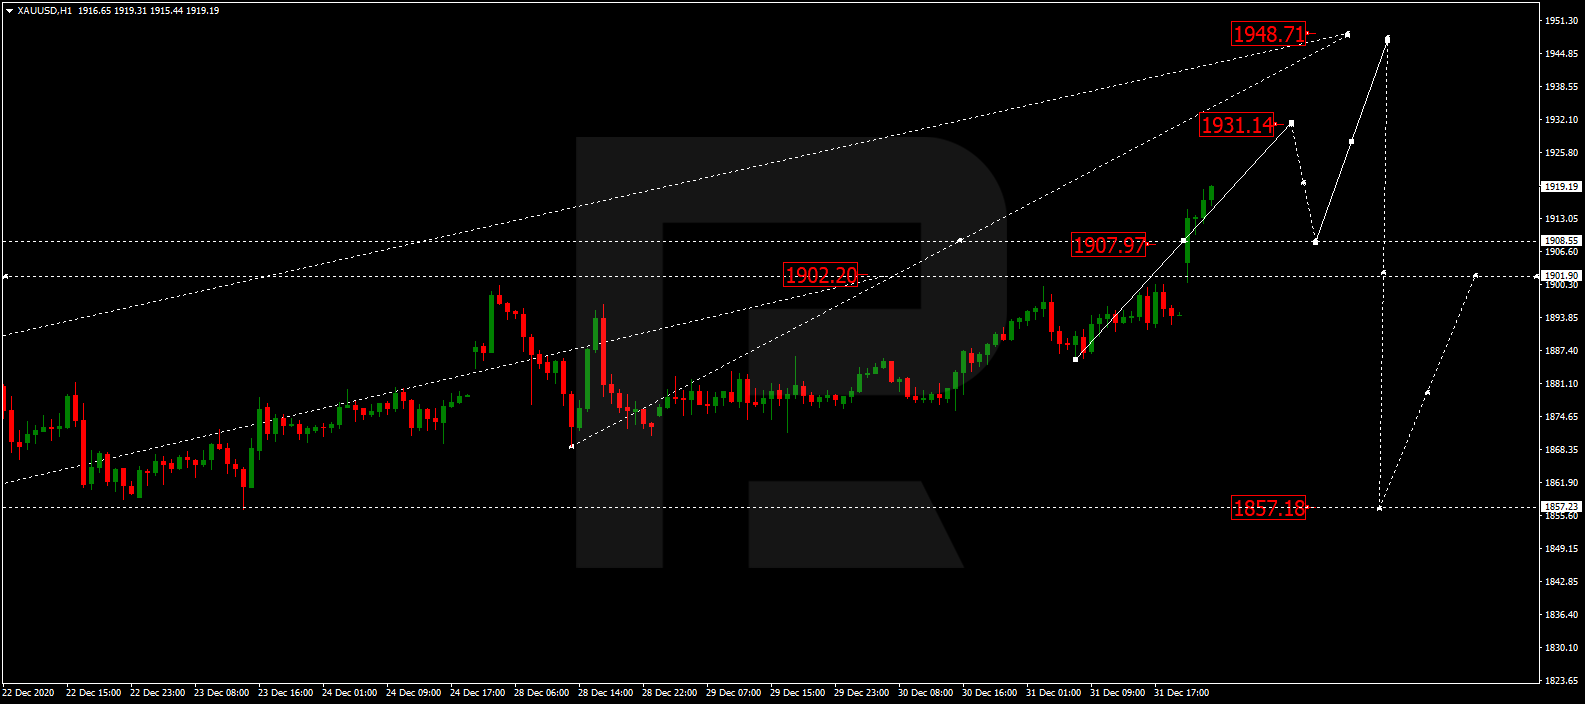
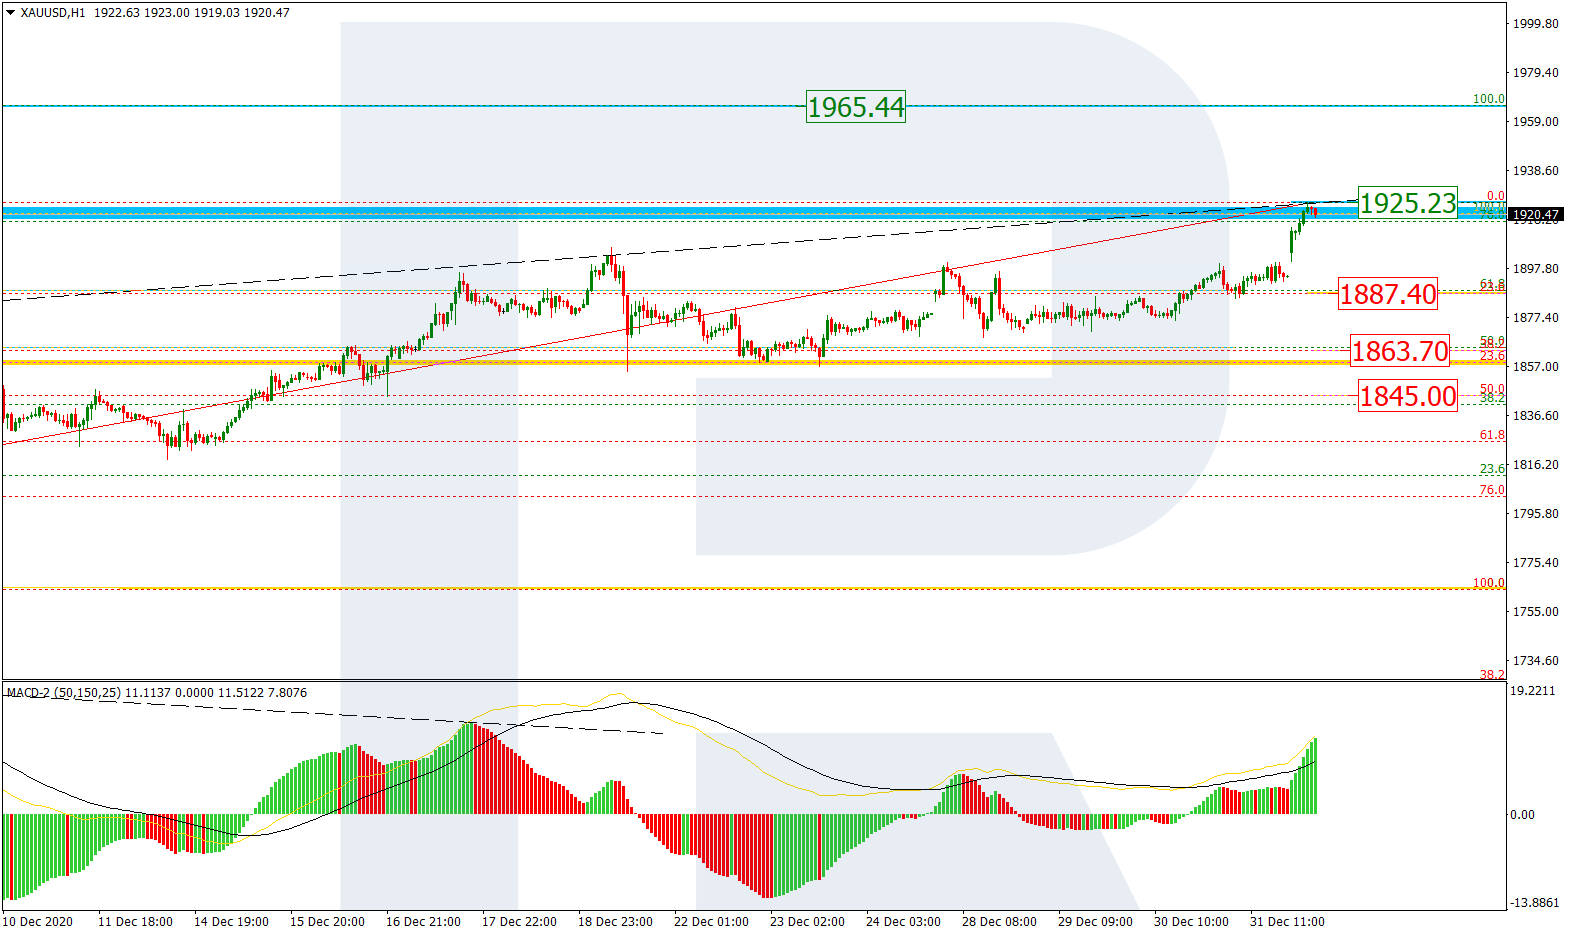
The H1 chart shows a more detailed structure of the current correction after a divergence on MACD. After breaking 23.6% fibo, it has yet failed to reach 38.2% fibo at 1852.28. The next downside targets may be 50.0% and 61.8% fibo at 1835.59 and 1818.90 respectively. However, a breakout of the local high at 1906.73 will result in further trend to the upside.

GOLD_H1
Risk Warning: the result of previous trading operations do not guarantee the same results in the future

USDCHF, “US Dollar vs Swiss Franc”

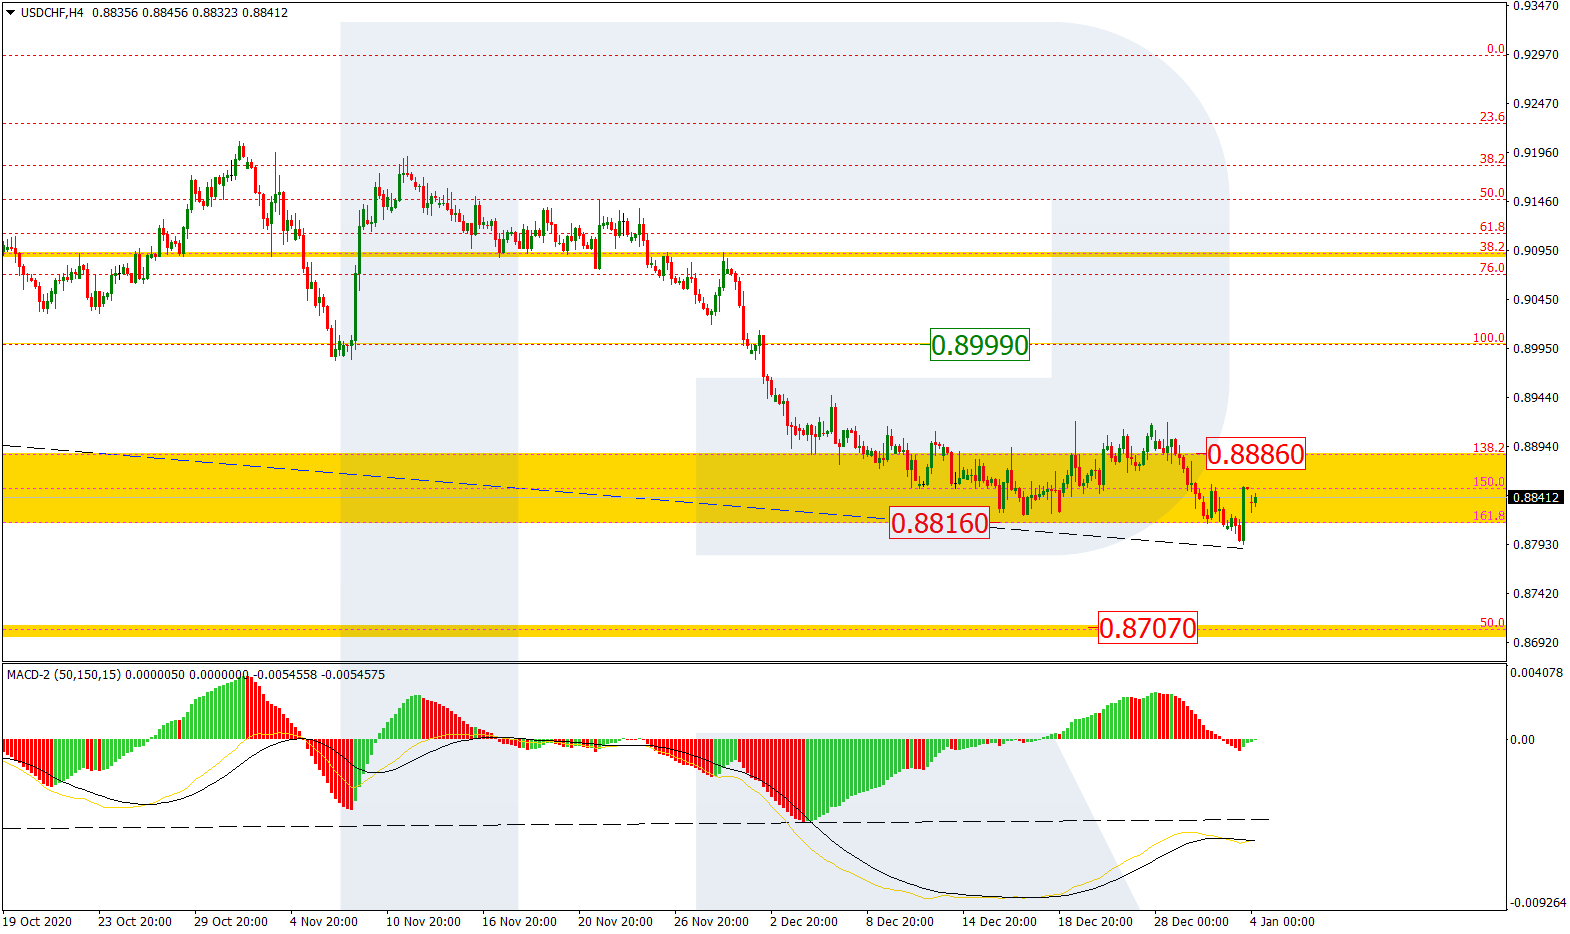
As we can see in the H4 chart, the situation hasn’t changed much. After leaving the post-correctional extension area between 138.2% and 161.8% fibo at 0.8886 and 0.8816 respectively to the upside, USDCHF is moving upwards and this growth can be considered as a correction after a long-term convergence on MACD. The correctional target remains at the resistance at 0.8999.

USDCHF_H4
Risk Warning: the result of previous trading operations do not guarantee the same results in the future

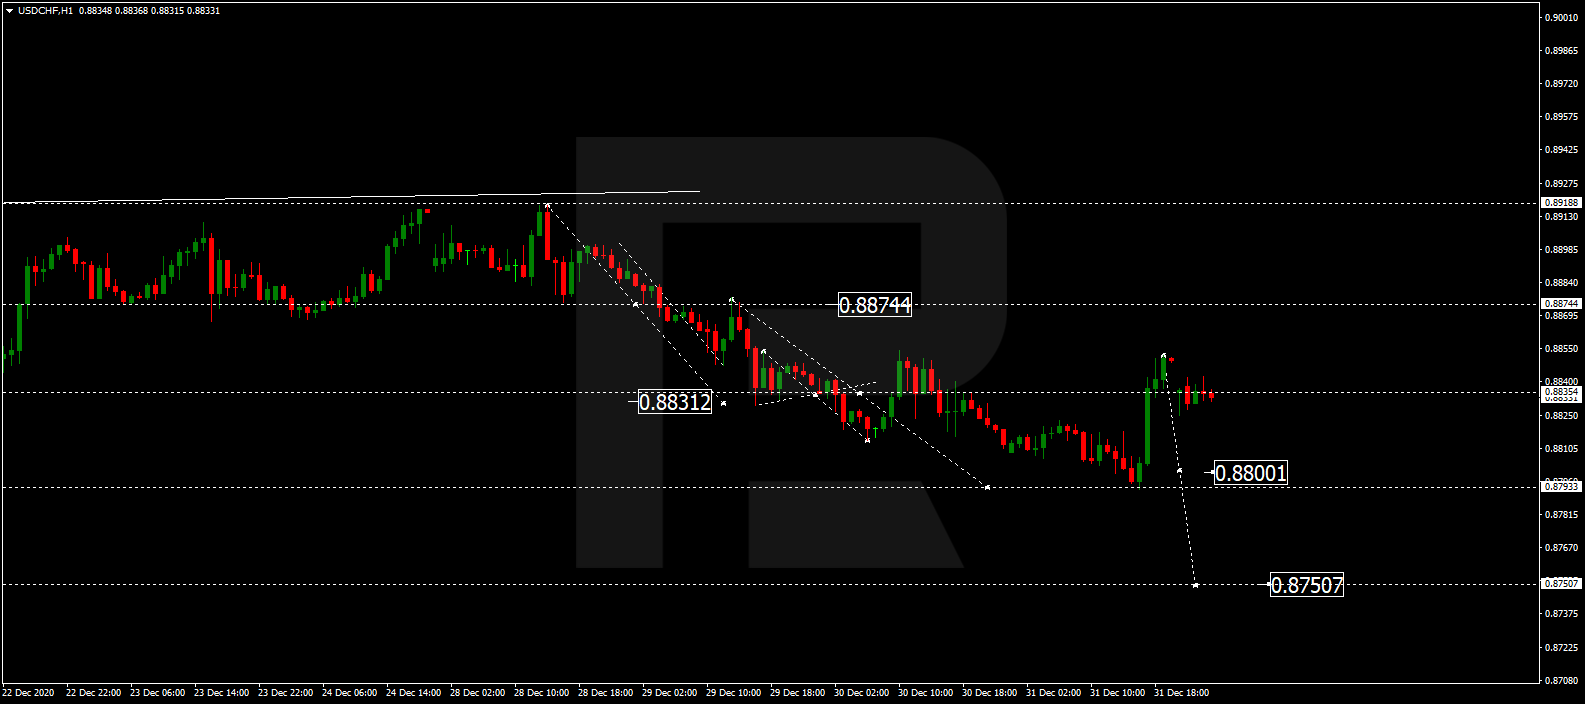
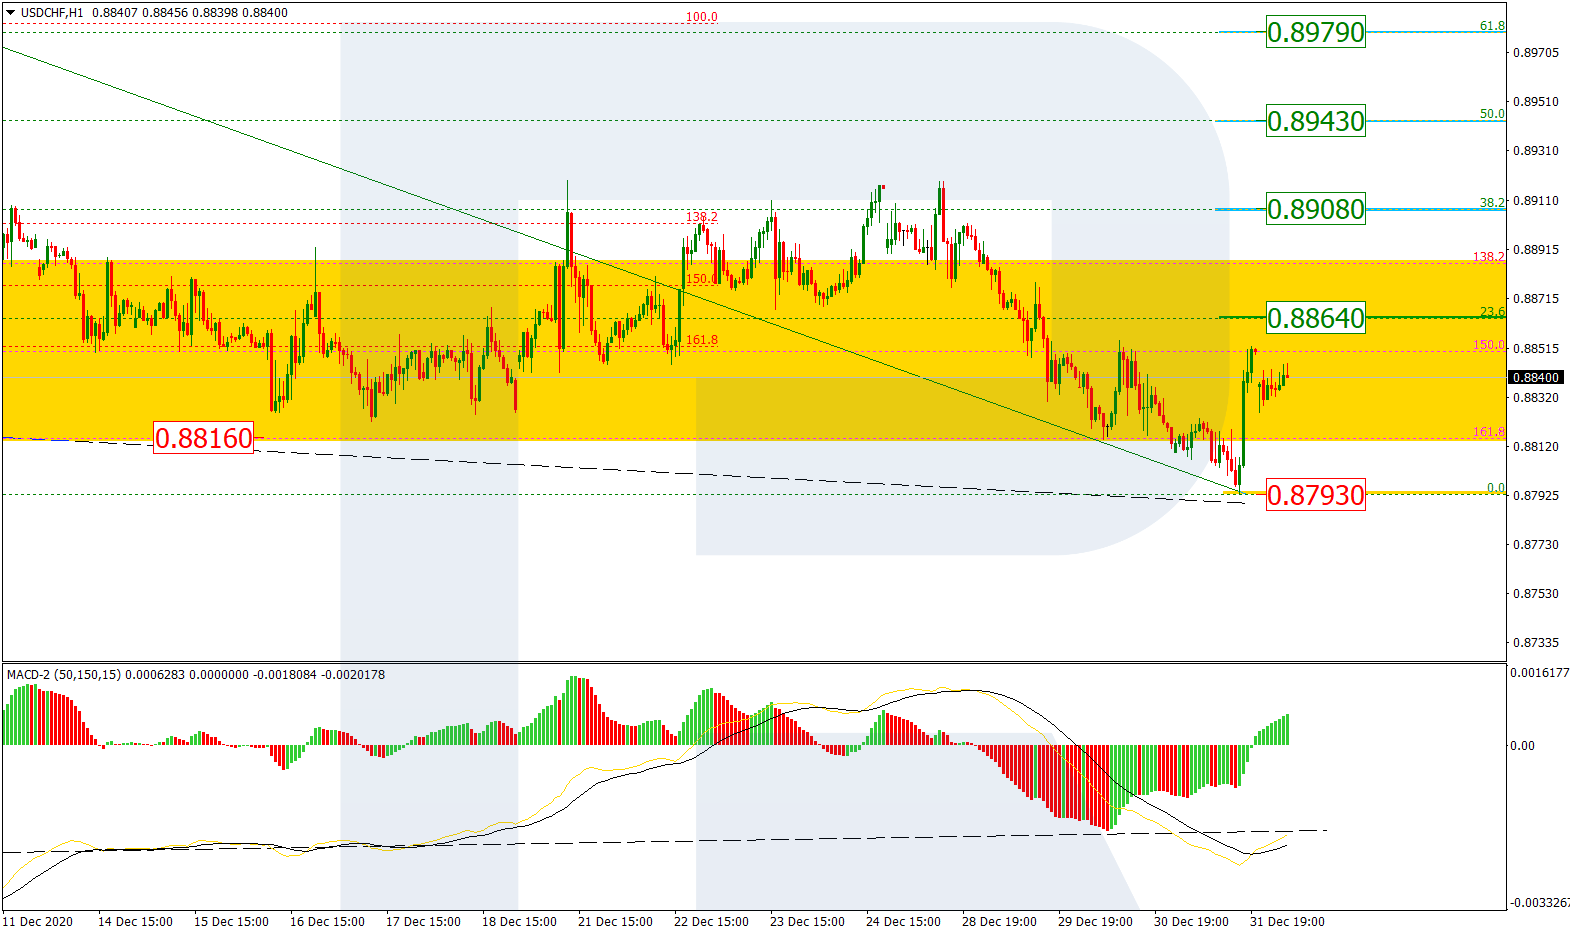
In the H1 chart, the pair is correcting upwards after a convergence on MACD. Judging by the price movement in this area, it is trying to fix above 23.6% fibo before further growth towards 38.2% fibo at 0.8926. Later, the market may continue growing towards 50.0% and 61.8% fibo at 0.8957 and 0.8990 respectively. A breakout of the support at 0.8822 will complete this correction.

USDCHF_H1

Article By RoboForex.com

Attention!
Forecasts presented in this section only reflect the author’s private opinion and should not be considered as guidance for trading. RoboForex LP bears no responsibility for trading results based on trading recommendations described in these analytical reviews.

The Analytical Overview of the Main Currency Pairs on 2020.12.28

by JustForex

The EUR/USD currency pair

Technical indicators of the currency pair:
  • Prev Open: 1.2185
  • Prev Close: 1.2177
  • % chg. over the last day: -0.07 %

On Thursday, EUR/USD was closed in the red zone despite the positive political background. The bearish intraday trend was likely driven by low liquidity ahead of the weekend close. But the currency pair remains in an uptrend by all indications. The signals about the change in the situation have not yet been received.

Trading recommendations
  • Support levels: 1.2151, 1.2130
  • Resistance levels: 1.2273

The main scenario: buying on a decline. The positive background from the political side supports the bulls in this pair. Technical indicators demonstrate the strengthening of the northern signal. The ADX is gradually growing as the price rises, and quotes were able to fix above the moving averages. However, the pair is still in the “triangle” pattern, which is alarming. A breakdown of the price of 1.2240 from the bottom up will give a more reliable northern signal.

Alternative scenario: if the price can fix below 1.2180, there is a possibility that the price will move further to 1.2130, and the break-through of the last point may signal a complete reversal.

EUR/USD
There is no news feed for today.

The GBP/USD currency pair

Technical indicators of the currency pair:
  • Prev Open: 1.3491
  • Prev Close: 1.3533
  • % chg. over the last day: +0,31 %

At the end of Thursday, the sterling managed to increase in value against the background of the positive political decisions for the market. During the Asian session, the pair continues to rise and tries to fix above the first resistance level. It should be considered that the liquidity will be low today since it is a day off in Britain and direction can change dramatically.

Trading recommendations
  • Support levels: 1.3287, 1.3187
  • Resistance levels: 1.3623

The main trading scenario: buying on a decline. The currency pair is close to its main resistance – the December maximum, the break-through of which will indicate further growth towards the April 2018 values ​​in the area of ​​1.40. Until a break-through has occurred, you should be vigilant. The chart is still showing a “double top” pattern, which may indicate a limitation of growth. The ADX shows weak growth dynamics, although the upward movement is reflected as the true one.

Alternative scenario: if the pair fixes below ​​1.3444, the northern scenario is likely to be canceled and the pair will be stuck in the range again.

GBP/USD
There is no news feed for today.

The USD/JPY currency pair

Technical indicators of the currency pair:
  • Prev Open: 103.55
  • Prev Close: 103.68
  • % chg. over the last day: +0.12 %

Calm trading in this currency pair continues. Volatility is gradually decreasing within a month. Despite the growth of the main stock index S&P 500, the yen makes minor attempts to increase in price against the dollar and the currency pair is declining again in the Asian session. The picture is becoming more and more confusing.

Trading recommendations
  • Support levels: 103.26, 102.89
  • Resistance levels: 103.73, 104.15

The main scenario: trading in a sideways range. The indicators start sending different signals. The ADX indicates growth as a true move with high potential. At the same time, the MACD moved into the negative zone, and the price fixed below the moving averages SMA 50 and SMA 100. The pair is likely to continue trading in a narrow sideways range for some time.

An alternative scenario assumes a break-through of 103.26 and the development of a further fall. In case of breaking 103.73, further growth to 104.15 or higher is likely.

USD/JPY
There is no news feed for today.

The USD/CAD currency pair

Technical indicators of the currency pair:
  • Prev Open: 1.2843
  • Prev Close: 1.2839
  • % chg. over the last day: -0.03 %

On Thursday, USD/CAD couldn’t keep the uptrend in trading. The growth of impetus has weakened. Oil quotes continued to rise amid positive results from the Brexit negotiations and decisions on a stimulus package for the economy in Washington. Being under pressure, the dollar index additionally hinders the growth of the pair.

Trading recommendations
  • Support levels: 1.2789, 1.2689
  • Resistance levels: 1.2954, 1.3079

The main scenario is range trading. Against the background of low market liquidity within the day, it is difficult to expect serious price changes. Even though the Canadian dollar has lost its growth momentum, the bears are in no hurry to attack. The price is still above the moving averages. The MACD is near zero. This indicates a slow sideways trend.

Alternative scenario: if the price manages to return below 1.2787, the southern trend may resume. A breakdown of 1.2954 will indicate renewed growth.

USD/CAD
There is no news feed for today.

by JustForex


This article reflects a personal opinion and should not be interpreted as an investment advice, and/or offer, and/or a persistent request for carrying out financial transactions, and/or a guarantee, and/or a forecast of future events.


Oil Remains Above $51 Per Barrel

Author: Dmitriy Gurkovskiy, Chief Analyst at RoboForex

Despite falling slowly, the oil price remains quite high on Monday, December 28th. Brent is trading at $51.16 – investors are back to the market after a Christmas break and fully prepared to respond to the external background.

On one hand, a new aggressive strain of the coronavirus in the United Kingdom, Japan, and then other Asian countries, does not give much ground for optimism in the matter of the prospective demand for energies. Moreover, if this new strain is more dangerous and mobile, the world may face new closures of borders and lockdowns everywhere, in which case the global economy won’t recover anytime soon.

On the other hand, the media reports that the sector of cargo-carrying operations by sea has been extremely active during the final weeks. Of course, it might just be a local surge in activity before New Year, which will die down in January. However, everything is looking very good so far as the above-mentioned operations create an excellent demand for energies – what else does the oil need?

In the H4 chart, after finishing the ascending wave at 52.35 along with the correction towards 49.65, Brent is growing to break 51.11. Possibly, the asset may form another ascending wave to break 52.35 and then continue trading upwards with the short-term target at 55.30. From the technical point of view, this scenario is confirmed by MACD Oscillator: after leaving the histogram area, its signal line has broken 0 to the upside. Later, the line is expected to continue moving to the upside.

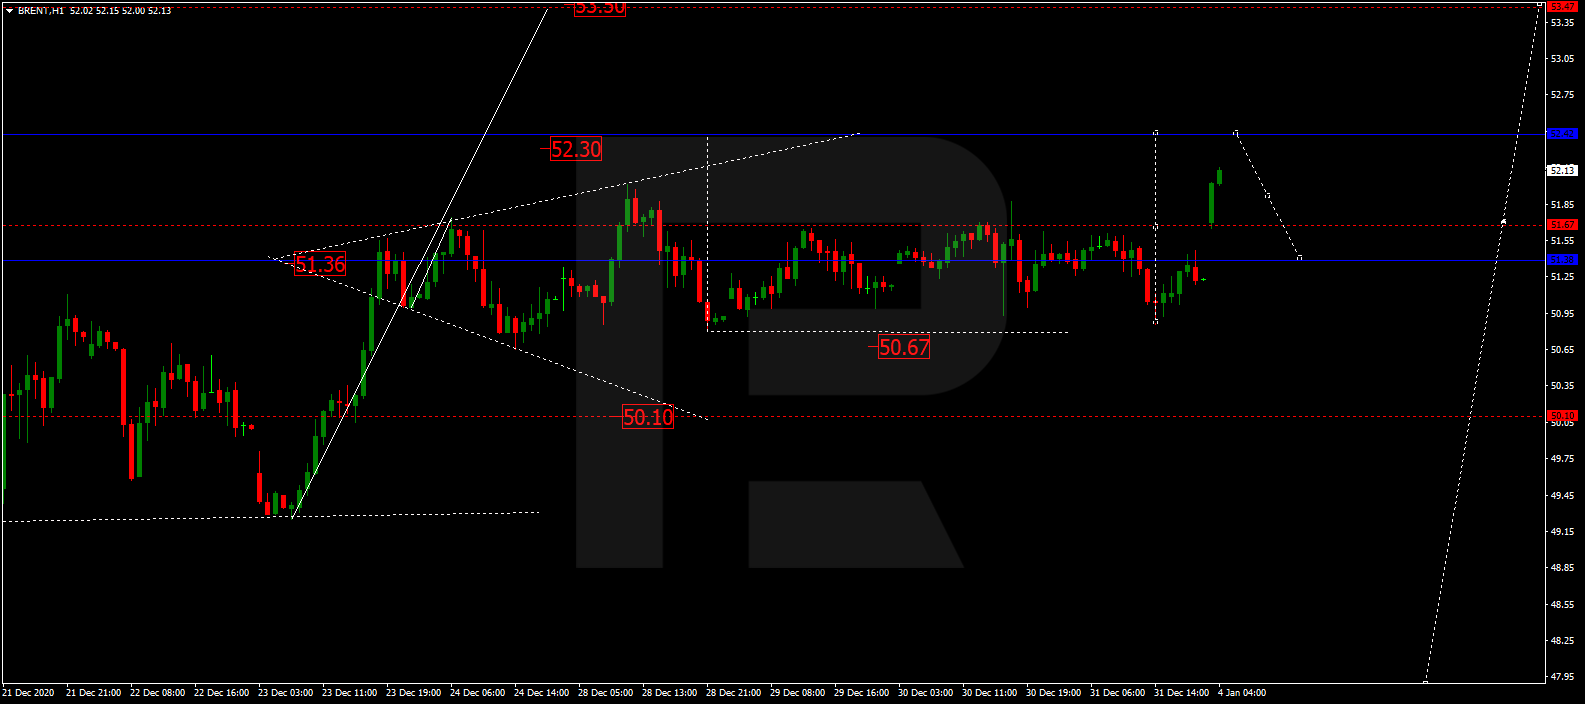
As we can see in the H1 chart, after completing the ascending wave at 51.30, Brent is consolidating below this level. If later the price breaks this range to the downside, the market may start a new correction to reach 50.10; if to the upside – resume trading upwards to break 52.50 and then continue growing with the target at 55.30. From the technical point of view, this idea is confirmed by Stochastic Oscillator: after breaking 50 to the upside, its signal line continues moving towards 80. After that, the line is expected to rebound from 80 and resume falling to return to 50. Later, there might be another rebound from 50 to the upside, which may lead to further growth towards 80 or even higher.

Disclaimer

Any forecasts contained herein are based on the author’s particular opinion. This analysis may not be treated as trading advice. RoboForex bears no responsibility for trading results based on trading recommendations and reviews contained herein.

Japanese Candlesticks Analysis 24.12.2020 (GOLD, NZDUSD, GBPUSD)

Article By RoboForex.com

XAUUSD, “Gold vs US Dollar”

As we can see in the H4 chart, the ascending tendency continues. Right now, after forming several reversal patterns, such as Engulfing and Doji, close to the support area, XAUUSD may reverse and resume growing towards the resistance level. In this case, the upside target will be at 1925.00. At the same time, an opposite scenario implies that the price may start another decline to return to 1850.00 before resuming its growth.

GOLD
Risk Warning: the result of previous trading operations do not guarantee the same results in the future

NZDUSD, “New Zealand vs. US Dollar”

As we can see in the H4 chart, after finishing the correction within the uptrend and forming a Hammer pattern close to the horizontal support level, NZDUSD is reversing. The upside target remains at the resistance area at 0.7170. However, an alternative scenario implies that the price may start a new pullback towards 0.7050 before resuming the ascending tendency.

NZDUSD
Risk Warning: the result of previous trading operations do not guarantee the same results in the future

GBPUSD, “Great Britain Pound vs US Dollar”

As we can see in the H4 chart, the asset is moving within the uptrend. Right now, after forming several reversal patterns, such as Hammer, not far from the support area, GBPUSD is reversing. The upside target is at 1.3655. After that, the instrument may break the resistance level and continue moving upwards. Still, there might be an alternative scenario, according to which the asset may return to 1.3355 before further growth.

GBPUSD

Article By RoboForex.com

Attention!
Forecasts presented in this section only reflect the author’s private opinion and should not be considered as guidance for trading. RoboForex LP bears no responsibility for trading results based on trading recommendations described in these analytical reviews.

Ichimoku Cloud Analysis 24.12.2020 (CADCHF, XAUUSD, USDCAD)

Article By RoboForex.com

CADCHF, “Canadian Dollar vs Swiss Franc”

CADCHF is trading at 0.6907; the instrument is moving below Ichimoku Cloud, thus indicating a descending tendency. The markets could indicate that the price may test the cloud’s downside border at 0.6915 and then resume moving downwards to reach 0.6835. Another signal in favor of further downtrend will be a rebound from the descending channel’s upside border. However, the bearish scenario may no longer be valid if the price breaks the cloud’s upside border and fixes above 0.6950. In this case, the pair may continue growing towards 0.7045.

CADCHF
Risk Warning: the result of previous trading operations do not guarantee the same results in the future

XAUUSD, “Gold vs US Dollar”

XAUUSD is trading at 1876.00; the instrument is moving above Ichimoku Cloud, thus indicating an ascending tendency. The markets could indicate that the price may test the cloud’s downside border at 1865.00 and then resume moving upwards to reach 1970.00. Another signal in favor of further uptrend will be a rebound from the rising channel’s downside border. However, the bullish scenario may no longer be valid if the price breaks the cloud’s downside border and fixes below 1840.00. In this case, the pair may continue falling towards 1805.00.

GOLD
Risk Warning: the result of previous trading operations do not guarantee the same results in the future

USDCAD, “US Dollar vs Canadian Dollar”

USDCAD is trading at 1.2847; the instrument is moving above Ichimoku Cloud, thus indicating an ascending tendency. The markets could indicate that the price may test Tenkan-Sen and Kijun-Sen at 1.2835 and then resume moving upwards to reach 1.3035. Another signal in favor of further uptrend will be a rebound from the rising channel’s downside border. However, the bullish scenario may no longer be valid if the price breaks the cloud’s downside border and fixes below 1.2735. In this case, the pair may continue falling towards 1.2645. To confirm further growth, the asset must break the upside border of the Triangle pattern and fix above 1.2925.

USDCAD

Article By RoboForex.com

Attention!
Forecasts presented in this section only reflect the author’s private opinion and should not be considered as guidance for trading. RoboForex LP bears no responsibility for trading results based on trading recommendations described in these analytical reviews.

Great Britain and the European Union are ready to sign an agreement. Optimism has grown in the market, the dollar is weakening

by JustForex

The stock market started to grow as far as there are already no concerns about the UK-EU deal. Boris Johnson agreed to the conditions that were introduced by the European Union. The share of the catch of the European block in the waters of the UK should be reduced by 25% in five and a half years. The compromise was reached within the reduction. Earlier, the European Union insisted on 10 years.

Just before the holidays, this is very positive news which probably saved the markets from “pressing the Sell button” before leaving for the weekend. Stock indices went up. The yield on 10-year bonds rose across the entire spectrum of the market. The leaders of growth were the British Gilts, which added more than 100 basis points and reached 0.314% immediately. The sterling followed the credit market with the biggest gains in a month.

Another positive point is the widening of the yield spread between the 2-year and 10-year US bonds. During the day, the difference increased by 25 basis points. And the difference between 5-year and 30-year bonds even reached a 4-year maximum. This reduces fears about the stability of the US economy in the long term.

Investors decided to ignore Trump’s criticism of the stimulus measures package, as sooner or later these stimuli will appear anyway. Also, the market (with the exception of the foreign exchange market) did not pay attention to the negative statistics in the US, where leading indicators indicate a slowdown in GDP in the 4th quarter.

Major stock indices are trading with the growth:

S&P 500 (F) 3,687.62 +6.12 +0.17%

Dow Jones 30,129.83 +114.32 +0.38%

DAX 13,587.23 +169.12 +1.26%

FTSE 100 6,495.75 +42.59 +0.66%

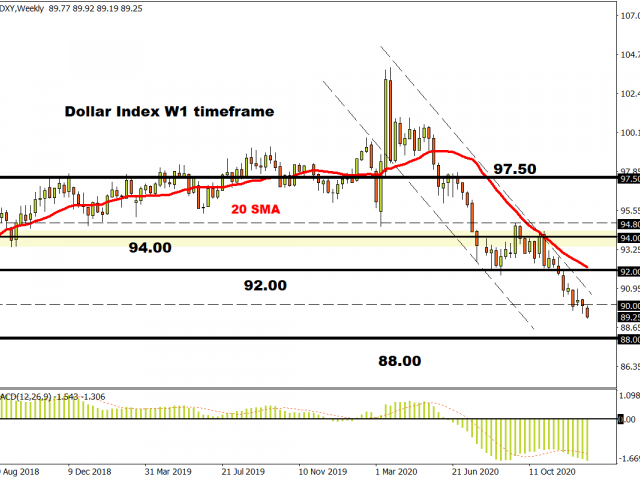
Индекс USD 90.112 -0.228 -0.25%

by JustForex


This article reflects a personal opinion and should not be interpreted as an investment advice, and/or offer, and/or a persistent request for carrying out financial transactions, and/or a guarantee, and/or a forecast of future events.
Brexit Saga: Breakthrough before Christmas

By Lukman Otunuga, Research Analyst, ForexTime

After more than four years, the Brexit saga could be ending with the final episode airing just before Christmas.

Optimism is through the roof around the UK and EU reaching a breakthrough thanks to the great progress made towards settling the outstanding issues of fisheries. An eleventh-hour deal before the transition deadline will be a welcome development for the UK economy and should remove an element of uncertainty as we approach the new year.

Given how the outline of a deal was already agreed on Wednesday evening, an announcement is expected on Thursday morning as negotiators in the European Commission finalize the wording of the final treaty. UK Prime Minister Boris Johnson is expected to make a final call with the president of the European Commission Ursula von der Leyen this morning before we get the official press conference. If a trade deal is announced, the British Pound will most likely extend gains as a major thorn is removed from its side.

However, given the extraordinarily uncertain and complex nature of Brexit, it may be wise to expect the unexpected.

Looking at the technical picture, the GBPUSD is bullish on the weekly timeframe was prices trading around 1.3650 as of writing. Where the GBPUSD concludes today will be heavily influenced by what happens over the next few hours.

Disclaimer: The content in this article comprises personal opinions and should not be construed as containing personal and/or other investment advice and/or an offer of and/or solicitation for any transactions in financial instruments and/or a guarantee and/or prediction of future performance. ForexTime (FXTM), its affiliates, agents, directors, officers or employees do not guarantee the accuracy, validity, timeliness or completeness, of any information or data made available and assume no liability as to any loss arising from any investment based on the same.


Forex-Time-LogoArticle by ForexTime

ForexTime Ltd (FXTM) is an award winning international online forex broker regulated by CySEC 185/12 www.forextime.com

Fibonacci Retracements Analysis 23.12.2020 (GBPUSD, EURJPY)

Article By RoboForex.com

GBPUSD, “Great Britain Pound vs US Dollar”

As we can see in the H4 chart, a divergence on MACD made the pair stop its ascending movement and start a new correction downwards to reach 38.2% fibo, which was later followed by another rising impulse to eliminate the gap. Possibly, this impulse may reach or even break the high at 1.3624 and then continue moving towards the post-correctional extension area between 138.2% and 161.8% fibo at 1.3792 and 1.3980 respectively. However, as long as the asset is trading below the high, the main scenario implies further decline to reach 50.0%, 61.8%, and 76.0% fibo at 1.3150, 1.3037, and 1.2904 respectively.

GBPUSD_H4
Risk Warning: the result of previous trading operations do not guarantee the same results in the future

In the H1 chart, after completing the descending wave, the par has corrected upwards and reached 61.8% fibo. Later, the asset may grow to break the high at 1.3624 and then continue towards the local post-correctional extension area between 138.2% and 161.8% fibo at 1.3790 and 1.3892 respectively. On the other hand, a breakout of the local support at 1.3188 will lead to further decline.

GBPUSD_H1
Risk Warning: the result of previous trading operations do not guarantee the same results in the future

EURJPY, “Euro vs. Japanese Yen”

In the H4 chart, EURJPY is rebounding from the high at 127.07 after testing it. Such a rebound may lead to both a short-term decline and a proper descending wave towards the low at 121.61 or even lower. On the other hand, if the pair breaks the high at 127.07, the asset may continue growing towards the mid-term 61.8% fibo at 128.65 and then the post-correctional extension area between 138.2% and 161.8% fibo at 129.15 and 130.40 respectively.

EURJPY_H4
Risk Warning: the result of previous trading operations do not guarantee the same results in the future

As we can see in the H1 chart, after a divergence on MACD, the asset has tested 23.6% fibo twice. Possibly, the pair may break this level and continue falling towards 38.2% and 50.0% fibo at 125.42 and 124.93 respectively. A breakout of the local high at 127.01 will hint at further uptrend.

EURJPY_H1

Article By RoboForex.com

Attention!
Forecasts presented in this section only reflect the author’s private opinion and should not be considered as guidance for trading. RoboForex LP bears no responsibility for trading results based on trading recommendations described in these analytical reviews.

Ichimoku Cloud Analysis 23.12.2020 (BTCUSD, EURUSD, USDJPY)

Article By RoboForex.com

BTCUSD, “Bitcoin vs US Dollar”

BTCUSD is trading at 23487.00; the instrument is moving above Ichimoku Cloud, thus indicating an ascending tendency. The markets could indicate that the price may test the cloud’s upside border at 22565.00 and then resume moving upwards to reach 25845.00. Another signal in favor of further uptrend will be a rebound from the downside border of a Triangle pattern. However, the bullish scenario may no longer be valid if the price breaks the cloud’s downside border and fixes below 20805.00. In this case, the pair may continue falling towards 19955.00. To confirm further growth, the asset must break the pattern’s upside border and fix above 24365.00.

BTCUSD
Risk Warning: the result of previous trading operations do not guarantee the same results in the future

EURUSD, “Euro vs US Dollar”

EURUSD is trading at 1.2188; the instrument is moving above Ichimoku Cloud, thus indicating an ascending tendency. The markets could indicate that the price may test the cloud’s downside border at 1.2155 and then resume moving upwards to reach 1.2345. Another signal in favor of further uptrend will be a rebound from the rising channel’s downside border. However, the bullish scenario may be canceled if the price breaks the cloud’s downside border and fixes below 1.2105. In this case, the pair may continue falling towards 1.2015. To confirm further growth, the asset must break the upside border of a Triangle pattern and fix above 1.2265.

EURUSD
Risk Warning: the result of previous trading operations do not guarantee the same results in the future

USDJPY, “US Dollar vs Japanese Yen”

USDJPY is trading at 103.44; the instrument is moving below Ichimoku Cloud, thus indicating a descending tendency. The markets could indicate that the price may test the cloud’s upside border at 103.65 and then resume moving downwards to reach 102.45. Another signal in favor of further downtrend will be a rebound from the descending channel’s upside border. However, the bearish scenario may no longer be valid if the price breaks the cloud’s upside border and fixes above 104.05. In this case, the pair may continue growing towards 104.95. To confirm further decline, the asset must break the downside border of a Triangle pattern and fix below 103.10.

USDJPY

Article By RoboForex.com

Attention!
Forecasts presented in this section only reflect the author’s private opinion and should not be considered as guidance for trading. RoboForex LP bears no responsibility for trading results based on trading recommendations described in these analytical reviews.

The Analytical Overview of the Main Currency Pairs on 2020.12.23

by JustForex

The EUR/USD currency pair

Technical indicators of the currency pair:
  • Prev Open: 1.2241
  • Prev Close: 1.2161
  • % chg. over the last day: -0.66%

On Tuesday, EUR/USD came under pressure from bears again. Against the background of the closure of the borders with the UK and the lack of progress in the Brexit negotiations, the German Bonds continued to lose yield and reached -0.60%. The spread has decreased by 100 basis points over the past month against benchmark US Treasuries. The foreign exchange market started giving more signals for a mid-term correction.

Trading recommendations
  • Support levels: 1.2273
  • Resistance levels: 1.2177, 1.2124

The main scenario for trading EUR/USD is selling on growth. Technical indicators have changed to the south. On yesterday’s decline, the ADX demonstrated greater bearish potential than on Monday. The MACD has consolidated in the negative zone. The moving averages have also reorganized and are in the south direction. The price movement has formed a “contracting triangle” pattern, the borders of which will lie at 1.2250 above and 1.2163 below. Withdrawal from the triangle will give a clearer signal for actions.

Alternative scenario: if the price can fix above the level of 1.2250, it is possible that the price will move further to 1.2273, and the break-through of the last point will indicate further growth.

EUR/USD
News feed for 2020.12.23:
  • – United States Initial Jobless Claims at 16:30 (GMT+2).

The GBP/USD currency pair

Technical indicators of the currency pair:
  • Prev Open: 1.3462
  • Prev Close: 1.3358
  • % chg. over the last day: -0.78%

At the end of Tuesday, the sterling had the biggest intraday losses in December. Lack of progress in negotiations between the EU and Britain does not give the bulls the opportunity to push the pair higher. Taking into account the factor of positive expectations, on which the sterling was growing, it’s likely that the instrument was in the area of overvaluation. Against this background, the southern correction may be more significant.

Trading recommendations
  • Support levels: 1.3287, 1.3187
  • Resistance levels: 1.3553, 1.3623

The main trading scenario for GBP/USD is trading in a wide sideways range between 1.3553 and 1.3287. Today’s technical indicators were stronger than those of the euro. The ADX showed a very low downtrend potential, which causes doubts concerning bears’ strength. In this case, the upward movement in the Asian session is indicated on the oscillator as the true one. The price has fixed between the moving averages SMA 50 and SMA 100. The MACD is in the neutral zone. For a total, a neutral signal is obtained.

Alternative scenario: if the price fixes above 1.3553, the pair is likely to resume its growth. A break-through of 1.3287 will give a signal for further decline.

GBP/USD
There is no news feed for today.

The USD/JPY currency pair

Technical indicators of the currency pair:
  • Prev Open: 103.30
  • Prev Close: 103.63
  • % chg. over the last day: +0.32%

There have been some little changes in the currency pair since yesterday. The amplitude of oscillations decreased and the price range remained the same. Due to the lack of drivers for the growth of risky assets, it is difficult to hope for the development of corrective growth. At the same time, the main majors began to show signs of a correction, which strengthens the dollar index and pair.

Trading recommendations
  • Support levels: 103.26, 102.89
  • Resistance levels: 103.93, 104.15

The main scenario is trading in a sideways range. If yesterday there was a small priority to purchases, today it has decreased. The ADX has rebuilt and indicates the growth of bears’ strength. The MACD remains near zero. The price is likely to continue fluctuating in the area of 103.26 – 103.70.

An alternative scenario assumes a break-through of 103.26 and the development of a further fall. In case of breaking 103.93, it’s likely that there will be further growth.

USD/JPY
News feed for 2020.12.23:
  • – United States Initial Jobless Claims at 16:30 (GMT+2);
  • – New Home Sales in the United States (Nov) at 18:00 (GMT+2).

The USD/CAD currency pair

Technical indicators of the currency pair:
  • Prev Open: 1.2852
  • Prev Close: 1.2905
  • % chg. over the last day: +0.41%

USD/CAD continued its northern correction on Tuesday. Oil quotes remain under pressure from the worsening situation with the coronavirus pandemic, which puts pressure on the Canadian currency. The growth of the dollar index supports the northern direction of the currency pair.

Trading recommendations
  • Support levels: 1.2789, 1.2688
  • Resistance levels: 1.2954, 1.3079

The main scenario is buying on a decline. The support and resistance levels have remained the same, as new and more distinct extremes have not been formed. The pair is still in the first upward impulse. The ADX has weakened somewhat, which indicates the likelihood of a pullback or consolidation near current levels. The price remains above the moving averages, which additionally indicates the strength of the bulls.

Alternative scenario: if the price manages to return below 1.2787, the southern trend may resume.

USD/CAD
News feed for 2020.12.23:
  • – Canadian GDP (MoM) (Oct) at 16:30 (GMT+2);
  • – US crude oil reserves at 18:00 (GMT+2).

by JustForex


This article reflects a personal opinion and should not be interpreted as an investment advice, and/or offer, and/or a persistent request for carrying out financial transactions, and/or a guarantee, and/or a forecast of future events.