Archive for Forex and Currency News – Page 326

Fibonacci Retracements Analysis 04.01.2021 (GOLD, USDCHF)

Article By RoboForex.com

XAUUSD, “Gold vs US Dollar”

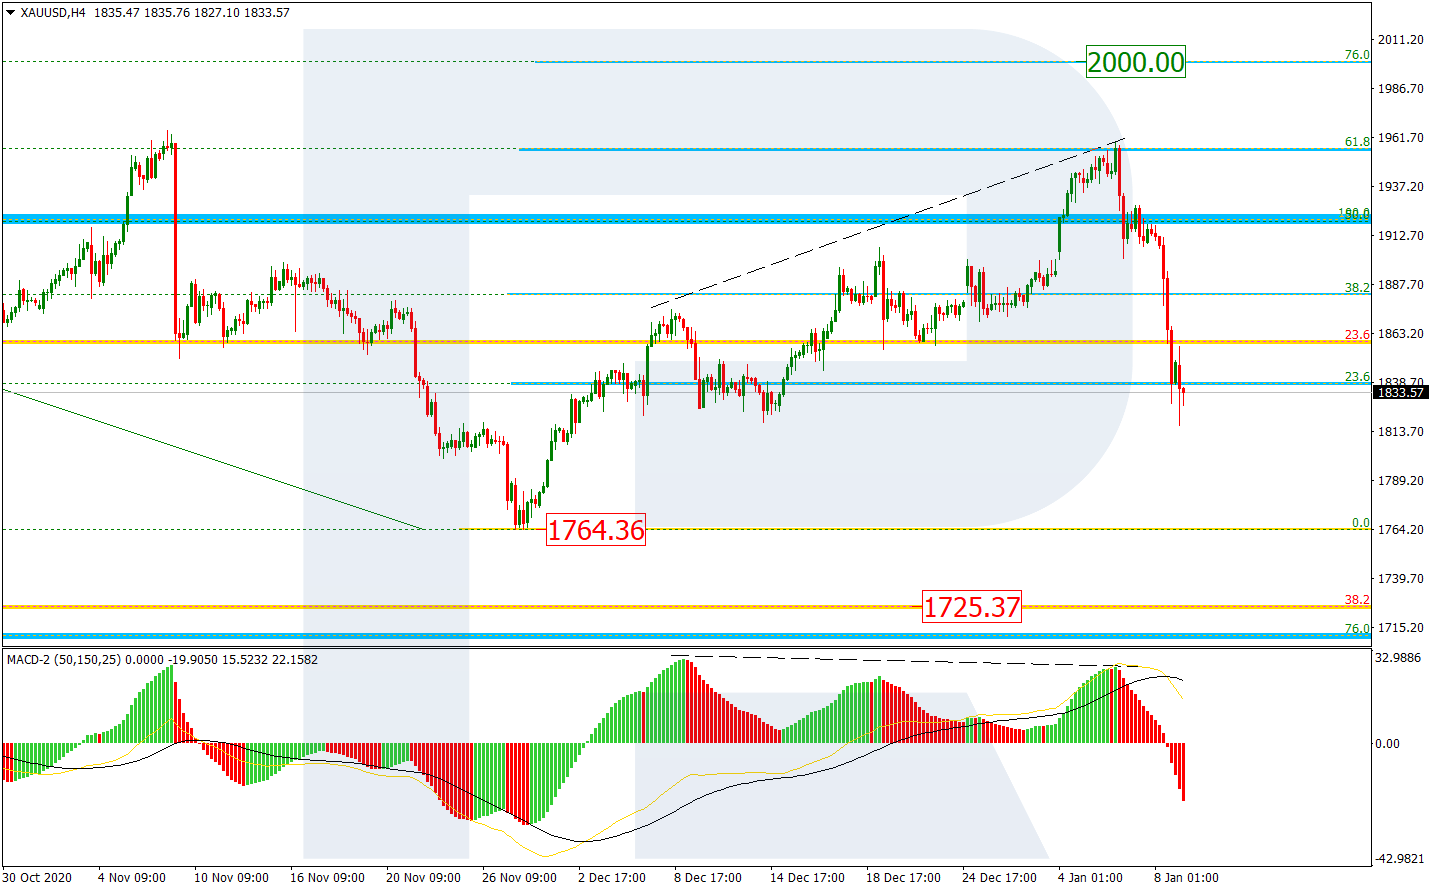
As we can see in the H4 chart, after a correctional movement in the form of a Triangle pattern and several tests of the high, XAUUSD has formed a quick rising impulse to break it. As a result, the mid-term uptrend has reached 50.0% fibo and may later continue towards 61.8% and 76.0% fibo at 1956.50 and 2000.00 respectively. However, one shouldn’t disregard a divergence on MACD, which may hint at further mid-term decline towards the key support – the low at 1764.36.

GOLD_H4
Risk Warning: the result of previous trading operations do not guarantee the same results in the future

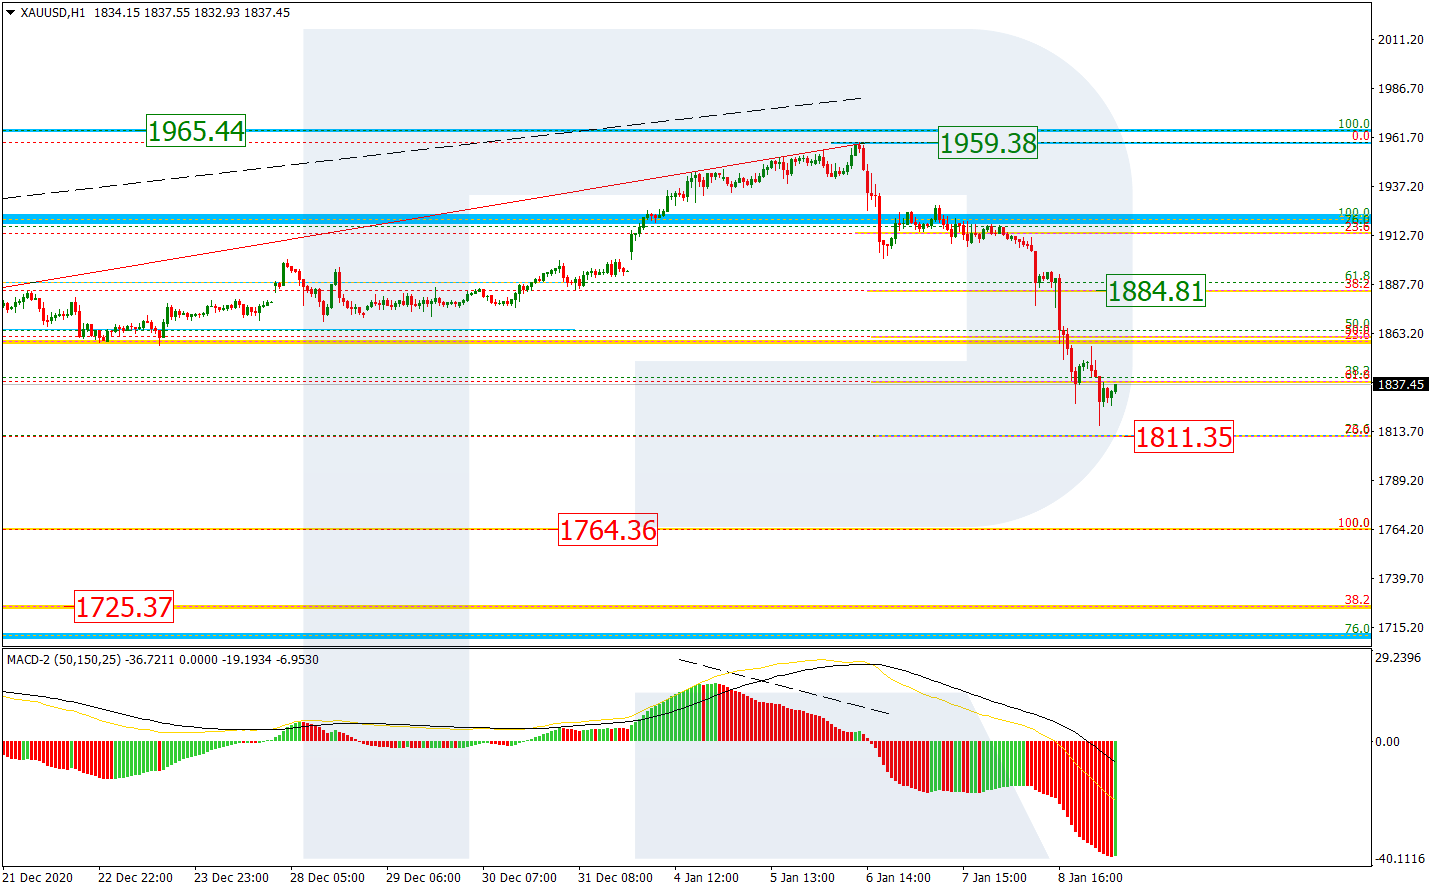
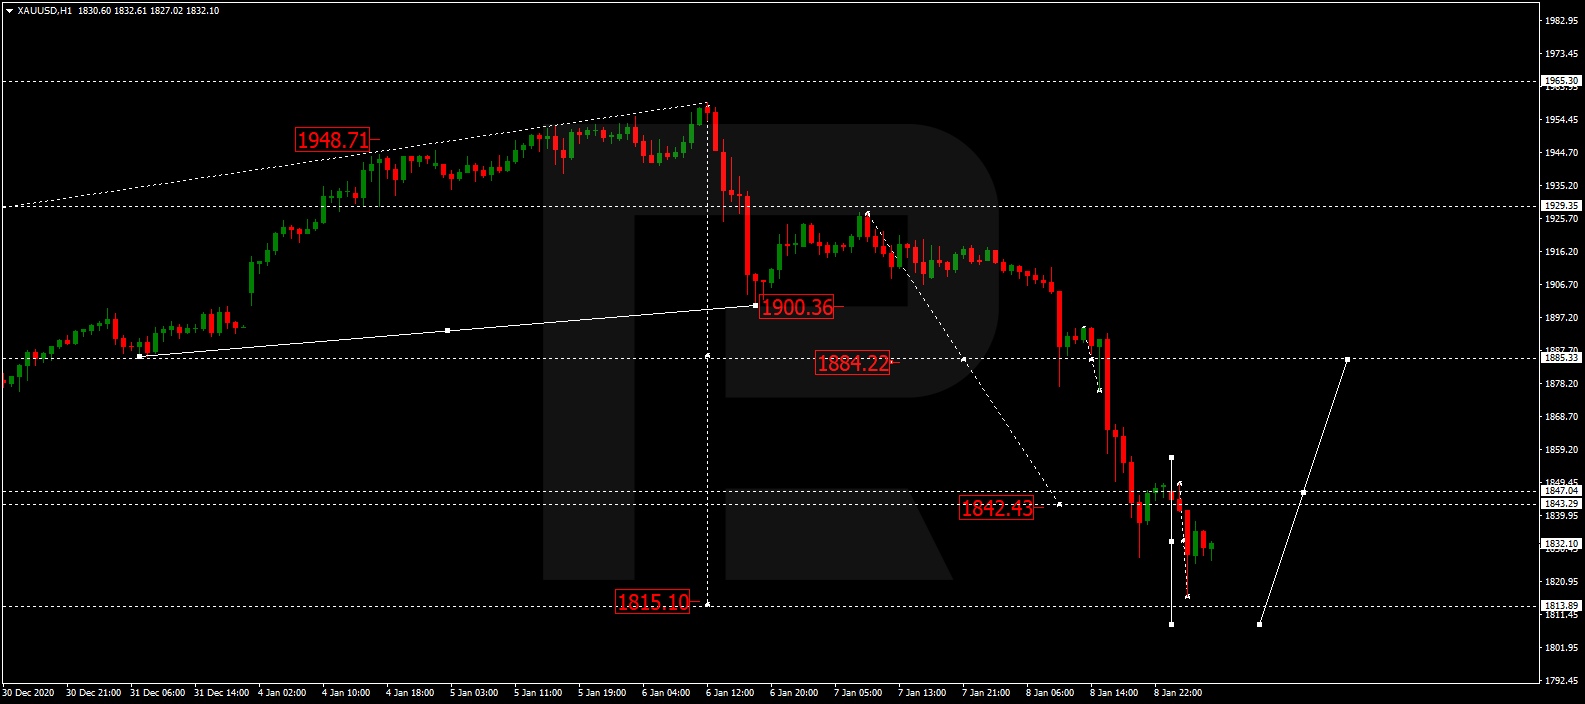
The H1 chart shows that the pair has reached 76.0% fibo. Considering a divergence on MACD, the asset may fall towards 23.6%, 38.2%, and 50.0% fibo at 1887.40, 1863.70, and 1845.00 respectively. However, a breakout of the local high at 1925.23 will result in further trend to the upside.

GOLD_H1
Risk Warning: the result of previous trading operations do not guarantee the same results in the future

USDCHF, “US Dollar vs Swiss Franc”

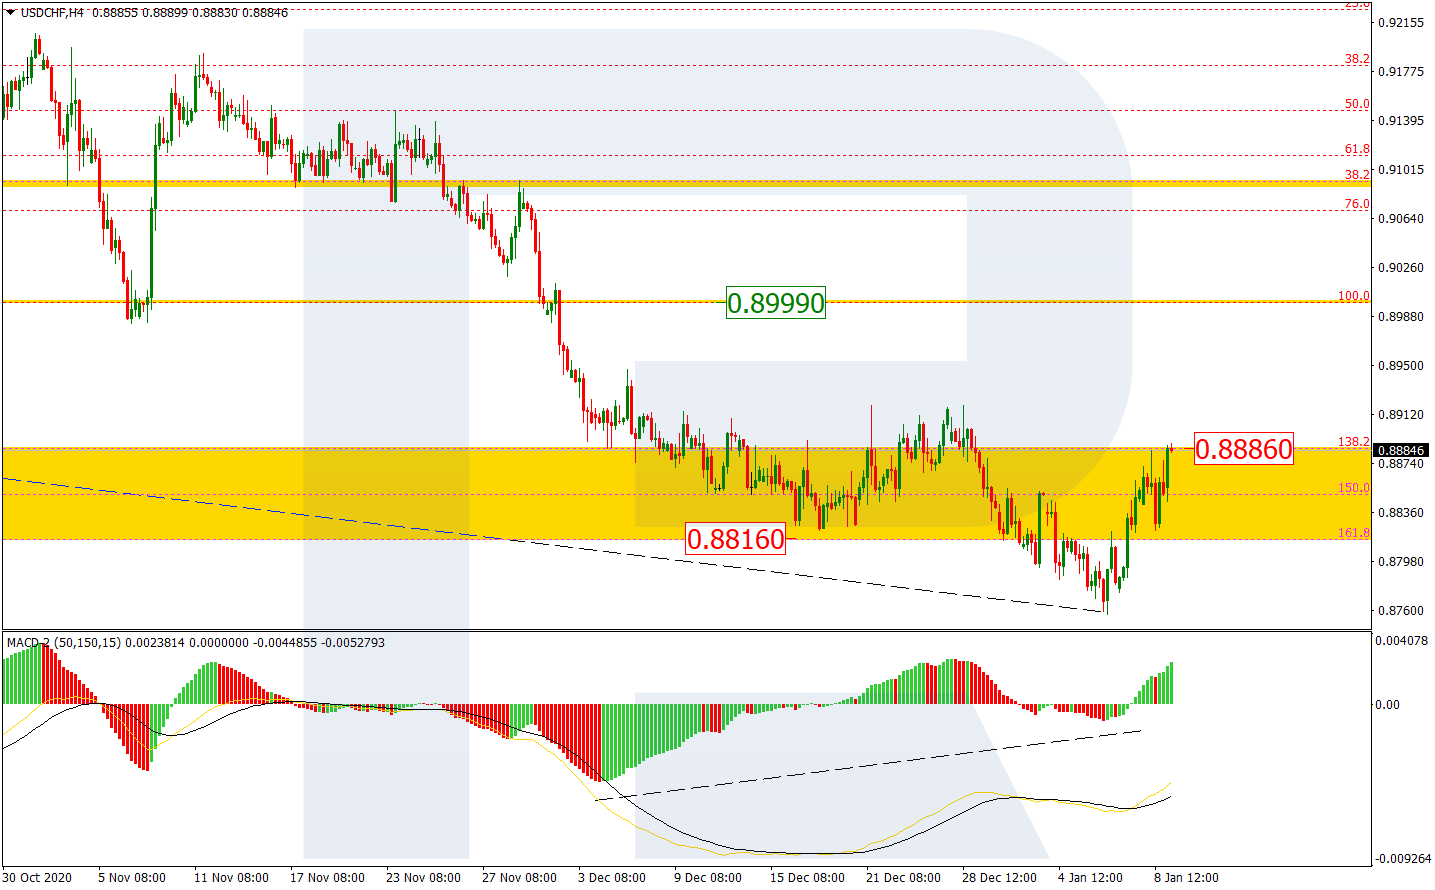
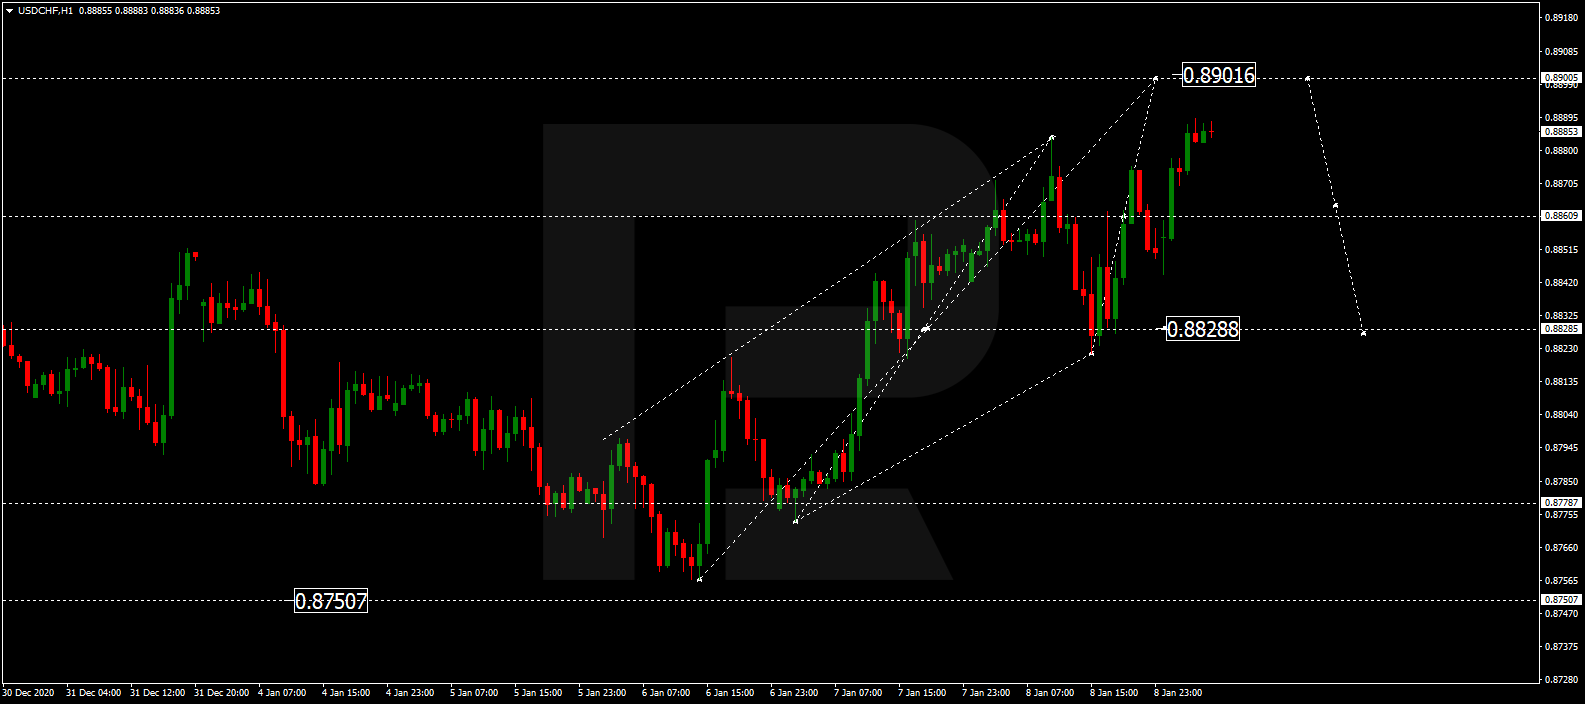
As we can see in the H4 chart, after updating the low and attempting to leave the post-correctional extension area between 138.2% and 161.8% fibo at 0.8886 and 0.8816 respectively, USDCHF has skyrocketed and this movement to the upside may be considered as the start of a new mid-term correction. The correctional target remains at the resistance at 0.8999.

USDCHF_H4
Risk Warning: the result of previous trading operations do not guarantee the same results in the future

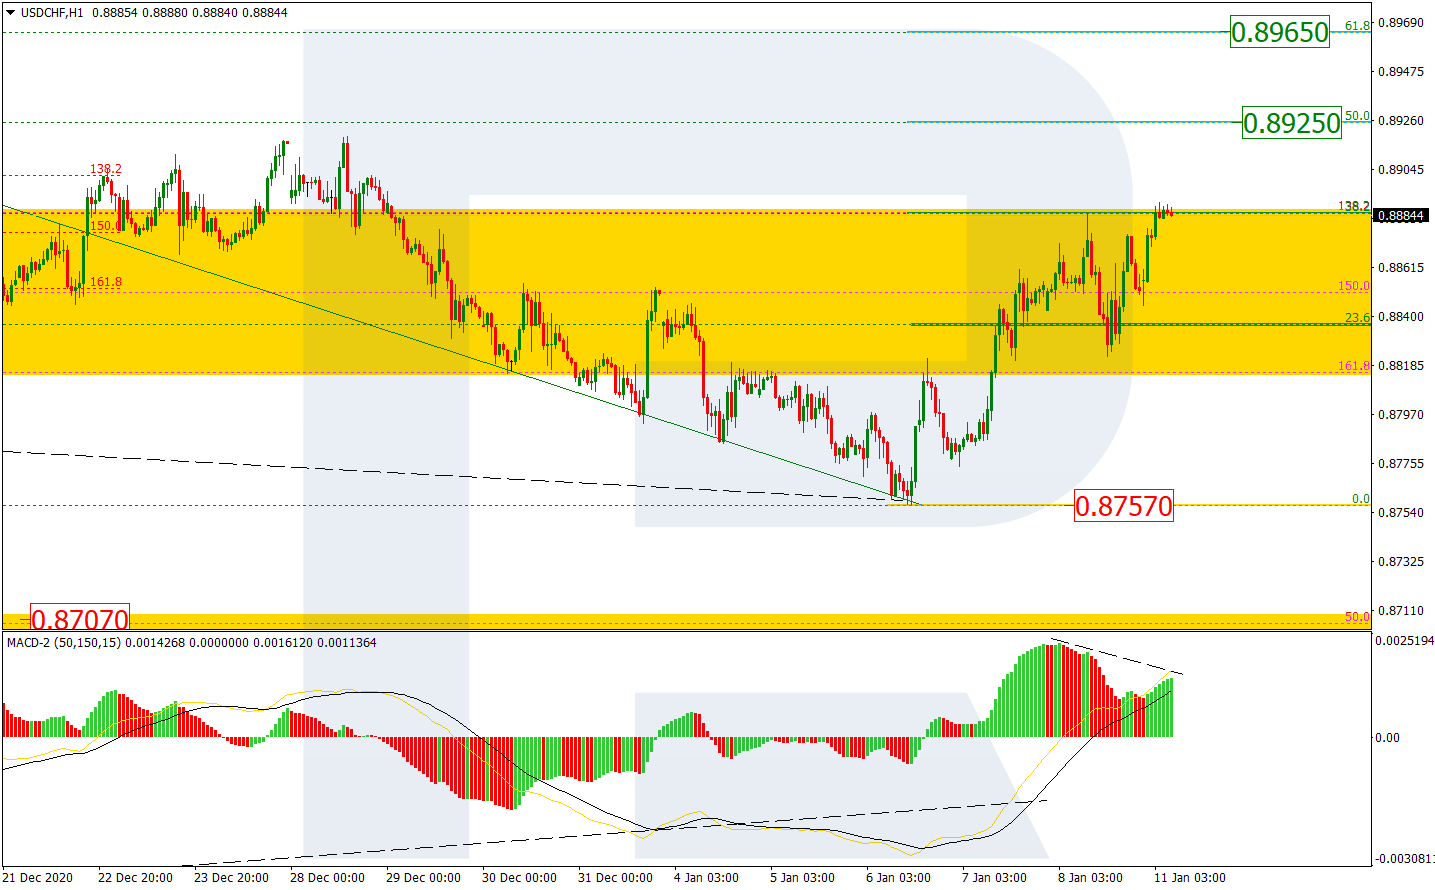
The H1 chart shows a more detailed structure of the correction after a convergence on MACD. The asset is approaching 23.6% fibo at 0.8864 and, after breaking it, may continue moving towards 38.2%, 50.0%, and 61.8% fibo at 0.8908, 0.8943, and 0.8979 respectively. A breakout of the support at 0.8793 will complete this correction.

USDCHF_H1

Article By RoboForex.com

Attention!
Forecasts presented in this section only reflect the author’s private opinion and should not be considered as guidance for trading. RoboForex LP bears no responsibility for trading results based on trading recommendations described in these analytical reviews.

The Analytical Overview of the Main Currency Pairs on 2021.01.04

by JustForex

The EUR/USD currency pair

Technical indicators of the currency pair:
  • Prev Open: 1.2297
  • Prev Close: 1.2216
  • % chg. over the last day: -0.66%

EUR/USD is recovering from Thursday’s fall. There were no particular reasons for the sharp decline. The credit market didn’t show any significant change in trading. The dollar index continues to remain close to the minimum values, continuing to decline in the Asian session. The pair remained in an ascending channel, bouncing off the nearest support.

Trading recommendations
  • Support levels: 1.2216, 1.2151
  • Resistance levels: 1.2309, 1.2353

The main trading scenario for EUR/USD is trading in a sideways range. Technically, the pair indicated the first sign of correction, breaking through the lower border of the channel. But considering the time when it happened, the break-through may turn out to be false. Now the euro is in an ascending channel again. The ADX almost didn’t react to the fall. The price is stuck between two moving averages. Given the mixed signals and the first day of trading, low volatility can be expected.

Alternative scenario: if the price can fix below the level of 1.2216, it is possible that the price will go lower to 1.2151 – 1.2130. A break-through of 1.2309 will resume the uptrend.

EUR/USD
News feed for 2021.01.04:
  • – German Manufacturing PMI (Dec.) at 11:55 (GMT+2);
  • – Eurozone Manufacturing PMI (Dec.) at 12:00 (GMT+2).

The GBP/USD currency pair

Technical indicators of the currency pair:
  • Prev Open: 1.3620
  • Prev Close: 1.3658
  • % chg. over the last day: +0.28%

The pound is gradually continuing to renew its highs, showing no signs of a correction. The pair is the strongest among all the majors. However, we can’t say the same about British securities. Gilts profitability continues to fall, throwing into question the further long-term growth of the sterling. But technically, the trend continues and the nearest resistance is far away.

Trading recommendations
  • Support levels: 1.3627, 1.3428
  • Resistance levels: 1.4386

The main scenario is risk-averse buying on a decline. The pair’s technical characteristics remain strong. The price is above the moving averages. But on the hourly timeframe, the ADX showed a decrease in the trend potential after moving into the overvalued area. On H4, the oscillator just hit this area. With that in mind, you should be vigilant when building up long positions.

Alternative scenario: if the pair fixes below 1.3627, the northern scenario is likely to reverse and the pair will head towards 1.3428.

GBP/USD
News feed for 2021.01.04:
  • – UK Manufacturing PMI (Dec.) at 12:30 (GMT+2).

The USD/JPY currency pair

Technical indicators of the currency pair:
  • Prev Open: 103.17
  • Prev Close: 103.26
  • % chg. over the last day: +0.08%

USD/JPY continues to be dominated by bears. With the opening of trading in Europe, the main support level was broken. Apparently, the move is based solely on the decline of the dollar index, as the stock market continues to rise. The 102.03 mark becomes the closest support in case the price fails to return above 102.89 during the day.

Trading recommendations
  • Support levels: 102.03, 101.20
  • Resistance levels: 103.33, 103.90

The main scenario – selling on growth. For the fourth trading day, the pair is confidently remaining below the moving averages. The MACD is below zero, while the ADX continues to react only to a decline. Now the potential for the trend has decreased, which may indicate a slowdown in the rate of decline. But there are no signs of correction yet.

An alternative scenario assumes a break-though of 103.33 from the bottom up. In this case, the pair may reach 103.90.

USD/JPY
There is no news feed for today.

The USD/CAD currency pair

Technical indicators of the currency pair:
  • Prev Open: 1.2751
  • Prev Close: 1.2757
  • % chg. over the last day: +0.05%

There was a large portion of bearish pressure with the opening of trades. A decline in the dollar and an increase in oil prices brought the pair back to the December lows. The market is awaiting a decision of OPEC+ concerning the extension of the production cut program. Against this background, serious changes can occur during the day.

Trading recommendations
  • Support levels: 1.2686, 1.2523
  • Resistance levels: 1.2875, 1.2954

The main scenario – risk-averse selling during growth. The MACD shows convergence, which gives confidence to the bears. But ADX didn’t show a significant reaction with a significant withdrawal of the price from the moving averages. At the same time, the price bounced off its strong support level, indicating a stop near current levels. Based on this, we can wait for the price to return to the SMA 50 at 1.2750 and try to build up sales in case of a rebound from the line.

Alternative scenario: if the price manages to return above 1.2750 – 1.2787, the pair may resume the upward correction.

USD/CAD
There is no news feed for today.

by JustForex


This article reflects a personal opinion and should not be interpreted as an investment advice, and/or offer, and/or a persistent request for carrying out financial transactions, and/or a guarantee, and/or a forecast of future events.


Dollar kicks off 2021 on the backfoot, Gold shines

By Hussein Sayed, Chief Market Strategist (Gulf & MENA), ForexTime

The Greenback remains an unloved currency on the first trading day of 2021. Low interest rates and an improving economic outlook following vaccines rollout has led to further short selling in the US Dollar, particularly against the Euro and Chinese Yuan.

China’s Renminbi strengthened 1% in early Monday trade, with USD/CNY crossing below 6.50 for the first time since June 2018. That has erased all Chinese currency losses since the US-China trade war kicked off officially in July 2018.  The strength in the Chinese Renminbi came despite slowing manufacturing activity. The Caixin/Markit manufacturing PMI slipped 1.9 points in December to 53.0. However, activity in the world’s second-largest economy remains in expansionary mode, while developed economies continue to impose lockdowns to control the virus spread.

Another supporting source for the currency comes from China’s Foreign Exchange Trade System which announced a reduction in the US Dollar’s weighting in the currency basket to 18.79% from 21.59%, while increasing the Euro’s weighting to 18.15% from 17.40%. The absence of any intervention from the PBOC or state banks would suggest further gains in the upcoming weeks with a possible retest of the 2018 lows of 6.24.

Tuesday’s Georgia Senate runoff elections will be critical for the US Dollar as a Democrat win of the two Senate seats could potentially unleash a lot more stimulus which simply suggests more pain for the Greenback.

Gold is also starting the new year with a bang as the precious metal has surged more than 1.2% and hit a high of $1925. Multiple factors are likely to continue lending support for Gold in the upcoming months. The pandemic will not disappear in a matter of weeks with tougher lockdowns also expected as Covid cases continue to rise. Hence central banks will need to keep policy loose by expanding their balance sheets. And given we are starting 2021 with extraordinarily rich valuations in equity markets, Gold is a must-have asset in portfolios. I think it’s only a matter of time before we cross back above $2,000 and I won’t be surprised if new highs are recorded in the first quarter of 2021.

Disclaimer: The content in this article comprises personal opinions and should not be construed as containing personal and/or other investment advice and/or an offer of and/or solicitation for any transactions in financial instruments and/or a guarantee and/or prediction of future performance. ForexTime (FXTM), its affiliates, agents, directors, officers or employees do not guarantee the accuracy, validity, timeliness or completeness, of any information or data made available and assume no liability as to any loss arising from any investment based on the same.


Forex-Time-LogoArticle by ForexTime

ForexTime Ltd (FXTM) is an award winning international online forex broker regulated by CySEC 185/12 www.forextime.com

Cautious start to New Year

By Han Tan, Market Analyst, ForexTime

A Happy New Year to you (even though markets don’t appear overly jubilant at the time of writing).

Investors apparently have had enough merry-making and are getting down to business on this first trading day of 2021. After all, there are a few key events that could trigger heightened market volatility this week.

US political risks may prompt pause in stocks rally

S&P 500 futures are holding steady during the Asian morning session, after the benchmark index registered a new record high on 31 December 2020. Still, some apprehension may creep into equity markets as investors await the official outcomes of the Georgia Senate runoffs on Tuesday.

One only has to revisit the declines in the S&P 500 leading up to the Nov. 3 elections as a reminder that markets generally do not delight in political uncertainty.


Gold breaks out of downtrend

Gold bulls are however starting off the new year on the right foot, as the precious metal broke meaningfully above the psychologically-important $1900 level for the first time in nearly two months.

The weaker US Dollar, which is expected to be a prolonged theme in 2021, has allowed Bullion to breach the upper bounds of its recent downtrend.

From a fundamental perspective, Gold’s role as a hedge against inflation is buffered as the Federal Reserve maintains its ultra-accommodative stance, coupled with expectations for bigger incoming US fiscal stimulus, especially if Democrats garner enough political muscle after the Georgia Senate runoffs. With a key momentum indicator (MACD) pointing north, Gold prices may seek to be restored to its 2020 glory days, fueled by investors attempts to hedge against the expected overshoot in US inflation.


Oil edges higher ahead of key OPEC+ decision

Today’s OPEC+ supply decision however is of more immediate importance for Oil investors, as the alliance of major producers gather to decide whether to increase their output in February. After having raised their collective production by 500,000 barrels per day (bpd) at the start of 2021, OPEC+ has to ascertain today whether the global economy is ready to absorb more of its supplies next month.

The alliance not only has to contend with an uncertain global economic outlook, but also competing interests within the group. Some need Oil prices to push even higher from current levels by way of keeping output unchanged while allowing the global economy to recover. Others are more concerned about being to sell more of their Oil to gain some much-needed income and market share as they’re already comfortable with where prices are at currently.

In short, OPEC+ must tread carefully or risk unwinding some of the the near-170 percent gains in Brent that have been recorded since April.


Disclaimer: The content in this article comprises personal opinions and should not be construed as containing personal and/or other investment advice and/or an offer of and/or solicitation for any transactions in financial instruments and/or a guarantee and/or prediction of future performance. ForexTime (FXTM), its affiliates, agents, directors, officers or employees do not guarantee the accuracy, validity, timeliness or completeness, of any information or data made available and assume no liability as to any loss arising from any investment based on the same.


Forex-Time-LogoArticle by ForexTime

ForexTime Ltd (FXTM) is an award winning international online forex broker regulated by CySEC 185/12 www.forextime.com

The market is waiting for the OPEC+ decision. Gold increased sharply against the background of a significant drop in bond yields

by JustForex

The market opening after the holidays looks somewhat alarming. S&P 500 futures demonstrates growth against the background of a surge in oil prices, but other parts of the market indicate that investors are looking for defensive assets. Bond yields are decreasing and gold moved sharply to growth. The mining companies and energy sector are the growth leaders.

Economic growth continues to gradually recover. PMI points to the continued consistent growth in Asia, boosted by strong demand for Chinese exports, although China’s recovery has slowed down slightly. Against this background, European stocks started trading with confidence, adding 0.45%.

But the overall market direction isn’t synchronous. The yield of the British Gilts approached their historical lows and reached 0.155%. German Bonds fell to -0.615%. American Treasuries decreased by 0.920%. After such a sharp drop in yields, gold rose sharply in price, reaching $ 1930 per troy ounce.

The outbreak of new diseases may push investors to seek protective assets. The US has set a new daily record of 300,000 infections. A state of emergency is being considered in Tokyo. Against this background, Japanese indices are inferior to others.

Today, investors will be focused on the OPEC+ decision on oil production. It’s interesting for the market whether the participating countries will be able to come to an agreement at which oil prices will continue to rise. In anticipation of a positive decision, oil futures renewed their highs.

Stock indices are demonstrating steady growth, while the dollar is declining.

S&P 500 (F) 3,762.62 +13.87 (+0.37%)

Dow Jones 30,606.48 +196.92 (+0.65%)

DAX 13,796.70 +77.92 (+0.57%)

FTSE 100 6,598.55 +138.03 (+2.14%)

USD Index 89.495 -0.399 (-0.44%)

Important events:
  • – German Manufacturing PMI (Dec.) at 11:55 (GMT+2);
  • – Eurozone Manufacturing PMI (Dec.) at 12:00 (GMT+2);

by JustForex


This article reflects a personal opinion and should not be interpreted as an investment advice, and/or offer, and/or a persistent request for carrying out financial transactions, and/or a guarantee, and/or a forecast of future events.
The Analytical Overview of the Main Currency Pairs on 2020.12.31

by JustForex

The EUR/USD currency pair

Technical indicators of the currency pair:
  • Prev Open: 1.2248
  • Prev Close: 1.2296
  • % chg. over the last day: +0.39%

EUR/USD accelerated growth, although there were not many drivers for this. Everything now looks more like a pre-New Year rally, in which the dollar is declining in most cases. The yield on German Bonds continued to fall, which casts doubt on the further growth of the euro. However, the chart shows a consolidation above the December 18 high and a new annual record is set.

Trading recommendations
  • Support levels: 1.2353, 1.2414
  • Resistance levels: 1.2216, 1.2151

The main scenario for EUR/USD trading is cautious buying on a decline. Technically, the pair is not yet giving hints of the end of the northern trend. The price is confidently holding in the local ascending channel and above the moving averages. However, divergence began to form on the MACD, and the trend potential indicator is declining. Against this background, long positions must be insured and caution should be exercised when opening new ones.

Alternative scenario: if the price can consolidate below the level of 1.2272, the price may move further to 1.2236 – 1.2216, and the breakdown of the last point may signal a complete reversal.

EUR/USD
News feed for 2020.12.31:
  • – 16:30 (GMT+2) The number of initial claims for unemployment benefits in the United States.

The GBP/USD currency pair

Technical indicators of the currency pair:
  • Prev Open: 1.3497
  • Prev Close: 1.3621
  • % chg. over the last day: +0.91%

The pound renewed its annual highs given Boris Johnson’s support from the House of Commons. But as it is the case for the euro, there are no other fundamental factors for the bulls. Despite the positive end of the year in politics for Britain, the Gilts yield remained close to annual lows at 0.200%, which raises doubts about the continuation of the rally.

Trading recommendations
  • Support levels: 1.3287, 1.3187
  • Resistance levels: 1.3657, 1.4386

The main scenario is cautious buying on a decline. Now the technical characteristics of the pair are very strong. If there are hints of an impending correction in the euro, then in this case, there are none at all. The pair is trading above the moving averages. ADX continues high, indicating high bullish pressure. 1.3657 is the nearest all-time high, a breakout of which could send the pair towards 1.43.

Alternative scenario: if the pair consolidates below 1.3541, the northern scenario is likely to cancel and the pair will head towards 1.3428.

GBP/USD
There is no news feed for today.

The USD/JPY currency pair

Technical indicators of the currency pair:
  • Prev Open: 103.52
  • Prev Close: 103.18
  • % chg. over the last day: -0.33%

With the breakdown of the main majors of its annual highs, the dollar-yen succumbed to the correlation and returned to the December lows. In this pair, there is no reason for growth at all. The yen does not react to the growth of risky assets, and in the absence of growth in yields on the credit market, everything looks like a stable bearish trend.

Trading recommendations
  • Support levels: 103.26, 102.89
  • Resistance levels: 103.90, 104.15

The main scenario is selling on growth. The closing of trading on Wednesday showed an acceleration in the fall. The MACD is showing divergence, hinting at a possible correction, but the ADX is indicating still strong bearish pressure. 102.89 is the last historical line, a breakout of which can send the instrument to 101.19 – the low of March this year.

An alternative scenario assumes a breakdown of 103.50 from the bottom up. In this case, the pair may reach the area of 103.90 – 104.15.

USD/JPY
News feed for 2020.12.31:
  • – 16:30 (GMT+2) The number of initial claims for unemployment benefits in the United States.

The USD/CAD currency pair

Technical indicators of the currency pair:
  • Prev Open: 1.2814
  • Prev Close: 1.2750
  • % chg. over the last day: -0.50%

USD/CAD was actually following the general market trend based on the dollar’s decline. Oil quotes are consolidating slightly below their annual highs, but the pair has accelerated its decline. Today the news background is empty and early closing is expected. There will probably not be a significant change in price within the day.

Trading recommendations
  • Support levels: 1.2686
  • Resistance levels: 1.2875, 1.2954

The main scenario is selling on growth. MACD is firmly entrenched in the negative area. ADX, despite the steady price movement in the south direction, shows a decrease in the trend potential. This is an indirect sign of a slowdown in the fall and, possibly, a stop. But for now, the bears remain strong. In this regard, the southern scenario remains relevant.

Alternative scenario: if the price manages to return above 1.2811, the pair may resume the upward correction.

USD/CAD
There is no news feed for today.

by JustForex


This article reflects a personal opinion and should not be interpreted as an investment advice, and/or offer, and/or a persistent request for carrying out financial transactions, and/or a guarantee, and/or a forecast of future events.

The end of the year is restful for investors. Indexes are at their highs, the dollar is at its lows

by JustForex

Despite the ongoing pandemic, the year on the stock exchanges is ending near historic highs. Bullish sentiment has lifted risky assets this year to unexpectedly high valuations on the expectation that vaccinations in 2021 will resume economic growth and boost corporate profits, amid unprecedented stimuli. The MSCI World Global Stock Index ended up growing 14% for the full year of 2020.

Banks and funds representatives see no reason to reverse. The conclusion of the Brexit agreement, the start of vaccinations and economic stimulus programs by central banks without expectations of an increase in interest rates can keep playing on the side of the bulls for a long time. The Fed, in its economic review, provided a projection in which the first rate hike could be only after 2023. Due to the more stable growth of inflation in the US compared to Europe, as well as huge cash injections into the economy, the downtrend in the dollar may continue next year.

Against this background, the benchmark S&P 500 index confidently entrenched above 3700. Many analysts on Wall Street are convinced that there is nothing to prevent stocks from rising next year, and the index can rise above 4000.

Expectations of economic growth are also observed in oil quotes. Brent oil is confidently holding above $ 50 per barrel, WTI is about $ 48. The manufacturing sector of advanced economies is gradually recovering, supporting the demand for black gold.

Major stock indexes are trading as usual and in different directions. The dollar index continues to decline.

S&P 500 (F) 3,717.62 -6.63 (-0,18%)

Dow Jones 30,409.56 +73.89 (+0.24%)

DAX 13,718.78 -42.60 (-0.31%)

FTSE 100 6,443.91 -111.91 (-1.71%)

USD Index 89.517 -0.132 (-0.15%)

Important events:
  • – 04:00 (GMT+2) Manufacturing PMI (Dec);
  • – 16:30 (GMT+2) Number of initial applications for unemployment benefits.

by JustForex


This article reflects a personal opinion and should not be interpreted as an investment advice, and/or offer, and/or a persistent request for carrying out financial transactions, and/or a guarantee, and/or a forecast of future events.
Key events in first full week of 2021

By Han Tan, Market Analyst, ForexTime

Much has already been made of the year that was. 2020 was unprecedented in so many ways, which made it truly unforgettable.

And while the world will understandably be hoping for some calm and serenity as they ring in the new year, investors will have to remain vigilant because 2021 is set to kick off on an eventful note for global financial markets.

  • Monday, 4 January: OPEC+ decision on February output
  • Tuesday, 5 January: Georgia Senate runoffs
  • Wednesday, 6 January: Last chance saloon for Trump’s election challenge
  • Friday, 8 January: US December non-farm payrolls


Monday, 4 January: OPEC+ decision on February output

OPEC+ is scheduled to decide on their output levels for February 2021at the onset of the week, as they attempt to maintain a fine balance between members’ fiscal funding demands and a global outlook that remains uncertain.

Another output hike should keep Oil rangebound, while a no-change decision could lift the commodity’s prices higher.

But with Saudi Arabia Energy Minister Crown Prince Abdulaziz bin Salman stating his intent to keep speculators on their toes, Oil markets could face a tense start to the first full week of the new year.


Tuesday, 5 January: Georgia Senate runoffs

The outcome from this political contest could well set the tone for US equities for the year ahead. Should Democrats win those two Senate seats that are up for grabs, US stock benchmarks could push higher on expectations for more incoming fiscal stimulus under the Biden administration.

However, tech stocks may flounder on anticipation of more regulations and potential corporate tax hikes, as is typically associated with a Democrat in the White House.

Expect delays to the official runoff results a la November’s presidential election.


Wednesday, 6 January: Last chance saloon for Trump’s election challenge

The US Senate and the House are set to officially count the electoral votes for the next US President.

President Trump’s ardent supporters within Congress have threatened to thrown a wrench into the works so as to keep him in the White House. However, according to the Congressional Research Service, this process within Congress has never been able to overturn the presidential election outcome to date.

Such an event could blindside investors and trigger wild gyrations in global financial markets, potentially triggering a rebound in the US Dollar index.


Friday, 8 January: US December non-farm payrolls

The upcoming US jobs report could well have a major say on the US monetary and fiscal policy outlooks. Markets are expecting an NFP print of just 85,000 jobs added in December, which is a far cry from the 1.6 million jobs that were added monthly on average over the six months prior. A worse-than-expected reading would light a fire under the incoming administration to roll out even more fiscal stimulus.

Such a narrative may help Gold prices break out of the upper bounds of its current downtrend and stay above the psychologically-important $1900 level.


Disclaimer: The content in this article comprises personal opinions and should not be construed as containing personal and/or other investment advice and/or an offer of and/or solicitation for any transactions in financial instruments and/or a guarantee and/or prediction of future performance. ForexTime (FXTM), its affiliates, agents, directors, officers or employees do not guarantee the accuracy, validity, timeliness or completeness, of any information or data made available and assume no liability as to any loss arising from any investment based on the same.


Forex-Time-LogoArticle by ForexTime

ForexTime Ltd (FXTM) is an award winning international online forex broker regulated by CySEC 185/12 www.forextime.com

Ichimoku Cloud Analysis 30.12.2020 (USDJPY, EURUSD, AUDUSD)

Article By RoboForex.com

USDJPY, “US Dollar vs Japanese Yen”

USDJPY is trading at 103.34; the instrument is moving below Ichimoku Cloud, thus indicating a descending tendency. The markets could indicate that the price may test the cloud’s upside border at 103.55 and then resume moving downwards to reach 102.45. Another signal in favor of further downtrend will be a rebound from the rising channel’s downside border. However, the bearish scenario may no longer be valid if the price breaks the cloud’s upside border and fixes above 103.95. In this case, the pair may continue growing towards 104.75.

USDJPY
Risk Warning: the result of previous trading operations do not guarantee the same results in the future

EURUSD, “Euro vs US Dollar”

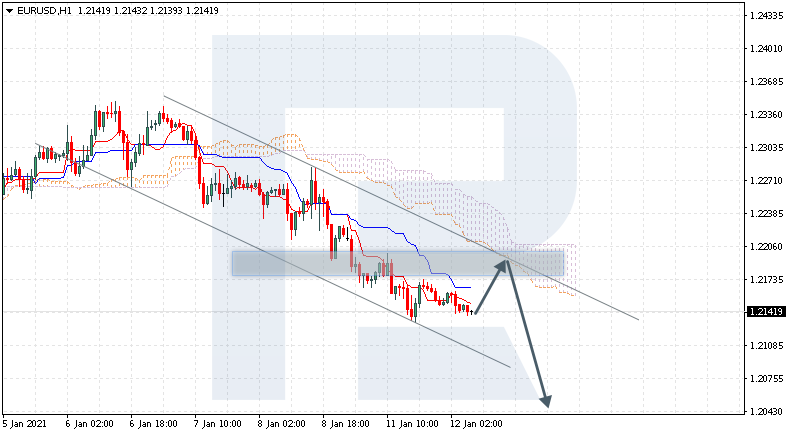
EURUSD is trading at 1.2279; the instrument is moving above Ichimoku Cloud, thus indicating an ascending tendency. The markets could indicate that the price may test the cloud’s upside border at 1.2255 and then resume moving upwards to reach 1.2345. Another signal in favor of further uptrend will be a rebound from the rising channel’s downside border. However, the bullish scenario may be canceled if the price breaks the cloud’s downside border and fixes below 1.2205. In this case, the pair may continue falling towards 1.2115.

EURUSD
Risk Warning: the result of previous trading operations do not guarantee the same results in the future

AUDUSD, “Australian Dollar vs US Dollar”

AUDUSD is trading at 0.7651; the instrument is moving above Ichimoku Cloud, thus indicating an ascending tendency. The markets could indicate that the price may test Tenkan-Sen and Kijun-Sen at 0.7625 and then resume moving upwards to reach 0.7705. Another signal in favor of further uptrend will be a rebound from the rising channel’s downside border. However, the bullish scenario may no longer be valid if the price breaks the cloud’s downside border and fixes below 0.7575. In this case, the pair may continue falling towards 0.7485.

AUDUSD

Article By RoboForex.com

Attention!
Forecasts presented in this section only reflect the author’s private opinion and should not be considered as guidance for trading. RoboForex LP bears no responsibility for trading results based on trading recommendations described in these analytical reviews.

Japanese Candlesticks Analysis 30.12.2020 (USDCAD, AUDUSD, USDCHF)

Article By RoboForex.com

USDCAD, “US Dollar vs Canadian Dollar”

As we can see in the H4 chart, the descending tendency continues. Right now, after forming several reversal patterns, such as Doji, not far from the resistance level, USDCAD is reversing in the form of another descending impulse and may later continue falling within the descending channel. in this case, the downside target will be at 1.2685. However, an alternative scenario implies that the price may start a new pullback to reach 1.2900 before resuming its decline.

USDCAD
Risk Warning: the result of previous trading operations do not guarantee the same results in the future

AUDUSD, “Australian Dollar vs US Dollar”

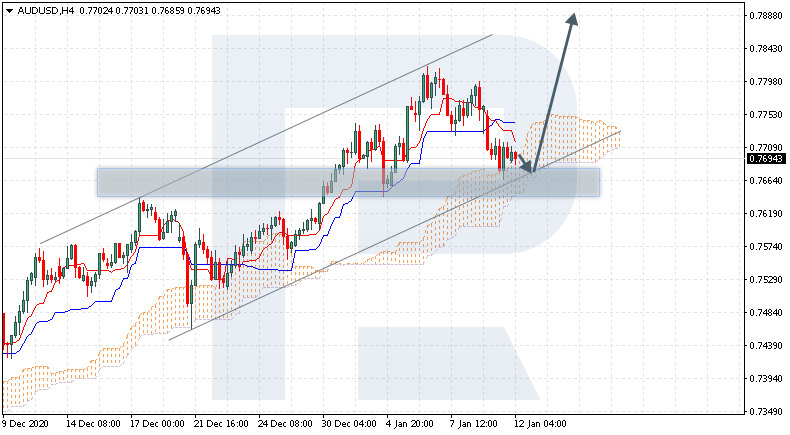
As we can see in the H4 chart, AUDUSD continues growing within the rising channel. Right now, after forming several reversal patterns, such as Harami, not far from the support area, the pair may reverse and then resume growing to reach the next resistance area at 0.7700. At the same time, an opposite scenario says that the price may correct towards 0.7575 before resuming the ascending tendency.

AUDUSD
Risk Warning: the result of previous trading operations do not guarantee the same results in the future

USDCHF, “US Dollar vs Swiss Franc”

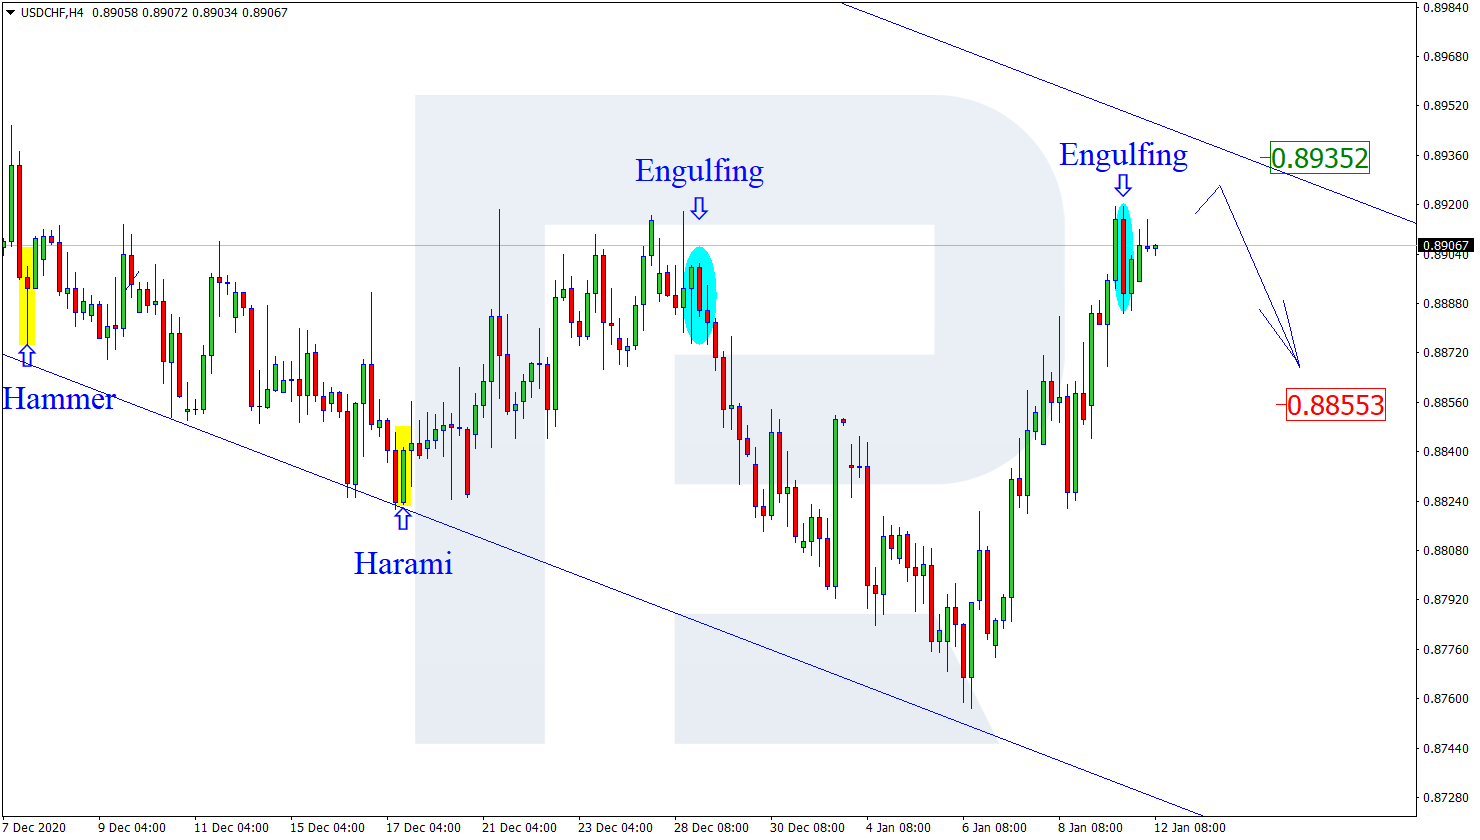
As we can see in the H4 chart, the downtrend continues. At the moment, after forming several reversal patterns, such as Engulfing, not far from the resistance area, USDCHF is reversing and may continue the descending tendency. In this case, the downside target may be the next support area at 0.8770. Still, there might be an alternative scenario, according to which the asset may grow to return to 0.8900 before testing the support area.

USDCHF

Article By RoboForex.com

Attention!
Forecasts presented in this section only reflect the author’s private opinion and should not be considered as guidance for trading. RoboForex LP bears no responsibility for trading results based on trading recommendations described in these analytical reviews.