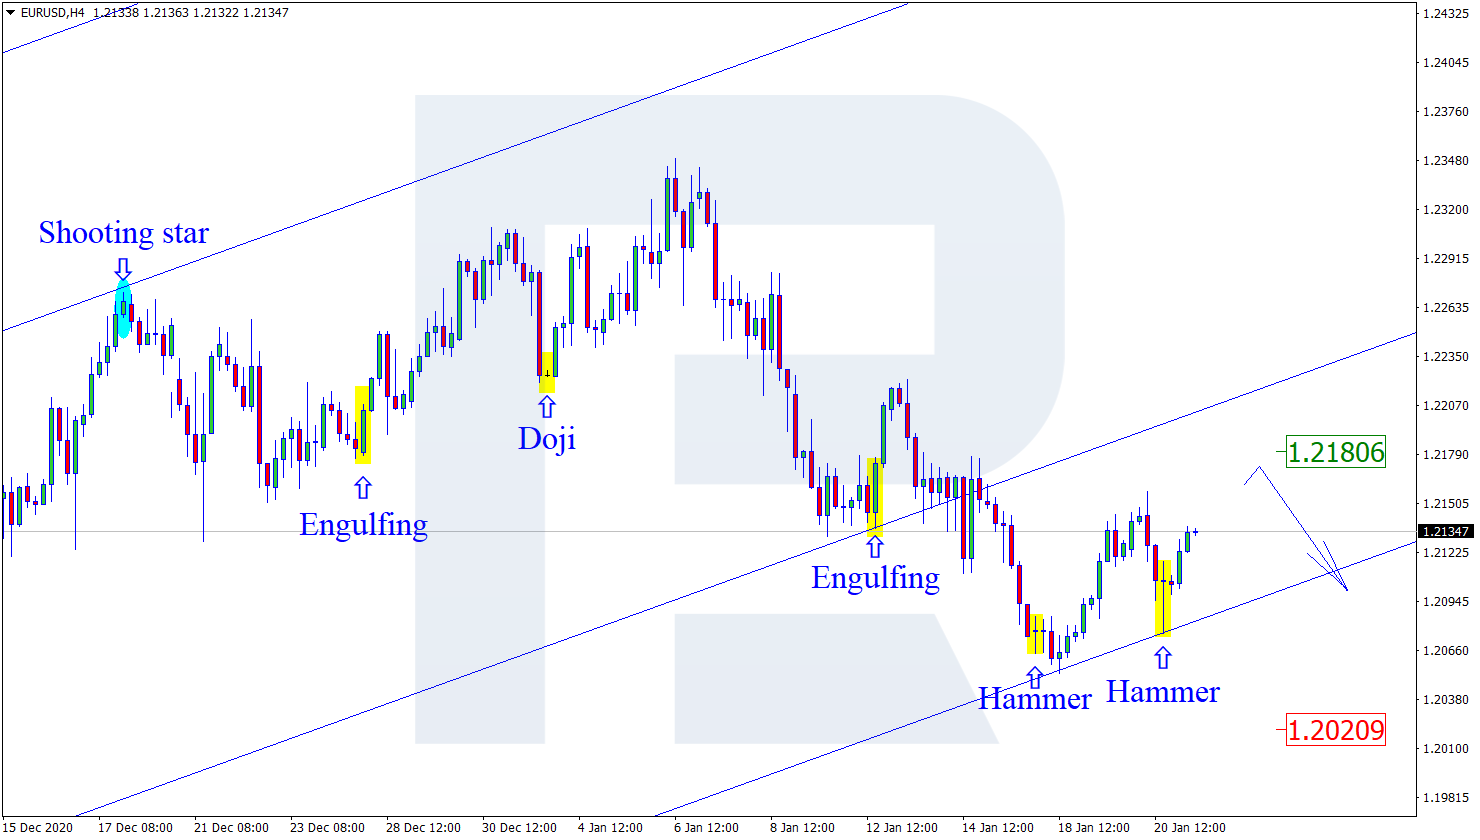
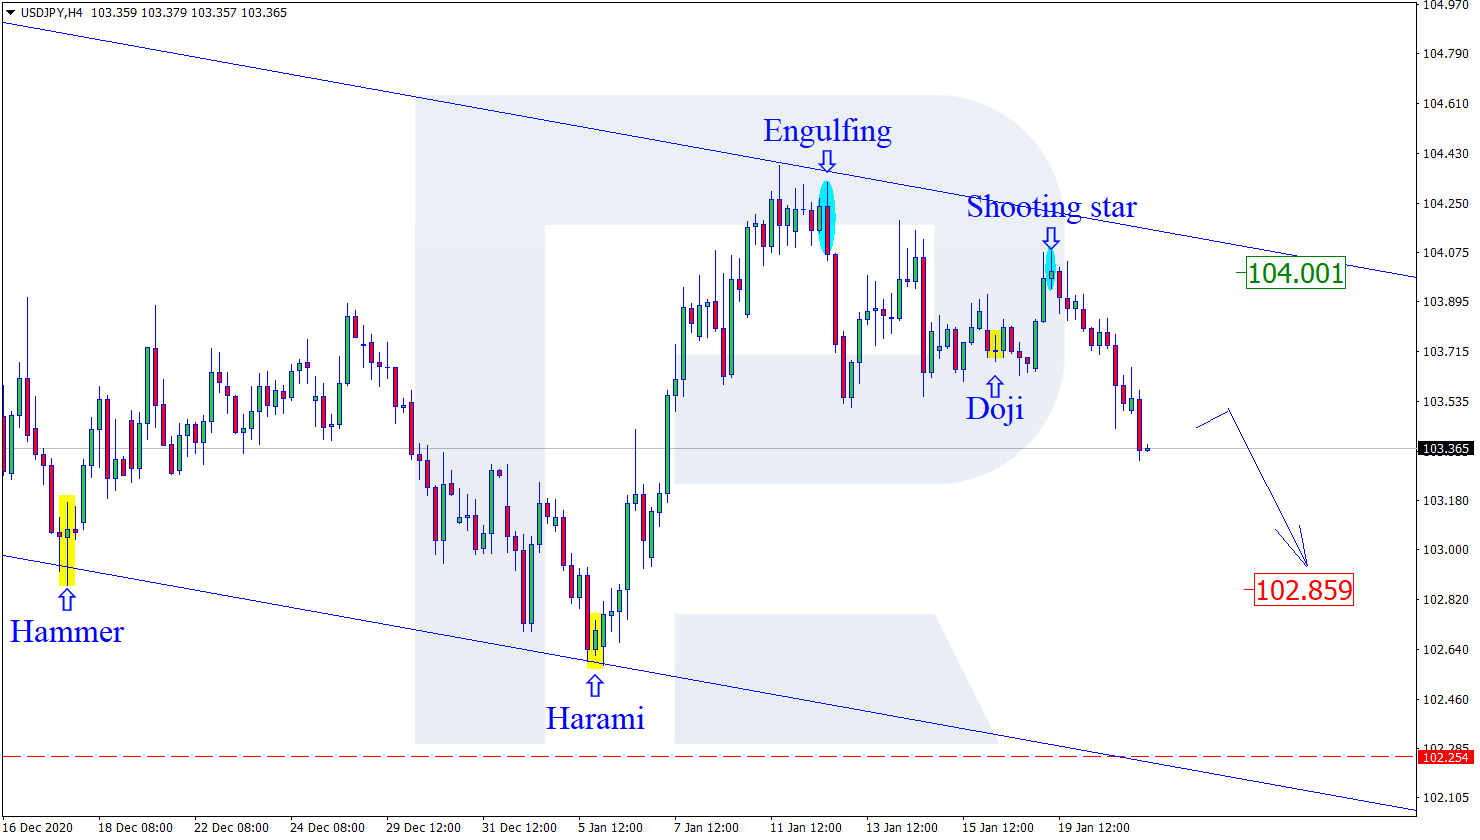
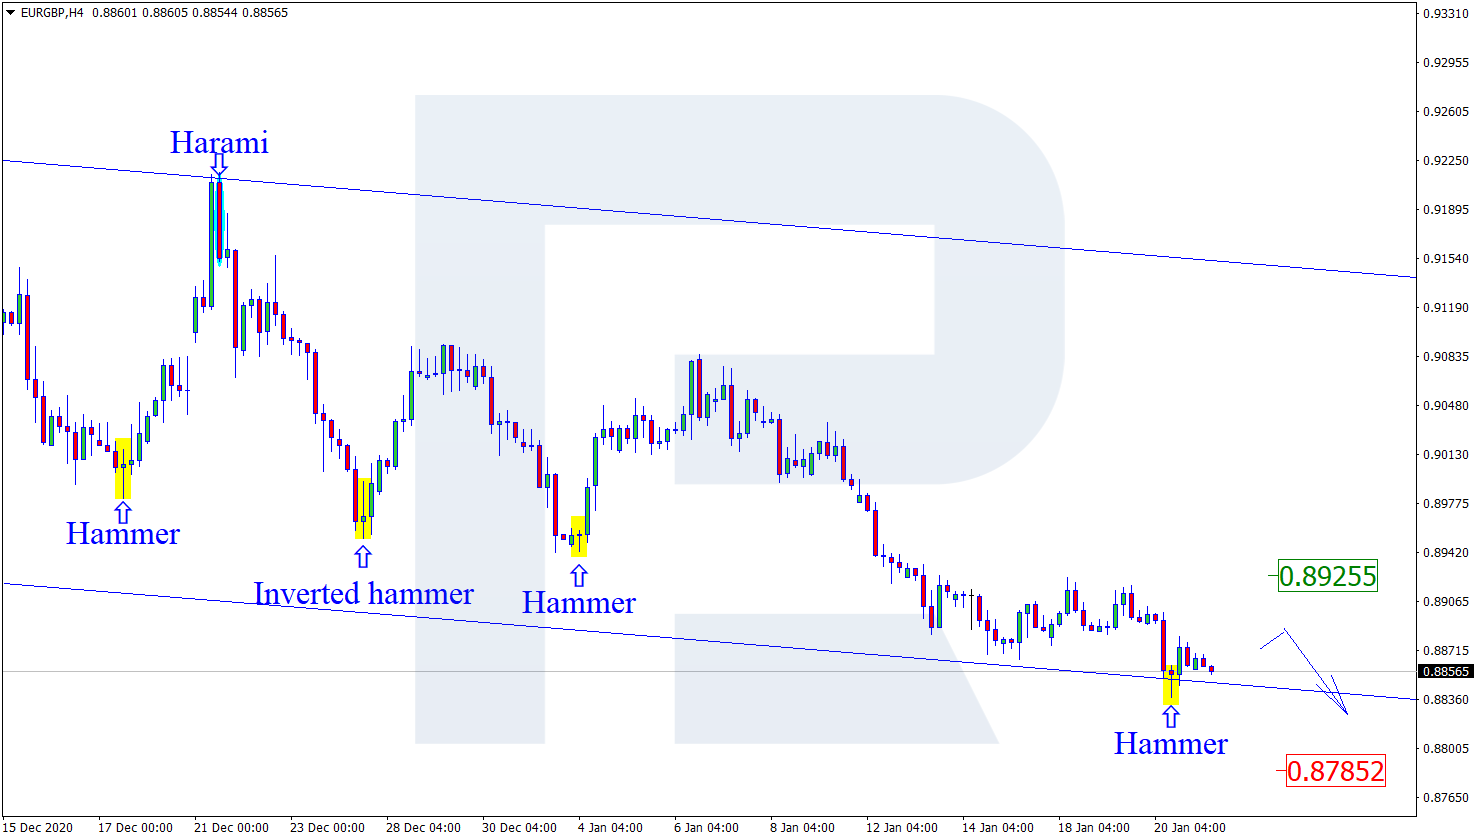
As we can see in the H4 chart, the pair is forming another correctional wave. Right now, after forming a Harami reversal pattern not far from the support level, USDCAD may reverse in the form of another pullback. Later, the asset may continue falling within the descending channel. In this case, the downside target will be at 1.2585. However, an alternative scenario implies a more significant correction towards the channel’s upside border at 1.2765 before the instrument resumes its decline.
AUDUSD, “Australian Dollar vs US Dollar”
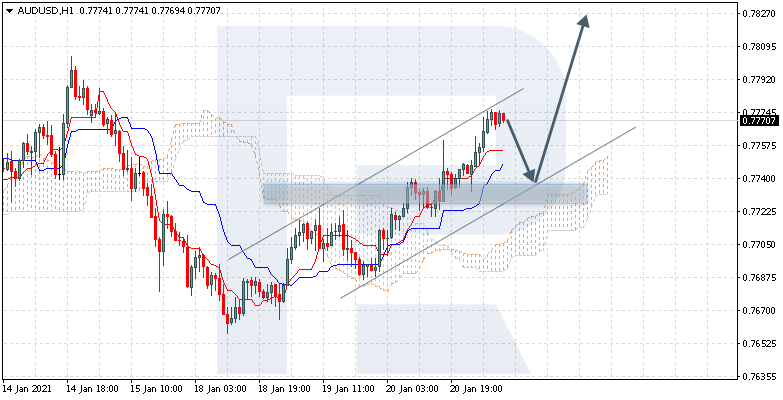
As we can see in the H4 chart, AUDUSD is correcting again. Right now, after forming several reversal patterns, such as Harami, not far from the resistance area, the pair may reverse and resume falling to reach the support area at 0.7720. At the same time, an opposite scenario says that the price may grow to reach 0.7835 without correcting towards the support level.
USDCHF, “US Dollar vs Swiss Franc”
As we can see in the H4 chart, the correction within the downtrend continues. At the moment, after forming several reversal patterns, such as Engulfing, not far from the resistance area, USDCHF is reversing and may continue the descending tendency. In this case, the downside target may be the next support area at 0.8830. Still, there might be an alternative scenario, according to which the asset may grow to return to 0.8915 before testing the support area.
Attention! Forecasts presented in this section only reflect the author’s private opinion and should not be considered as guidance for trading. RoboForex LP bears no responsibility for trading results based on trading recommendations described in these analytical reviews.
On Thursday, the market was awaiting details of Joe Biden’s plan for economic aid. The emergence of detailed information has not yet been able to inspire investors to buy risky assets. The plan includes a new wave of household spending by increasing direct payments. It also provides for an increase in unemployment benefits and the amount of funds for state and local authorities, as well as an expansion of vaccination programs and testing for coronavirus. The need to establish a federal minimum wage of $15 per hour and strengthen protection against eviction of citizens from occupied housing in case of impossibility of payment is indicated.
The market is not yet responding to the expected aid package, as it must be passed in Congress, and the numbers are close to those previously published in the media. Investors took a wait and see attitude in anticipation of the problems associated with the adoption of such a package. Most traders are convinced that Republican opposition will discourage the adoption of this amount of incentive.
Meanwhile, the publication of data on economic growth continues in Europe. Following Germany, Great Britain reported. The economy of foggy Albion has proved to be more resilient than expected. The decline in GDP in monthly terms by 2.6% was better than expected. This means that the economy will show growth in the fourth quarter, unless there is a contraction of more than 1% in December.
The numbers show that the economy has been better adapted to the second round of quarantine than in the first half of 2020. However, this month, the economy is expected to be drastically hit, when many stores will be closed. The annual volume of GDP contraction still remains huge. According to preliminary estimates, the losses amount to 8.5%.
Given this background, the stock market is gradually declining. Treasury yield is stable at 1.10%.
Main market quotes:
S&P 500 (F) 3,776.88 -14.37 (-0.38%)
Dow Jones 30,991.52 -68.95 (-0.22%)
DAX 13,910.30 -78.40 (-0.56%)
FTSE 100 6,751.29 -50.67 (-0.74%)
Индекс USD 90,343 +0,128 (+0,14%)
Important events:
– 10:00 (GMT+2) UK GDP (m/m);
– 10:00 (GMT+2) UK Manufacturing Output (MoM) (Nov);
This article reflects a personal opinion and should not be interpreted as an investment advice, and/or offer, and/or a persistent request for carrying out financial transactions, and/or a guarantee, and/or a forecast of future events.

US stocks have opened modestly higher as markets await President-elect Biden’s all singing and all dancing stimulus plans. Will it be trillions or just hundreds of billions as Goldman Sachs forecast ($900 billion to be precise!)? Whatever the size, the US economy has reminded us that it is still in bad shape and desperately needs a big fiscal boost.
The weekly initial jobless claims figures came in much worse than expected, jumping to a new high since August of 965k last week, 176k worse than expected, while continuing claims came in some 271k above expectations. The stalling jobs market is turning into something worse, as let’s not forget the worst claims number during the GFC in 2008 was a ‘mere’ 665k! The monthly NFP is looking very bleak at this stage with the upheaval in Washington certainly not helping speed up the vaccination program.
It seems markets are presuming that the bad numbers will only mean more stimulus is poured into the economy, which is helping the Dollar turnaround from its lows set earlier in the day. At the moment, the downside for USD is backstopped by rising domestic yields and it will be interesting to see if Chair Powell addresses this in his webinar later today. Messaging from other Fed policymakers this week has downplayed the recent rise in yields and the head honcho is expected to stick to the same script. The economy remains far form the Fed’s goals and with the virus still raging, Powell is likely to say the Fed can provide more accommodation if warranted – more succour to equity bulls for sure!
EUR unloved this year
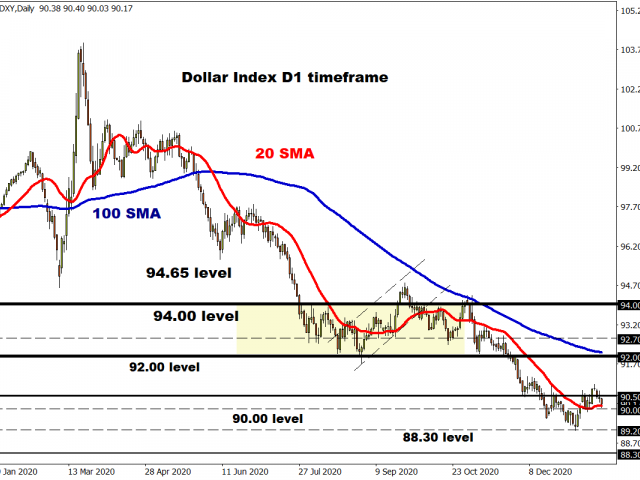
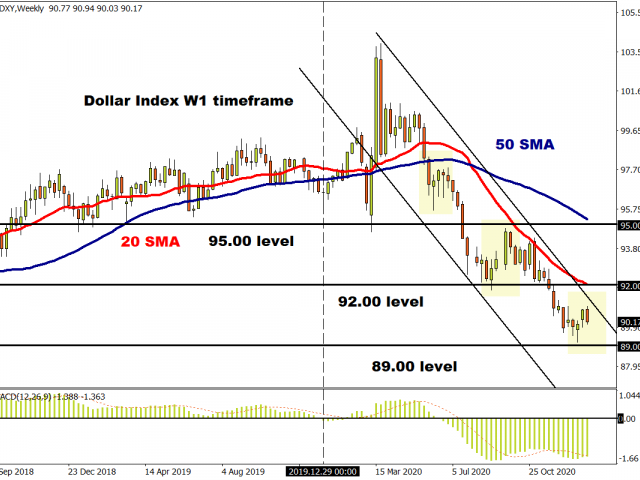
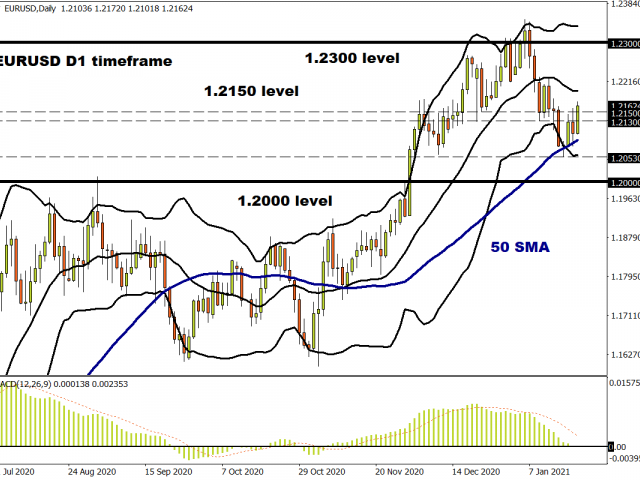
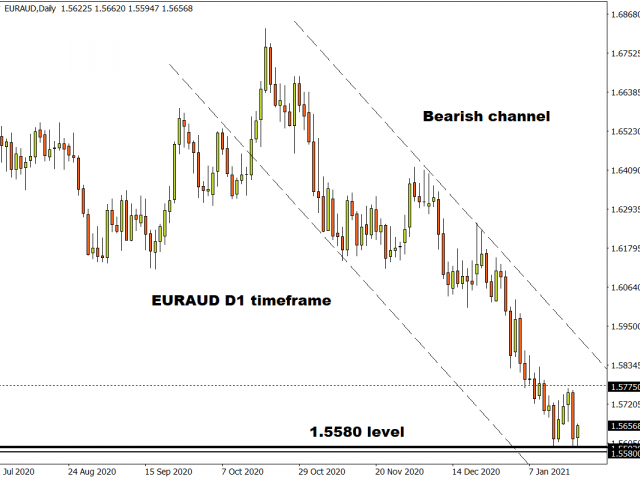
The single currency has underperformed recently amongst G10 currencies as the Dollar has staged its relief rally. In fact, it has been the second worst performing major since 6 January when the Dollar index put in place its low of 89.21 and has seen the biggest pullback in percentage terms (-1.7%) since late October/early November. EUR/USD has broken support from recent lows between 1.2130 and 1.2150, and now has eyes on 1.2058 from 9 December if we close lower on the day.
Rising political uncertainty in Italy is grabbing headlines but is probably not that impactful for markets. Virus worries and prolonged lockdowns have seen a trimming of large bullish positions in EUR futures while it was confirmed today that Germany signed off last year with zero growth and a 5% contraction for the year.
A beneficiary of the feeble Euro has been GBP which is homing in on major support around the June, September and November lows in the 0.8860 zone. There is very little support if traders drive this pair further south until the 0.8670 April lows.
Sterling is the leading major on the week so far with the wind in its sails after the BoE reigned in any NIRP chit-chat. With Brexit headlines for now a distant memory and the vaccinations ramp-up ‘world beating’ on many scales, GBP should enjoy its day in the sun (well, grey clouds from this vantage point!)
Disclaimer: The content in this article comprises personal opinions and should not be construed as containing personal and/or other investment advice and/or an offer of and/or solicitation for any transactions in financial instruments and/or a guarantee and/or prediction of future performance. ForexTime (FXTM), its affiliates, agents, directors, officers or employees do not guarantee the accuracy, validity, timeliness or completeness, of any information or data made available and assume no liability as to any loss arising from any investment based on the same.
As we can see in the daily chart, the long-term rising tendency continues; the pair has already broken 38.2% fibo and right now it trying to fix above it to continue growing towards 50.0% fibo at 0.8292. However, at the same time, there is a divergence on MACD, which may indicate a possible pullback soon. The support is at 23.6% fibo (0.6820).
The H4 chart a new descending pullback after a local divergence on MACD. The first correctional wave may be heading towards 23.6% fibo at 0.7624 and then 38.2%, 50.0%, and 61.8% fibo at 0.7504, 0.7405, and 0.7397 respectively. However, if the asset completes the pullback and breaks the high at 0.7820, AUDUSD may continue growing to enter the post-correctional extension area between 138.2% and 161.8% fibo at 0.7880 and 0.7917 respectively.
USDCAD, “US Dollar vs Canadian Dollar”
As we can see in the daily chart, USDCAD continues trading downwards and has already reached 76.0% fibo. In this case, the next downside target may be close to the fractal low at 1.2061. At the same time, there is a convergence on MACD, which may hint at a new pullback towards the resistance at 61.8% fibo (1.3057).
In the H4 chart, a convergence on MACD made the pair complete its local correction at 23.6% fibo and start a new descending wave continue the downtrend towards the post-correctional extension area between 138.2% and 161.8% fibo at 1.2552 and 1.2503 respectively after breaking the low at 1.2630. At the same time, one shouldn’t exclude a rebound from the low and a breakout of the resistance at 1.2835. In this case, the price may continue the correction to reach 38.2% and 50.0% fibo at 1.2921 and 1.3010 respectively.
Attention! Forecasts presented in this section only reflect the author’s private opinion and should not be considered as guidance for trading. RoboForex LP bears no responsibility for trading results based on trading recommendations described in these analytical reviews.
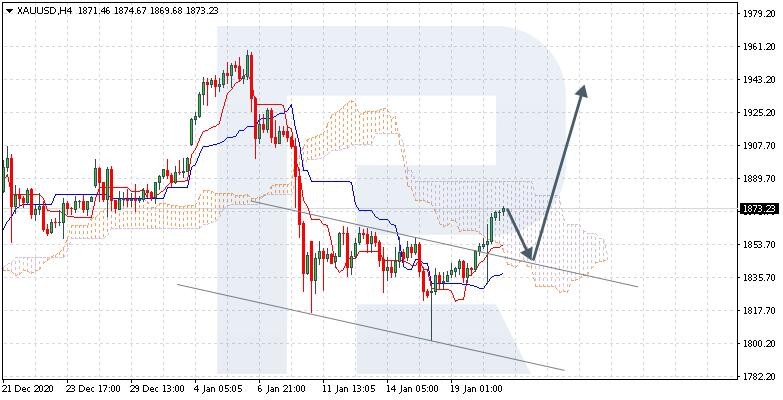
XAUUSD is trading at 1842.00; the instrument is moving inside Ichimoku Cloud, thus indicating a sideways ascending tendency. The markets could indicate that the price may test the cloud’s upside border at 1850.00 and then resume moving downwards to reach 1795.00. Another signal in favor of further downtrend will be a rebound from the resistance level. However, the bearish scenario may no longer be valid if the price breaks the cloud’s upside border and fixes above 1870.00. In this case, the pair may continue growing towards 1910.00. To confirm further decline, the asset must break the rising channel’s downside border and fix below 1825.00.
EURGBP, “Euro vs Great Britain Pound”
EURGBP is trading at 0.8910; the instrument is moving below Ichimoku Cloud, thus indicating a descending tendency. The markets could indicate that the price may test the cloud’s downside border at 0.8925 and then resume moving downwards to reach 0.8835. Another signal in favor of further downtrend will be a rebound from the descending channel’s upside border. However, the bearish scenario may be canceled if the price breaks the cloud’s upside border and fixes above 0.9005. In this case, the pair may continue growing towards 0.9095.
USDJPY, “US Dollar vs Japanese Yen”
USDJPY is trading at 104.01; the instrument is moving above Ichimoku Cloud, thus indicating an ascending tendency. The markets could indicate that the price may test Tenkan-Sen and Kijun-Sen at 103.90 and then resume moving upwards to reach 104.85. Another signal in favor of further uptrend will be a rebound from the rising channel’s downside border. However, the bullish scenario may no longer be valid if the price breaks the cloud’s downside border and fixes above 103.05. In this case, the pair may continue falling towards 102.15.
Attention! Forecasts presented in this section only reflect the author’s private opinion and should not be considered as guidance for trading. RoboForex LP bears no responsibility for trading results based on trading recommendations described in these analytical reviews.
– The Brexit deal has failed to have any major effect on the exchange rate of the pound since January 1. The pound has held steady against the US dollar at US$1.36 and has strengthened slightly against the euro to €1.12. This was very much consistent with the modest expectations of the markets. But what about the longer term?
According to the research centre UK in a Changing Europe, the effect of Brexit on the economy is expected to emerge slowly, but to be permanent. The centre estimates that UK’s economy will shrink by a total 4.9% over 15 years.
This is likely to add extra pressure on the pound, which has generally been weakening in recent years. The question is how quickly the effects of Brexit are likely to feed through.
At the same time, Brexit has played a role in undermining international investors’ belief in the UK as a beacon of stability and trustworthiness and hence in a prosperous future for the British economy. This too is likely to affect the currency over time.
The Brexit effect
Sterling was already in an obvious downward trend against both the dollar and euro over the past couple of decades, as you can see from the chart below. Since the global financial crisis of 2008-09, this trend has accelerated because of the UK economy’s relatively slower productivity growth, despite the fact that it was running a very loose monetary policy. Incidentally, the pound has been falling faster against the euro than the dollar.
Sterling/USD and sterling/euro rates Jan 2000-Dec 2020
So where does Brexit fit in? Although the Brexit trade deal guarantees that goods such as food, clothes, white goods and machines will continue to trade without tariffs, there are caveats that are likely to undermine trade between the EU and UK – with potential consequences for the currency.
To qualify for zero tariffs, goods need to satisfy the relevant rules of origin, which relate to where the items came from. For example, a car assembled in the UK will qualify to be sold free of tariffs to the EU as long as 60% or more of its value was produced either in the UK or the EU.
The tweet, from Peter Foster, the public policy editor at the Financial Times, explains this concept, adding that companies are now realising what “rules of origin does to supply chains”.
In addition to the rules of origin, trade in goods covered by the deal is only tariff free as long as there is no significant divergence in terms of rules and regulations (the famous level playing field clause). This means that neither side is allowed to lower their standards if they want free trade to continue. If this led to divergence in UK standards over time, this could reduce the number of products that could be freely traded. However, it seems more likely that the UK will avoid diverging from EU standards and that as a result, more tariffs will not be added here.
Overall, however, all trade models predict that international trade in goods between the UK and EU will be reduced, given that Brexit creates new obstacles for the two trading partners and this is costly. As a consequence, some import prices will increase and some export jobs will be lost.
Less trade with the EU, the biggest single market for the UK, will imply reduced demand for its currency and hence a lower value for the pound. This could also mean that UK firms face less competition domestically from EU exporters, which could cause productivity in Britain to further flatten. Reduced productivity for the UK could also cause sterling to drop in value as devaluation is then the only alternative to maintain international competitiveness.
Services are even more important from the UK’s perspective. Led by areas like finance and law, they make up a significant part of UK GDP, and the EU is again the biggest single export market.
The Brexit deal does not include trade in services. The UK and EU are still aiming to negotiate an agreement that will involve them. But with Paris and Frankfurt seeking a share of the UK’s financial services business, a reduction in EU-UK services trade seems unavoidable.
Maintaining the same level of activity in the UK therefore looks uncertain in the short term, and not without its problems in the long term – depending on whether there is an agreement on services in the next year or so. Because services is the biggest part of the UK economy, a failure to reach such an agreement could reduce demand for sterling in European markets more than anything else.
In sum, the Brexit deal is likely to mean that sterling will continue its downwards trend against the dollar and euro. This will affect everything from the price that people pay in British supermarkets to the cost of holidaying abroad. It will not come as a surprise if the euro equals a pound sterling over the next two years and the dollar rate strengthens to US$1.20 to the pound.
The dollar index closed 0.38% higher on Wednesday, breaking through the 90 ceiling once again.
Early reports suggest that the size of the US President-elect Joe Biden’s stimulus plan has ballooned to $2trillion.
Increased fiscal and monetary spending typically weighs over the domestic currency. However, the dollar is cheering the latest news, possibly due to optimism in treasury yields.
This comes as Trump looks likely to be removed from office, becoming the first President in history to be impeached twice.
Industrial Production Jumps to Pre-Crisis Levels
The euro ended 0.40% lower yesterday despite industrial production rising for the seventh straight month.
The major burdening debt weighed on the pair. And the political crisis in Italy where the former Prime Minister confirmed he is pulling his party’s ministers from the ruling coalition, dragged the currency pair away from the 1.23 target.
Consequences of Brexit Start to Manifest
Sterling saw a slight pullback from its rally on Tuesday, closing 0.17% lower.
EU’s Brexit negotiator Michel Barnier has warned that many of the new regulatory frictions hampering cross-channel trade will be impossible to smooth over.
New paperwork and more red tape will hamper importers and exporters for some time, as industries are still coming to terms with changes to their trading conditions.
Indices Propel
The equity market continued its mild rally yesterday, but talks of a correction loom.
Indices posted back-to-back sessions of gains, as impeachment proceedings are in full swing.
Joe Biden will be wondering if he needs any further political distractions, as his entire cabinet needs to be confirmed as his term in the White House moves closer.
Yellow Metal Mixed
Gold closed 0.55% down on Wednesday as it still comes to terms with last week’s sell-off.
Many analysts have cited dollar strength as a primary factor pressuring gold, as the greenback sought strength after an initial rise in US treasury yields.
Oil Pullback After Reaching for $54
WTI closed 0.88% lower yesterday after an initial rally that saw prices almost touch the $54 level.
Profit-taking seemed to ensue from 11-month highs after a larger than expected drop in EIA crude oil inventories.
Global oil demand is expected to grow compared to last year according to the EIA. This could help propel prices further in the near term.
The dollar index fell 0.54% lower yesterday as it once again touched the 90 level.
The recent rally paused as the dollar shed some ground for the first time after four consecutive daily gains.
Investors looked past the potential impeachment of President Trump, focusing instead on the likely increase of fiscal stimulus under a Biden administration and the impact on inflation expectations.
This comes after the third most senior Republican, Liz Cheney, said she would vote to impeach Donald Trump over last week’s Capitol riot.
The House plans to vote today to charge Mr. Trump with inciting insurrection, which would make him the first US president ever to be impeached twice.
Euro Breaks Back
The euro managed to climb 0.45% higher on Tuesday, pushing back through the 1.22 ceiling.
Investors dumped their dollars yesterday, leading to a slight rally on the EURUSD pair.
This comes despite analysts predicting a sharp contraction in the first quarter of the year, with further Covid-19 restrictions taking their toll.
Double-dip recessions could be a common thing going into the start of the new year, as we await today’s industrial production numbers to lift spirits.
Sterling Pushes for 2-Year Highs
The pound had a day to remember yesterday, jumping over 1% as it reached for the 1.37 handle.
With the Bank of England ruling out negative interest rates, the governor said that quantitative easing would continue this year, with a further £150bn of asset purchases in the pipeline.
Mixed Day for Indices
The three major US indices all traded towards breakeven status on Tuesday.
This comes as several major tech giants continued to slide after sharp declines at the start of the trading week.
Twitter and Facebook continue to feel the brunt of the sell-off, as both stocks fell by over 2%.
Tesla shares rallied once again, as the stock remains near all-time highs.
Gold Begins Recovery
Gold closed 0.58% higher on Tuesday as the upturn begins after last week’s collapse.
The greenback’s decline is keeping bulls hopeful, amid expectations of a multitrillion-dollar stimulus likely to be announced by President-elect Joe Biden soon.
Added to the pandemic numbers and the civil unrest, could we see the yellow metal make a full retracement?
Oil at 11-Month High
WTI jumped over 2% yesterday, eclipsing the $53 handle.
Strong API figures showed a large crude draw which led the black gold higher. The rally now looks towards EIA figures released later today, as a further move would cement a push towards $60.
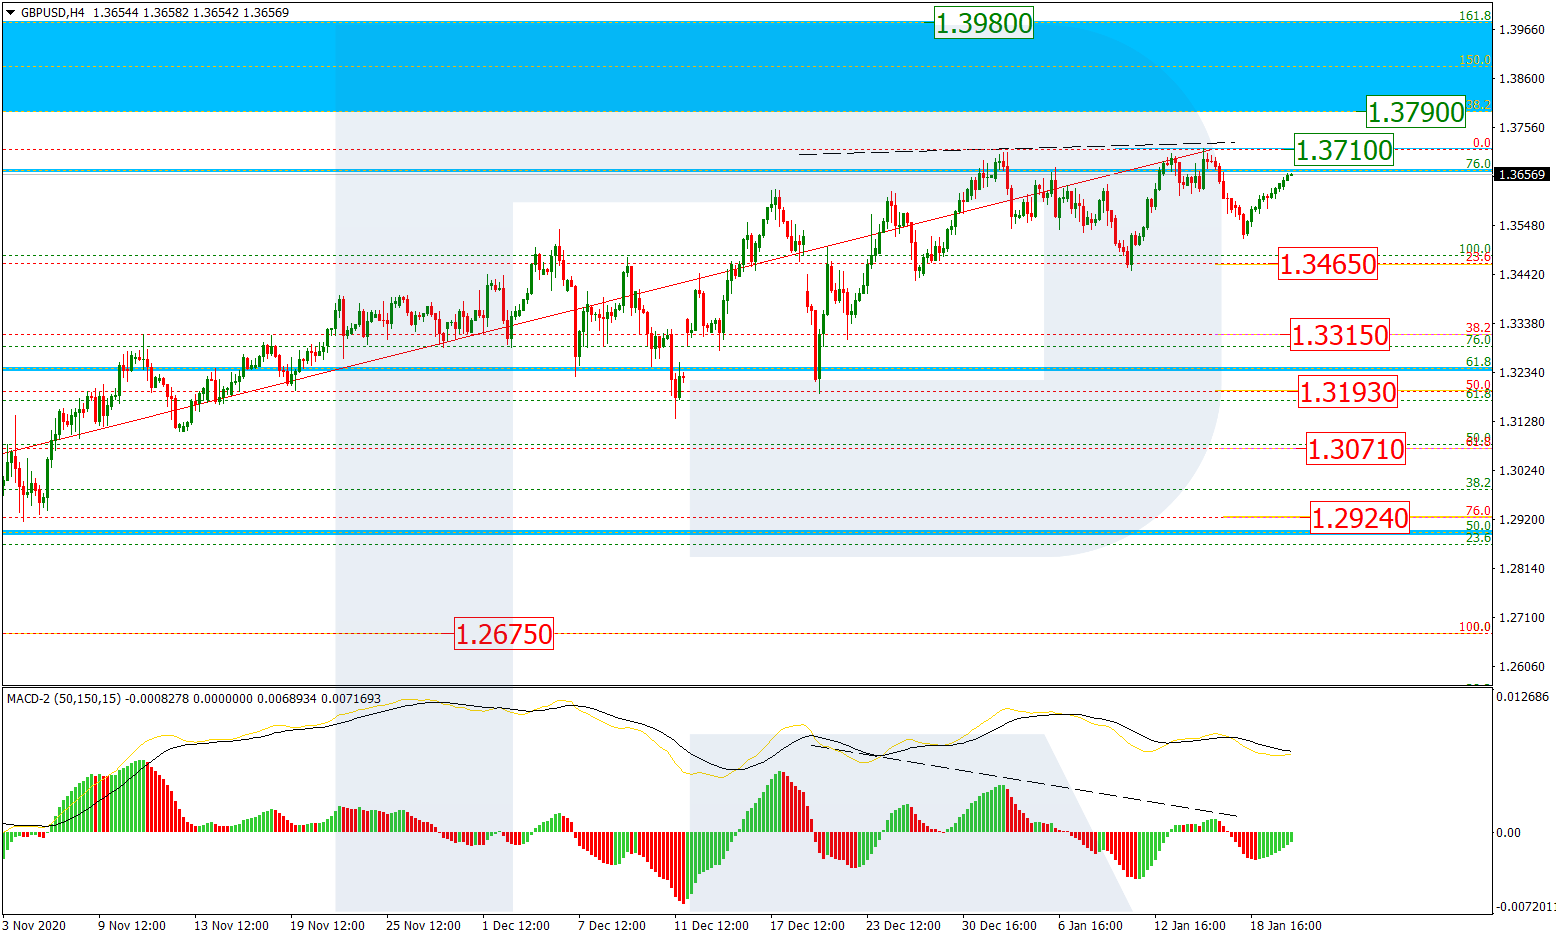
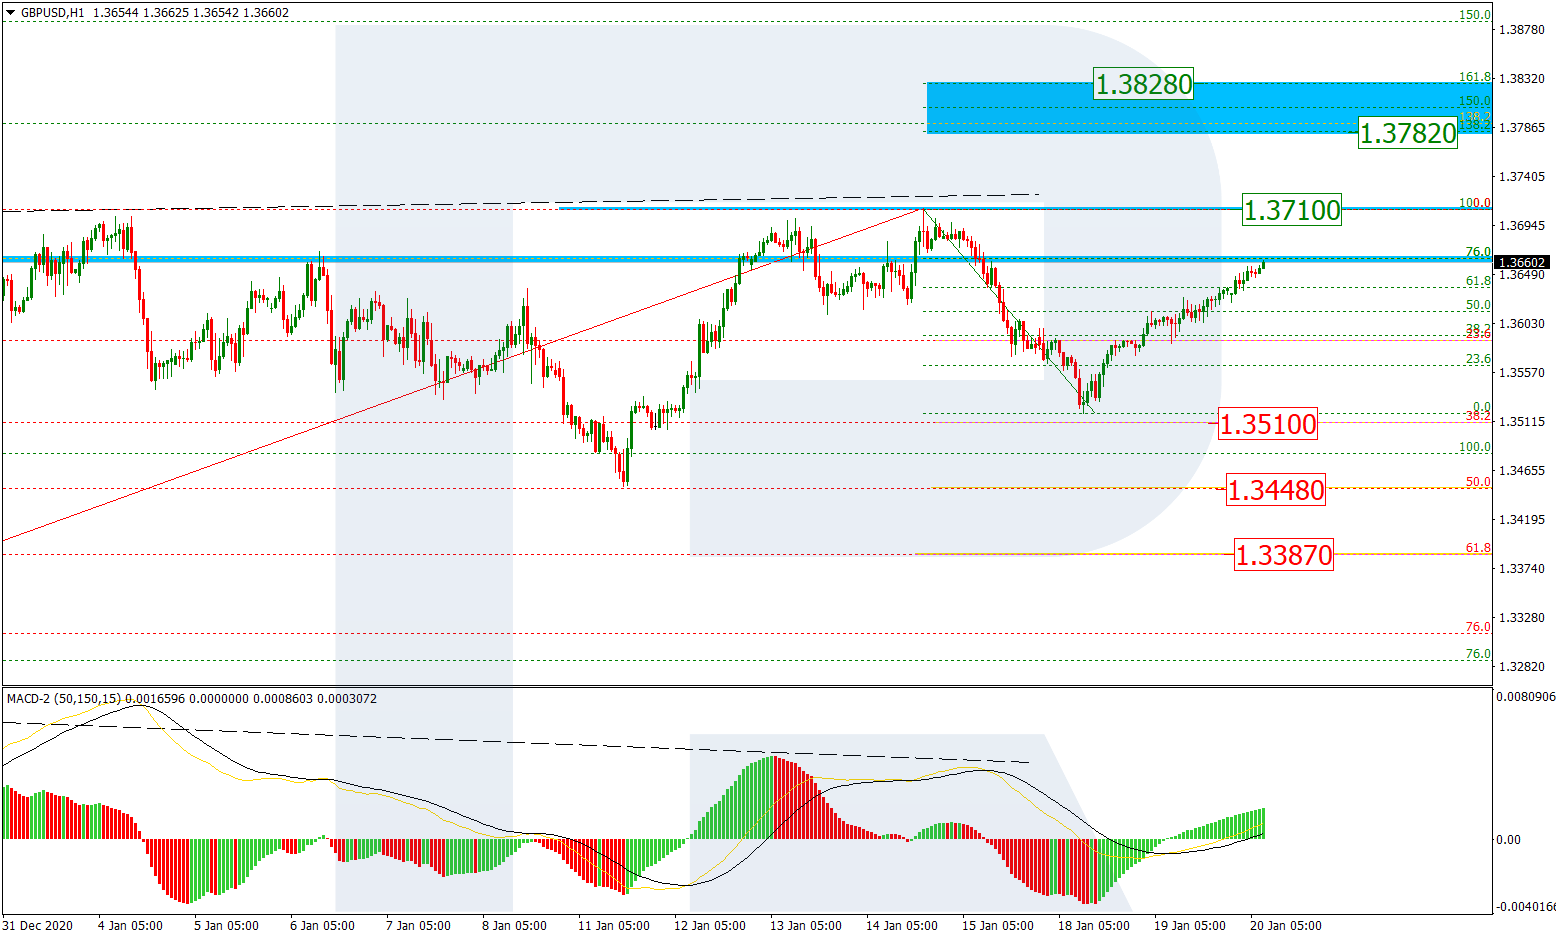
As we can see in the H4 chart, after finishing the correction at 23.6% fibo, GBPUSD is forming another rising wave. If the price breaks the high at 1.3740, it may continue growing to reach the post-correctional extension area between 138.2% and 161.8% fibo at 1.3790 and 1.3980 respectively. However, an alternative scenario says that the pair may rebound from the high and start a new descending structure towards 38.2%, 50.0%, 61.8%, and 76.0% fibo at 1.3310, 1.3189, 1.3067, and 1.2922 respectively.
In the H1 chart, the price is approaching the high for a test and a possible rebound. In the nearest future, the pair may start a local pullback, which may later be followed by a new growth towards the post-correctional extension area between 138.2% and 161.8% fibo at 1.3789 and 1.3860 respectively. However, a breakout of the local low at 1.3446 will lead to another mid-tern correctional wave.
EURJPY, “Euro vs. Japanese Yen”
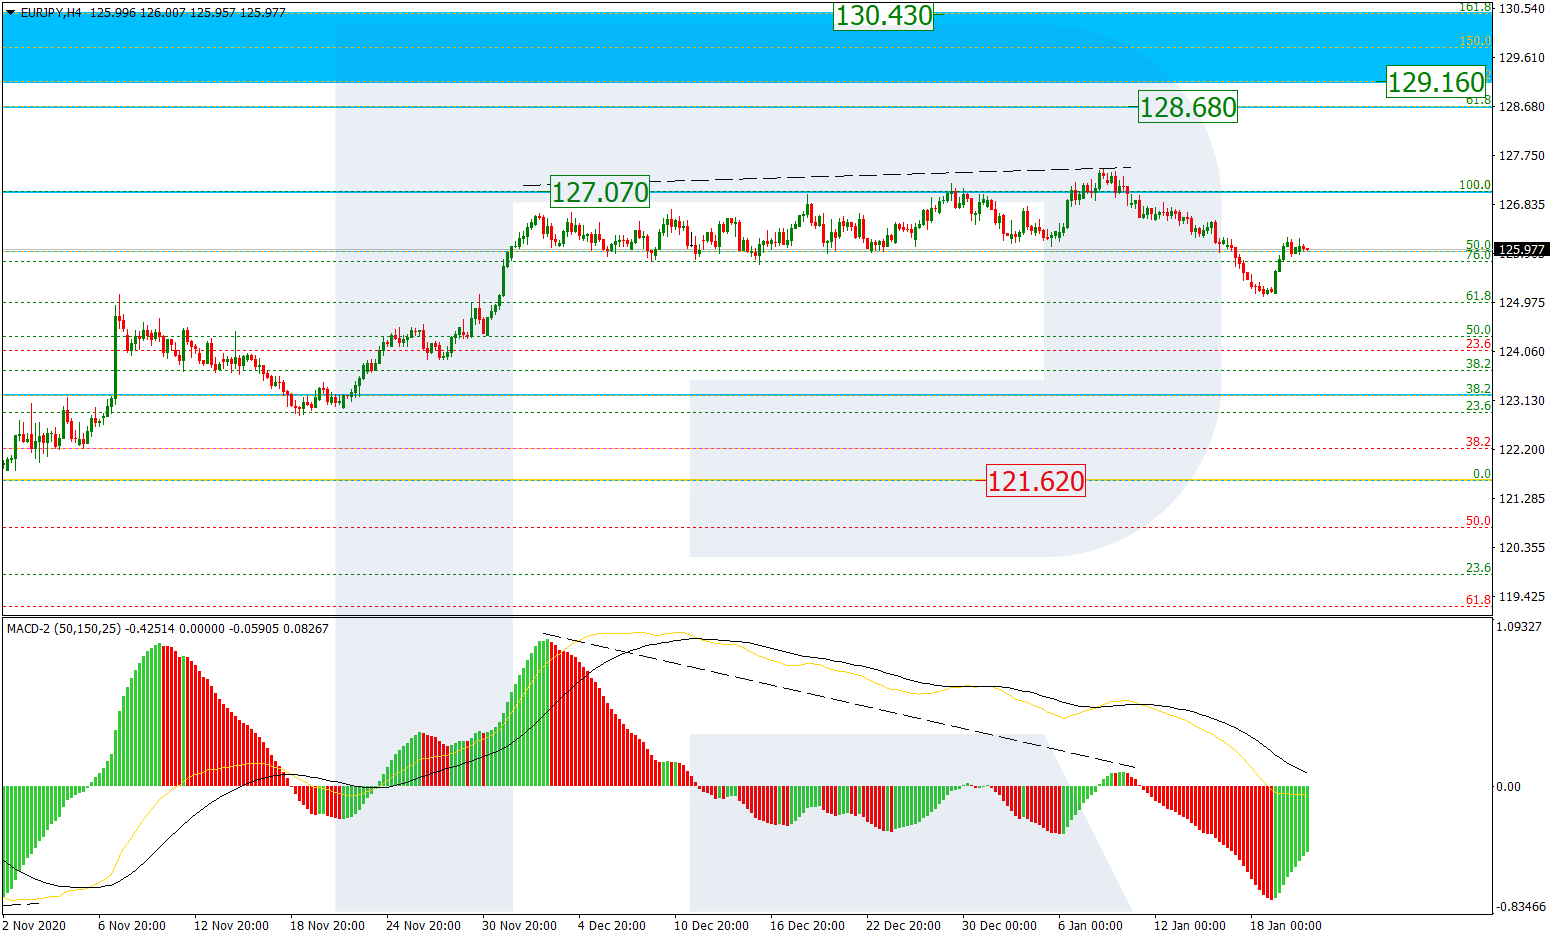
As we can see in the H4 chart, EURJPY is falling again after another divergence on MACD. Possibly, the pair may complete the correction and resume growing to break the mid-term 61.8% fibo at 128.65 and then continue moving to reach the post-correctional extension area between 138.2% and 161.8% fibo at 129.16 and 130.43 respectively. The key support is the fractal low at 121.62.
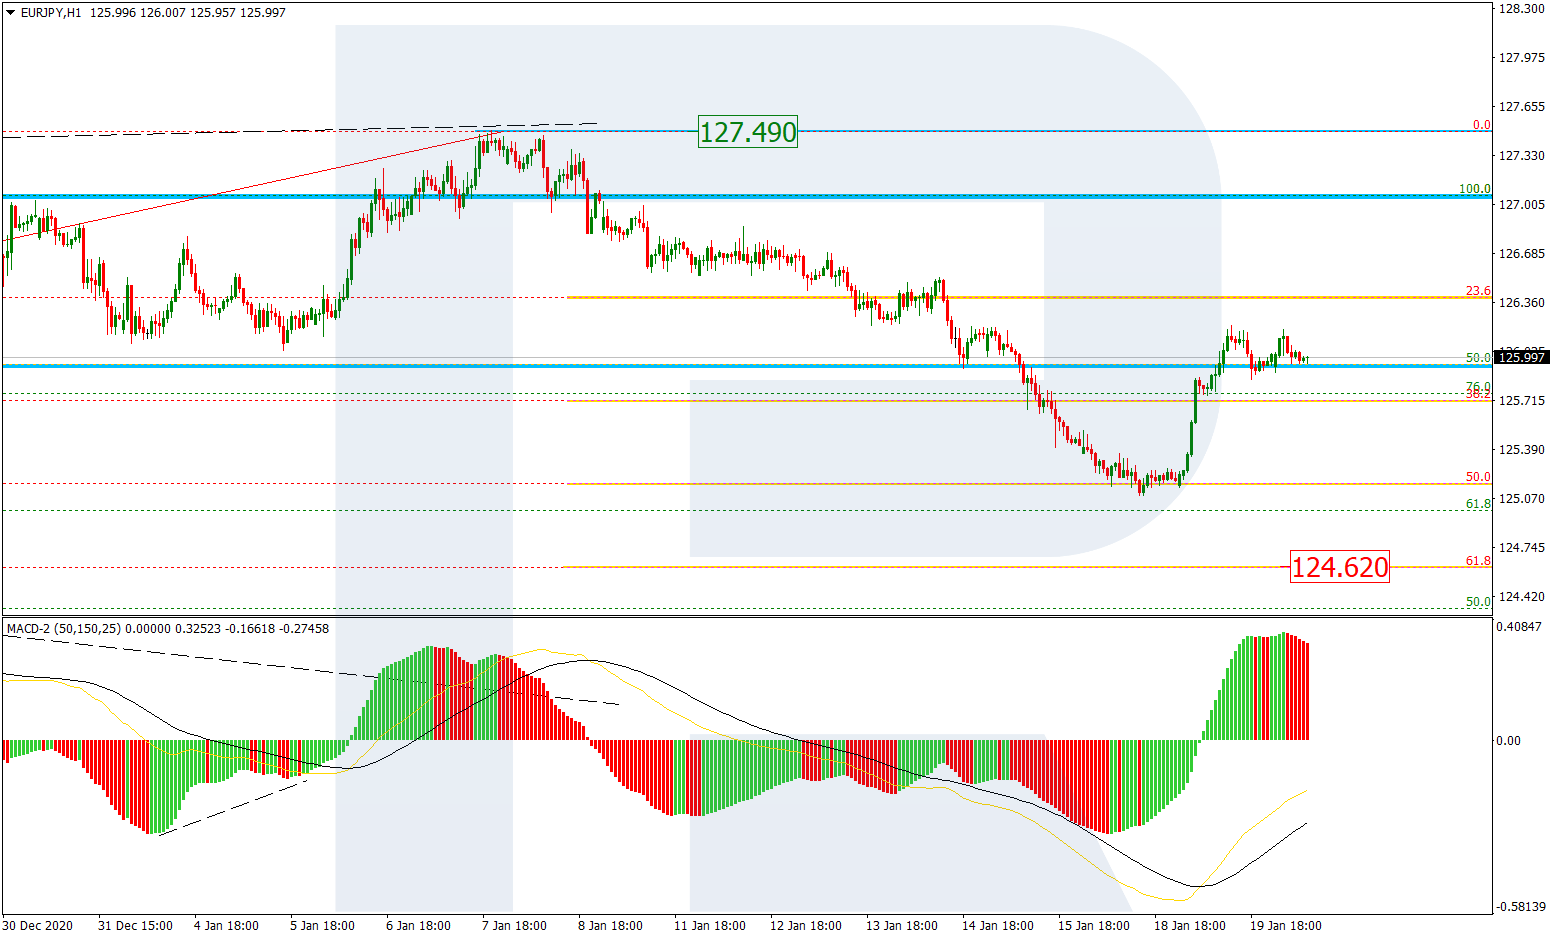
The H1 chart shows that the price is falling towards 23.6% fibo at 126.39. The next downside target may be 38.2% fibo at 125.71. A breakout of the local high at 127.49 will hint at further uptrend.
Attention! Forecasts presented in this section only reflect the author’s private opinion and should not be considered as guidance for trading. RoboForex LP bears no responsibility for trading results based on trading recommendations described in these analytical reviews.
In the H4 chart, after rebounding from 3/8, USDJPY is expected to break 1/8 and then continue falling towards the support at 0/8. However, this scenario may no longer be valid if the price breaks 2/8 to the upside. After that, the instrument may continue growing to reach the resistance at 3/8.
As we can see in the M15 chart, the pair has broken the downside line of the VoltyChannel indicator and, as a result, may continue moving downwards.
USDCAD, “US Dollar vs Canadian Dollar”
In the H4 chart, USDCAD is moving below the 200-day Moving Average, thus indicating a descending tendency. In this case, the pair is expected to break 0/8 and then continue falling towards the support at -1/8. Still, this scenario may no longer be valid if the price breaks 1/8 to the upside. After that, the instrument may reverse and correct to reach the resistance at 2/8.
As we can see in the M15 chart, the pair has broken the downside line of the VoltyChannel indicator and, as a result, may continue trading downwards to reach -1/8 from the H4 chart.
Attention! Forecasts presented in this section only reflect the author’s private opinion and should not be considered as guidance for trading. RoboForex LP bears no responsibility for trading results based on trading recommendations described in these analytical reviews.