Archive for Forex and Currency News – Page 321

Fibonacci Retracements Analysis 25.01.2021 (GOLD, USDCHF)

Article By RoboForex.com

XAUUSD, “Gold vs US Dollar”

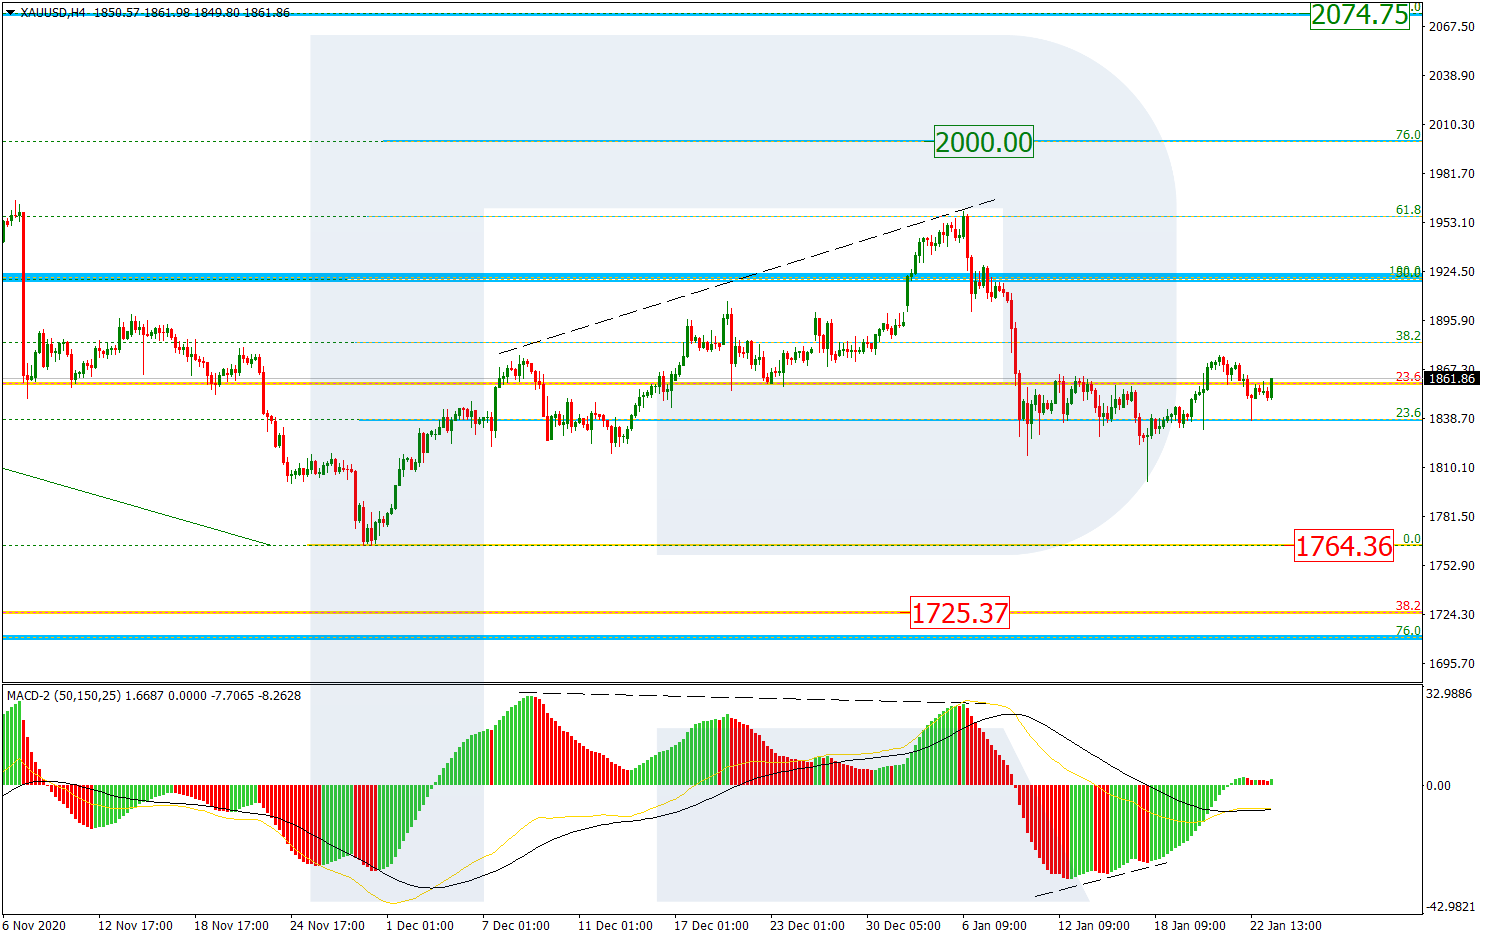
In the H4 chart, a local convergence on MACD made the pair start a new correction to the upside, which may successfully transform into a mid-term rising wave towards 78.0% fibo at 2000.00 and then the high at 2074.75. Another scenario implies that the asset may complete this correction without updating the local high and then start another descending impulse to reach the low at 1764.36, a breakout of which will lead to a further long-term downtrend towards 38.2% at 1725.37.

GOLD_H4
Risk Warning: the result of previous trading operations do not guarantee the same results in the future

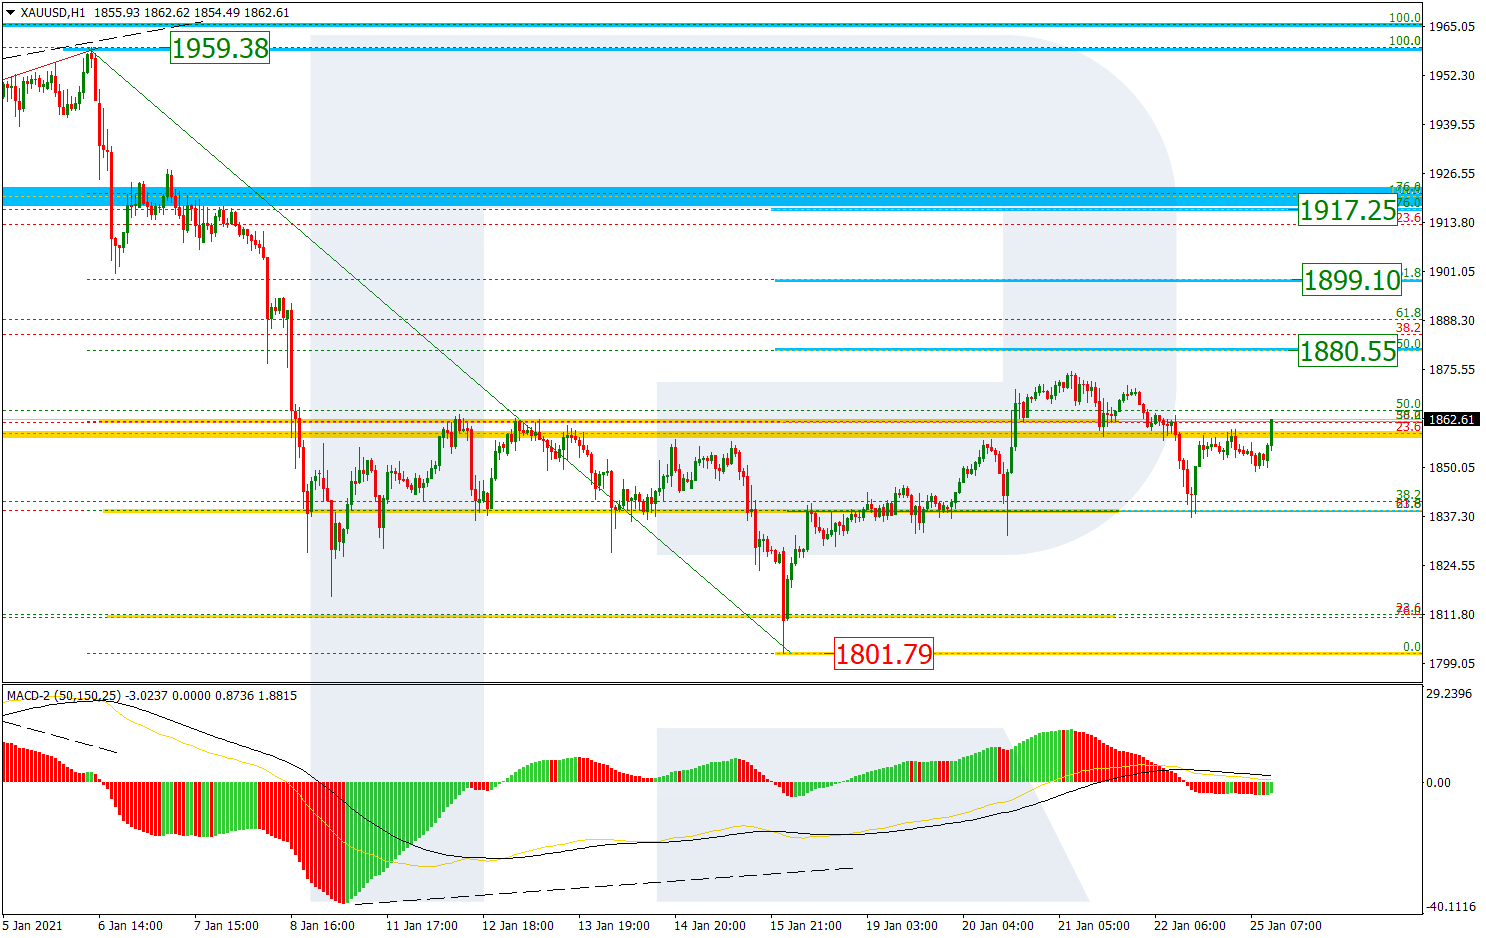
The H1 chart shows a more detailed structure of the correctional uptrend, which has already reached 38.2% fibo. After a short-term pullback, the asset may continue growing towards 50.0% and 61.8% fibo at 1880.55 and 1899.10 respectively, while a breakout of 76.0% fibo at 1917.25 may result in a further uptrend to reach the high at 1958.38. On the other hand, if the instrument breaks the local low at 1801.79, the pair may continue falling towards the key one at 1764.36.

GOLD_H1
Risk Warning: the result of previous trading operations do not guarantee the same results in the future

USDCHF, “US Dollar vs Swiss Franc”

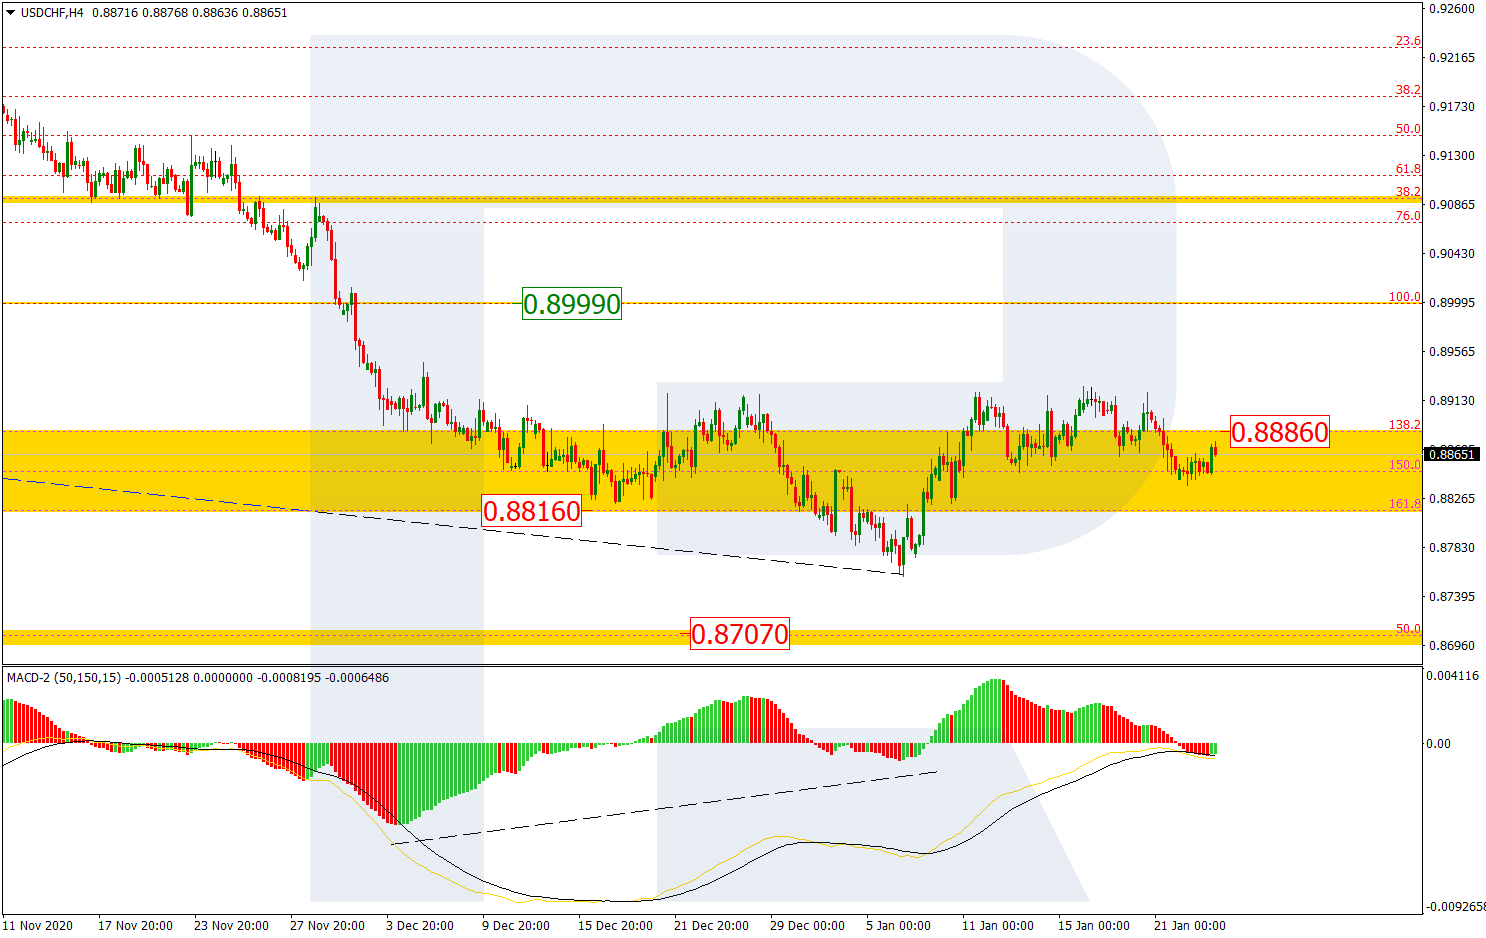
As we can see in the H4 chart, after a convergence on MACD, USDCHF has tested the upside border of the post-correctional extension area between 138.2% and 161.8% fibo at 0.8886 and 0.8816 respectively; right now, it is moving within the range again. Later, the pair is expected to form another rising impulse to break the border and fix above it. The key upside target is the resistance at 0.8999.

USDCHF_H4
Risk Warning: the result of previous trading operations do not guarantee the same results in the future

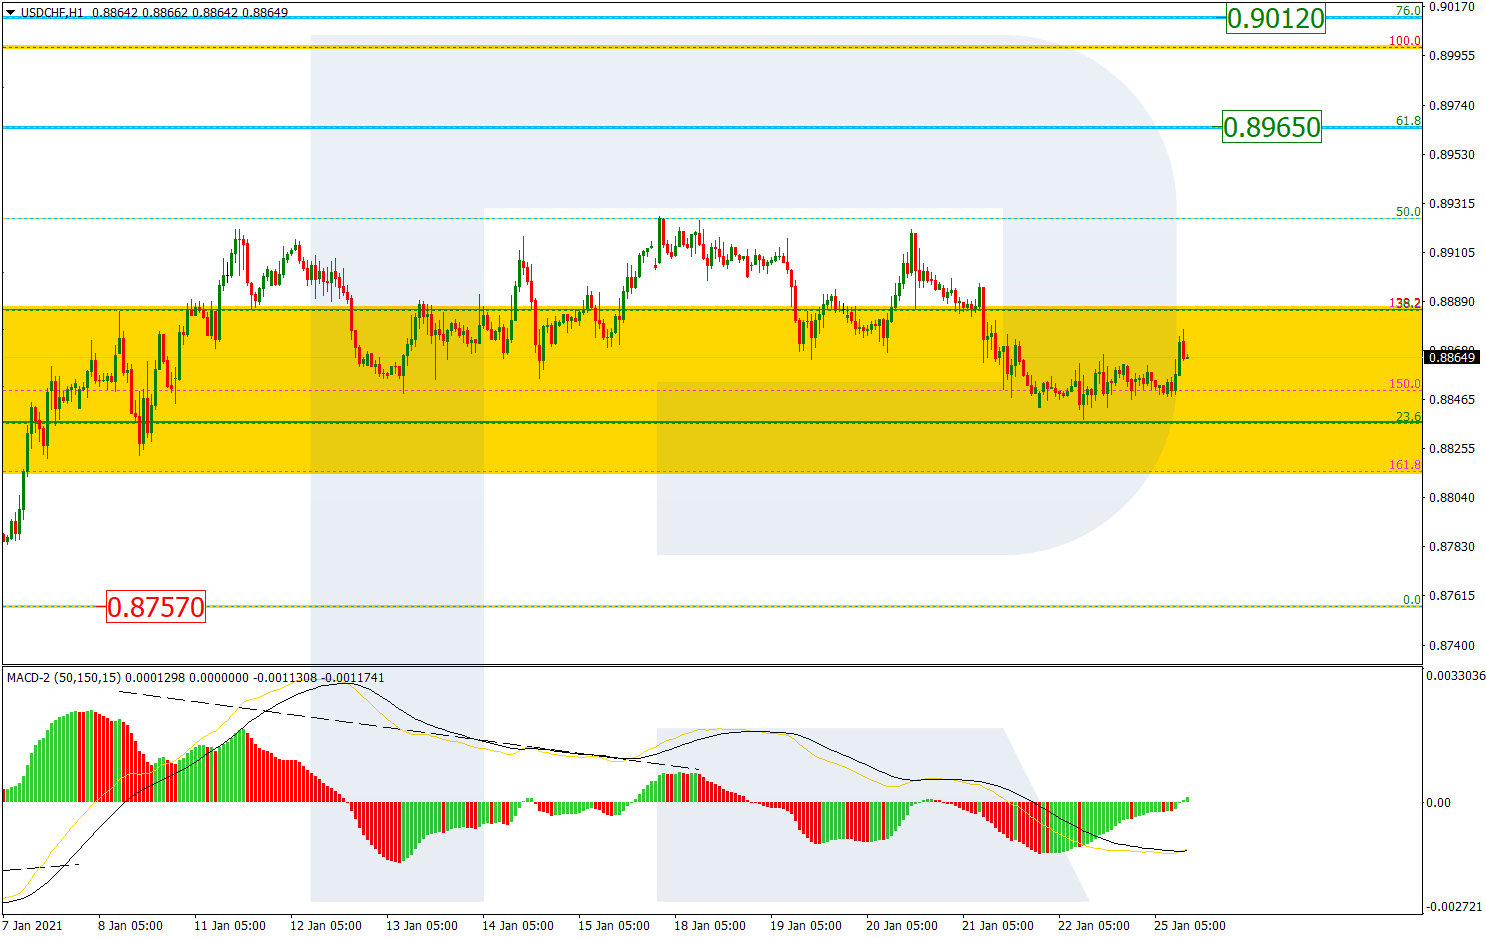
The H1 chart shows a more detailed structure of the correctional trend. After reaching 50.0% fibo and rebounding from it, the asset has returned to the support area close to 23.6% fibo. In the nearest future, USDCHF is expected to complete the correction and then resume moving towards 61.8% and 76.0% fibo at 0.8965 and 0.9012 respectively. The support is the low at 0.8757.

USDCHF_H1

Article By RoboForex.com

Attention!
Forecasts presented in this section only reflect the author’s private opinion and should not be considered as guidance for trading. RoboForex LP bears no responsibility for trading results based on trading recommendations described in these analytical reviews.

Ichimoku Cloud Analysis 25.01.2021 (EURJPY, BTCUSD, NZDUSD)

Article By RoboForex.com

EURJPY, “Euro vs Japanese Yen”

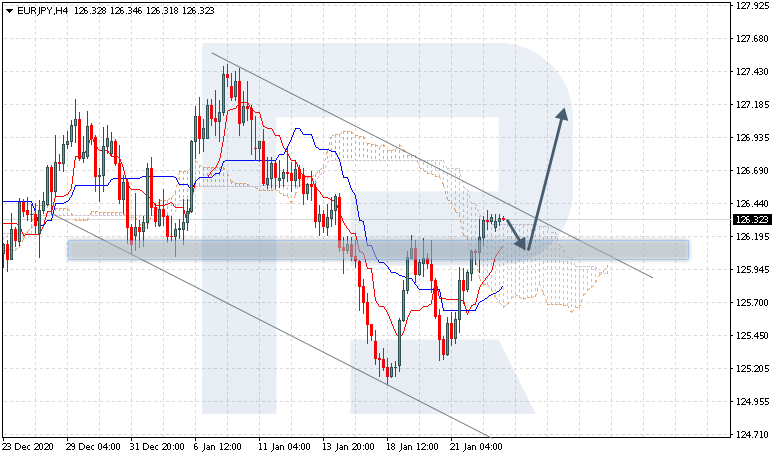
EURJPY is trading at 126.32; the instrument is moving above Ichimoku Cloud, thus indicating an ascending tendency. The markets could indicate that the price may test Tenkan-Sen and Kijun-Sen at 126.05 and then resume moving upwards to reach 127.20. Another signal in favor of a further uptrend will be a rebound from the support level. However, the bullish scenario may no longer be valid if the price breaks the cloud’s downside border and fixes below 125.45. In this case, the pair may continue falling towards 124.55. To confirm further growth, the asset must break the descending channel’s upside border and fix above 126.55.

EURJPY
Risk Warning: the result of previous trading operations do not guarantee the same results in the future

BTCUSD, “Bitcoin vs US Dollar”

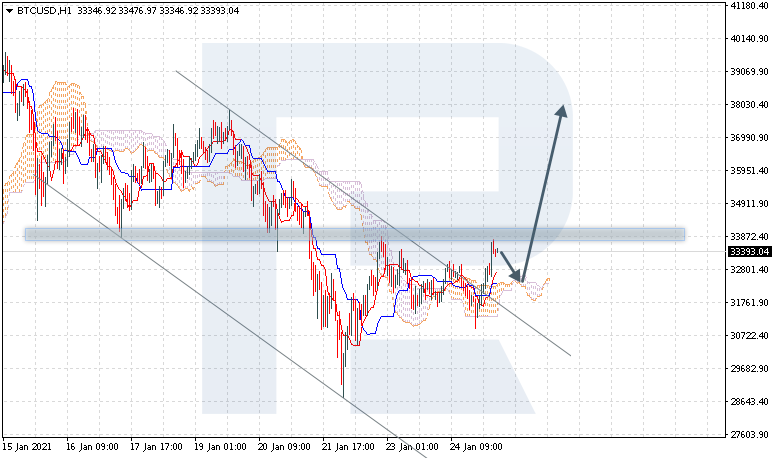
BTCUSD is trading at 33393.00; the instrument is moving above Ichimoku Cloud, thus indicating an ascending tendency. The markets could indicate that the price may test the cloud’s upside border at 32625.00 and then resume moving upwards to reach 38030.00. Another signal in favor of a further uptrend will be a rebound from the descending channel’s upside border. However, the bullish scenario may no longer be valid if the price breaks the cloud’s downside border and fixes below 30705.00. In this case, the pair may continue falling towards 28645.00. To confirm further growth, the asset must break the resistance area and fix above 34005.00.

BTCUSD
Risk Warning: the result of previous trading operations do not guarantee the same results in the future

NZDUSD, “New Zealand Dollar vs US Dollar”

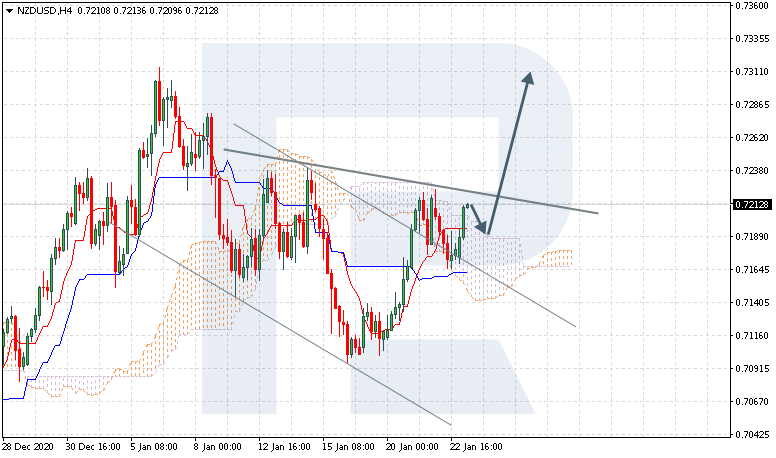
NZDUSD is trading at 0.7212; the instrument is moving above Ichimoku Cloud, thus indicating an ascending tendency. The markets could indicate that the price may test the cloud’s upside border at 0.7195 and then resume moving upwards to reach 0.7315. Another signal in favor of a further uptrend will be a rebound from the descending channel’s upside border. However, the bullish scenario may be canceled if the price breaks the cloud’s downside border and fixes below 0.7125. In this case, the pair may continue falling towards 0.7035. To confirm further growth, the asset must break the resistance area and fix above 0.7245, thus indicating the completion of an Upside-Down Head & Shoulders reversal pattern.

NZDUSD

Article By RoboForex.com

Attention!
Forecasts presented in this section only reflect the author’s private opinion and should not be considered as guidance for trading. RoboForex LP bears no responsibility for trading results based on trading recommendations described in these analytical reviews.

The Week Ahead: Wait And See

By Orbex

USDCHF Sinks to 6-Year Lows

The US dollar’s rebound has mirrored the pause in the equity market. This probably has more to do with profit-taking than anything else.

Indeed, optimism is hard to fade when Janet Yellen, President-elect Joe Biden’s nominee for Treasury Secretary, called for “act big” on stimulus. This week’s Fed meeting might not be eventful but policymakers are expected to maintain the liquidity flow for at long as possible.

As the greenback is heading towards lows from 2015, trend-followers would be eager to sell into strength. 0.8500 is the next target while 0.9000, the support-turned-resistance may cap any upward pressure.

GBPNZD Bounces as UK Vaccine Campaign Speeds Up

With the Brexit theme out of the picture, the pound sterling has benefited from the bullish sentiment across the board, even outperforming riskier currencies like the kiwi in its latest rebound.

As the UK accelerates the rollout of the vaccine markets have started to price in the inflection point in restrictions in late spring. This would put the pound in an enviable position compared to its European and American counterparts.

Buyers have gained a foothold near last July’s low of 1.8600. The recent breakout above 1.9100 is a sign of sellers getting out of their positions, which may lead to a gradual recovery.

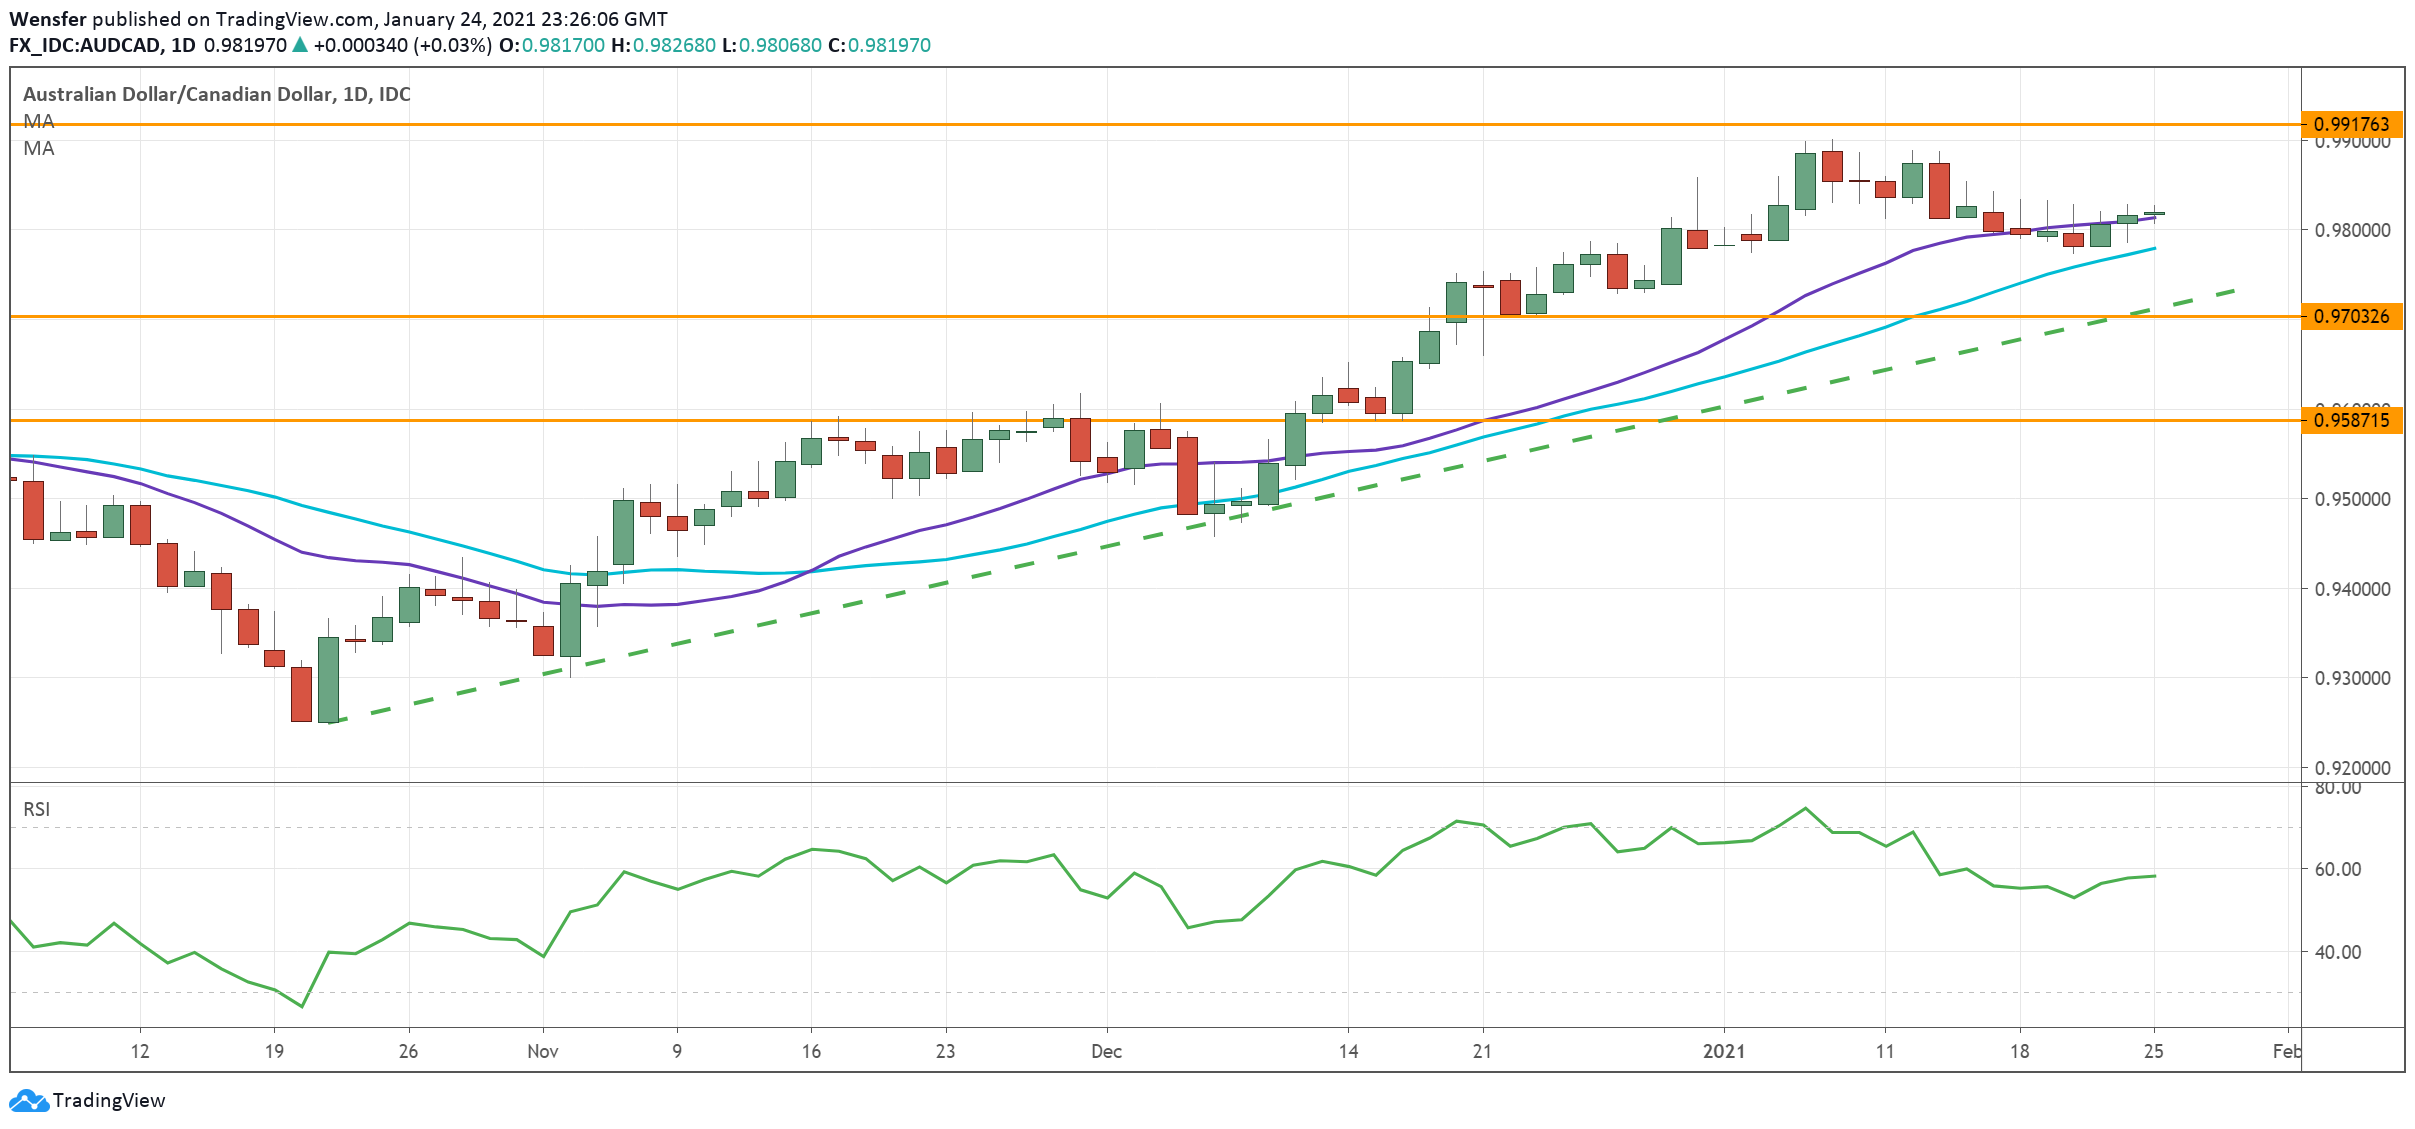
AUDCAD Rises on Brighter Domestic Data

As the dust settles down in Washington DC, the prospect of a larger stimulus is exactly what global markets need to sustain the exuberance.

Combined with an improvement in domestic employment data, the commodity-linked Australian dollar still has room to the upside. Should this week’s CPI read above the consensus of 1.5%, the Reserve Bank of Australia might consider cutting back on its easing program, another strong tailwind for the Aussie.

The pair is grinding up along the bullish trendline established last October. In case of a deeper pullback, 0.9700 is a key support level to keep the optimism intact.

EURJPY Awaits Breakout Catalyst

Last week both ECB and BoJ adopted a wait-and-see attitude and pledged to support their respective economy through the pandemic. This was another way to say business as usual when it comes to the price action.

Technical drivers have prevailed after the euro retreated from its ten-month high of 127.30 and went sideways. With the uptrend at stake, buyers will need a strong catalyst to push through this key hurdle.

Positive growth and inflation data from the eurozone and Germany might do the trick.

A bullish breakout past 127.30 may resume the rally. To the downside, 123.00 is the psychological support to watch for.

By Orbex

The Analytical Overview of the Main Currency Pairs on 2021.01.25

by JustForex

The EUR/USD currency pair

Technical indicators of the currency pair:
  • Prev Open: 1.2163
  • Prev Close: 1.2169
  • % chg. over the last day: +0.05%

By the end of Friday, EUR/USD showed uncertainty about the northern movement. Major currencies continue to trade near their highs of the year, while the euro is fixing around mid-December levels. On the daily chart, the technical characteristics show a significant decline in bullish potential with the likelihood of going into a deep correction.

Trading recommendations
  • Support levels: 1.2077, 1.2059
  • Resistance levels: 1.2222, 1.2283

The main scenario for trading EUR/USD is trading in a sideways range between 1.2141 – 1.2222. The northward movement has slowed considerably. There are only small signs of further growth. The price is fixed above the moving averages and the MACD is above zero. But the ADX shows low upside potential.

Alternative scenario: if the price can fix below the level of 1.2141, the pair may move to a decline to 1.2077.

EUR/USD
News feed for 2021.01.25:
  • – IFO Business Climate indicator for Germany (Jan) at 12:00 (GMT+2).

The GBP/USD currency pair

Technical indicators of the currency pair:
  • Prev Open: 1.3728
  • Prev Close: 1.3681
  • % chg. over the last day: -0.34%

The sterling showed a sharp decline on Friday. Services PMI data disappointed traders. A sharp contraction in the services sector and a faster-than-expected slowdown in production make Britain one of the most troubled regions in Europe. The economic recovery can be significantly delayed.

Trading recommendations
  • Support levels: 1.3622, 1.3517
  • Resistance levels: 1.3716, 1.3744

The main scenario in GBP/USD is trading sideways between 1.3716 and 1.3622. Despite the sharp drop on Friday, the southern impulse hasn’t been developed. The pair is recovering in the Asian session, while technical indicators are prone to a quick change in direction. This indicates a greater likelihood of sideways movement within Friday’s range.

Alternative scenario: if the pair fixes below 1.3622, it’s likely to return to 1.3517. A break at 1.3716 will indicate the renewed growth.

GBP/USD
There is no news feed for today.

The USD/JPY currency pair

Technical indicators of the currency pair:
  • Prev Open: 103.49
  • Prev Close: 103.74
  • % chg. over the last day: +0.24%

USD/JPY continues to ignore the position in the stock market, and it’s trading mainly following the dollar index. It looks like this pair has completely lost touch with risky assets. On Friday, PMI data was able to support the dollar, but the growth is insignificant, indicating the likelihood of continued trading in a narrow range.

Trading recommendations
  • Support levels: 103.32, 102.89
  • Resistance levels: 104.09, 104.40

The main scenario is trading in a range between 104.09 and 103.32. The ADX is reacting to the northern movement, which indicates the possibility of reaching the resistance level in the first place. The rest of the technical indicators are very weak. Lacking important statistics, volatility may remain low.

The alternative scenario assumes the price-fixing above 104.09. In this case, the pair may be able to return to 104.40 or higher. A break-through of 103.32 will indicate a continued decline.

USD/JPY
There is no news feed for today.

The USD/CAD currency pair

Technical indicators of the currency pair:
  • Prev Open: 1.2632
  • Prev Close: 1.2725
  • % chg. over the last day: +0.73%

On Friday, the Canadian dollar showed a sharp rebound from the established highs, which may indicate that it has reached an overbought area against the dollar. It should be noted that the fall in USD/CAD last week was due to statements by the Bank of Canada. But since no changes in monetary policy are expected, a rebound is quite natural, and further southward movement without changes in oil prices may be difficult.

Trading recommendations
  • Support levels: 1.2624, 1.2590
  • Resistance levels: 1.2797, 1.2834, 1.2875

The main scenario is trading in a sideways range between 1.2739 and 1.2624. In the Asian session, there is a pullback, which is followed by a slight rise in the ADX. This indicates the likelihood of a continuation of the southern correction. But as long as the price is above the moving averages, it’s difficult to expect a strong decline.

Alternative scenario: if the price can fix below 1.2624, the pair may resume its southward direction. A break-through of 1.2739 from the bottom up will indicate further growth.

USD/CAD
There is no news feed for today.

by JustForex


This article reflects a personal opinion and should not be interpreted as an investment advice, and/or offer, and/or a persistent request for carrying out financial transactions, and/or a guarantee, and/or a forecast of future events.

The stock market continues to rise, as positive data from IHS Markit for the US is being released. The dollar index is growing

by JustForex

The end of last week was alarming for Europe and positive for the United States. Following Germany, where the PMI indices came out weak, the UK reported. Foggy Albion is likely to start 2021 with a shrinking economy. IHS Markit data showed a stronger-than-expected contraction for the services sector.

According to preliminary estimates, the CIPS UK PMI fell to 38.8 in January from 49.4 in the previous month. The latest data point to the third consecutive month of decline in the services sector and the sharpest deterioration since May 2020. The lower activity level reflects a decline in both business and consumer spending in early 2021. Consumer demand dropped significantly and new projects were postponed as a result. The hopes for economic recovery are concentrated mainly in the second half of this year.

In the US, PMIs came out opposite. There is an acceleration in growth, which surprised part of the market. The forecast assumed a slowdown to 53.6 in the service sector and to 56.5 in the manufacturing sector. Preliminary estimates of economic activity in January came out not only higher than expected, but also showed an acceleration of growth to 57.5 in the services sector. The manufacturing sector accelerated to 59.1.

Both manufacturing and new export orders in the US were the highest since 2014, and job growth was the highest in 2 years. Business confidence remained high in early 2021, but declined relative to December.

Given this background, the stock market continues to ignore the negative data in Europe, as well as the tightening of quarantine. The S&P 500 is consolidating near its historic highs. Treasury yield is stable at around 1.10%. Investors expect new doses of stimulus for the economy. Despite opposition to Joe Biden’s new bill from the Republicans, market players are confident that at least some part of this plan is still being implemented.

Main market quotes:

S&P 500 (F) 3,845.62 +11.37 (+0.30%)

Dow Jones 30,996.98 -179.03 (-0.57%)

DAX 13,879.00 +5.03 (+0.04%)

FTSE 100 6,695.71 +0.64 (+0.01%)

USD Index 90.273 +0.061 (+0.07%)

Important events:
  • – 11:00 (GMT+2) German IFO Business Climate Index (Jan).

by JustForex


This article reflects a personal opinion and should not be interpreted as an investment advice, and/or offer, and/or a persistent request for carrying out financial transactions, and/or a guarantee, and/or a forecast of future events.

Pound Looking Confident

Author: Dmitriy Gurkovskiy, Chief Analyst at RoboForex

On Monday, January 25th, the British Pound is looking quite confident while rising against the USD. GBPUSD has reached 1.3705, which is not too far from the last week’s high at 1.3746.

The Pound managed to get rid of a very negative catalyst, Brexit, although the Brexit-related risks, implementation of all negotiated arrangements to be exact, didn’t go anywhere, but investors are pretty calm when assessing them. At the same time, they are also very optimistic about the start of the vaccination against the COVID-19. Market players must be thinking as follows: as soon as the vaccination procedure accelerates, the pandemic will be taken under control. For the country’s economy and population, it will imply the removal of a lot of quarantine restrictions and the opportunity to get back to a normal consumer life. However, this will probably happen in the second quarter at the earliest but investors are fine with that.

This week, the United Kingdom is scheduled to publish a lot of interesting reports on employment for November and December 2020, which may hurt the Pound if there are any changes for the worse.

As we can see in the H4 chart, GBP/USD is moving not far from 1.3688 and this range may be considered as an upside continuation pattern. Possibly, today the pair may grow to reach 1.37440. After that, the instrument may correct to return to 1.3688 and then resume continue trading upwards to form the third ascending wave with the short-term target at 1.3850. From the technical point of view, this scenario is confirmed by MACD Oscillator: its signal line is steadily rising inside the histogram area.

In the H1 chart, after breaking 1.3688 to the upside, the asset is expected to form one more ascending structure to reach 1.3744, which may be considered as the first one inside a new rising wave. After that, the instrument may start another correction to return to 1.3688 and then form the third ascending structure with the target at 1.3800. From the technical point of view, this scenario is confirmed by Stochastic Oscillator: its signal line is moving above 80, which suggests that the market is trading within the “overbought area” and may complete the first ascending structure. In the future, there might be a new decline in the price chart.

Disclaimer

Any forecasts contained herein are based on the author’s particular opinion. This analysis may not be treated as trading advice. RoboForex bears no responsibility for trading results based on trading recommendations and reviews contained herein.

Chinese yuan and economy are growing rapidly

By ForexNewsNow

2020 has been a terrible year for the world economy. The devastating impact that the coronavirus pandemic brought to different countries is something no one expected. Covid-19 shows no signs of slowing down and every day we see record cases.

China, where the virus first appeared in Wuhan has dealt effectively with it. While European countries have become the center of the outbreak, China is already recovering from the losses.

We can see that China’s economy is reviving. The yuan has reached its highest level in more than two years. There are no signs of a halt in growth, which indicates China’s dominant role in the global economy. National exports continued to rise even as the yuan strengthened.

According to Alexandra Stevenson of The New York Times, China’s economy has overcome the coronavirus pandemic. As production revived, so did the national currency. The Chinese yuan has risen sharply against the US dollar and other currencies in recent months. On Monday (January 11) the US dollar was worth 6.47 yuan. In two and a half years it was one of the highest rates.

When we talk about currencies, it is something that concerns a lot of people involved in Forex trading and brokers alongside them. Brokers often make predictions and statements about the currency’s role in the economy and trading. According to Axiory, which is one of the leading brokers, the strong currency also strengthens the country’s economy. A strong yuan may lead to a rise in the price of Chinese exports, but so far this effect seems insignificant. The growth of the national currency of China will, first of all, feel the White House, where U.S. President-elect Joseph Biden is going to move next week. In previous U.S. administrations, the yuan’s weakening has generally been irritating. Strengthening the currency of China, if it does not ease the tension between the countries, will help to remove one potential problem from the agenda of President Biden.

Currency and its strength is especially important for Forex traders. If we take a look at the currency strength meter MT4, one of the most popular trading tools used today,  the indicator’s job is to let the trader know which currency is performing well at a given time and which one is not. And Chinese yuan is one of the most traded currencies in the world.

Why is the yuan rate strengthening?

China has managed to suppress the coronavirus pandemic within its borders, at least for now. Factories are operating at full capacity. Customers around the world, many of whom are stuck at home, buy Chinese computers, televisions, selfie ring lights, swivel chairs, garden tools and other household appliances on the Internet. According to Jefferies Co., China’s share of world exports rose to a record of 14.3% in September 2020.

Investors are also keen to keep their money in China, or at least invest it in yuan. When the Chinese economy strengthens, China’s central bank is able to set interest rates higher than in Europe and the United States. There, central banks maintain the lowest ever rates to support economic growth.

Against the background of the weakened U.S. currency, the yuan now looks particularly strong. Investors are betting on the recovery of the world economy in 2021. Many of them are beginning to transfer their money from U.S. Treasury bonds to riskier financial instruments. All this led to an increase in cash flows to China, and this in turn contributed to the strengthening of the national currency.

How does Beijing work?

The Chinese authorities have not yet taken anything special. The Chinese government has for years kept the yuan’s exchange rate against the dollar weak, even as the Chinese currency was expected to strengthen. The weak yuan helped Chinese factories keep prices low when selling goods abroad. It seems that now manufacturers do not need such help. China’s exports continued to rise even as the yuan strengthened.

Shawn Roache, who is chief Asia Pacific economist at the Asia-Pacific agency, noted that many people rate their business in dollars, not yuan because the United States makes up a significant share of their customer base. This means that while the profitability of the Chinese factory may decline, American buyers will not notice much difference in prices and will continue to buy.

A strong yuan could help China make the national currency more attractive to companies and investors who want to do business in dollars. China has long sought to give its currency more weight in the global monetary system to increase international influence, but the Chinese authorities’ desire to strictly control the use of the yuan often overshadows those ambitions.

Becky Liu, who is head of China’s macroeconomic strategy at Standard Chartered Bank, also said that this was definitely an opportunity for China to move the yuan to the international level.

However, if the national currency strengthens too quickly, Chinese leaders can step in and put an end to this trend.

China is destined to become the world’s leading economy. Many experts believe it is only a matter of time before it surpasses the United States and takes the lead.

By ForexNewsNow

GBPUSD On Track To Settle Above 1.3700

By Orbex

gbpusd

The British pound sterling continues to keep a bullish hold. After failing to break out above 1.3700 level, prices managed to do so on Thursday.

With intraday gains pushing the GBPUSD somewhat higher, we expect the 1.3700 level to hold for the moment.

This will potentially open the way for the currency pair to post further gains. The next key target will of course be the 1.3950 level which was briefly tested as support back in April 2018.

However, the gains will continue only on a strong continuation to the upside.

At the current levels near 1.3700, price action is testing the support from 2018 March. Therefore, with this level now likely to act as resistance, we could see a decline.

By Orbex

Ichimoku Cloud Analysis 22.01.2021 (BTCUSD, USDRUB, USDJPY)

Article By RoboForex.com

BTCUSD, “Bitcoin vs US Dollar”

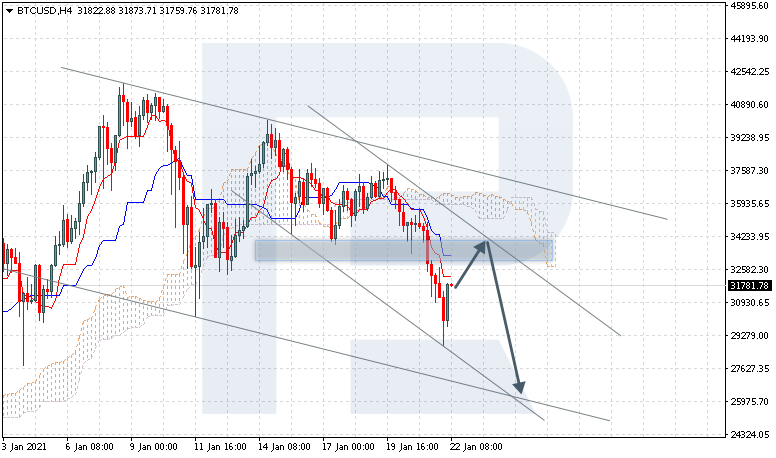
BTCUSD is trading at 31781.00; the instrument is moving below Ichimoku Cloud, thus indicating a descending tendency. The markets could indicate that the price may test Tenkan-Sen and Kijun-Sen at 33805.00 and then resume moving downwards to reach 26355.00. Another signal in favor of a further downtrend will be a rebound from the descending channel’s upside border. However, the bearish scenario may no longer be valid if the price breaks the cloud’s upside border and fixes above 37590.00. In this case, the pair may continue growing towards 41105.00.

BTCUSD
Risk Warning: the result of previous trading operations do not guarantee the same results in the future

USDRUB, “US Dollar vs Russian Ruble”

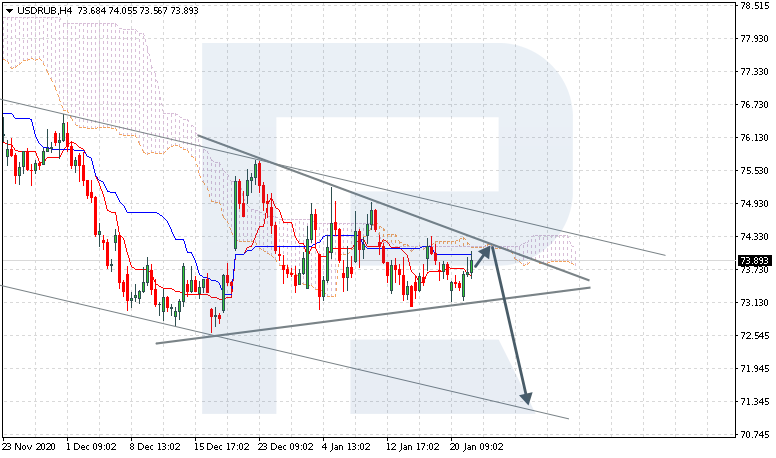
USDRUB is trading at 73.89; the instrument is moving below Ichimoku Cloud, thus indicating a descending tendency. The markets could indicate that the price may test the cloud’s downside border at 73.95 and then resume moving downwards to reach 71.35. Another signal in favor of a further downtrend will be a rebound from the upside border of the Triangle pattern. However, the bearish scenario may be canceled if the price breaks the cloud’s upside border and fixes above 74.45. In this case, the pair may continue growing towards 75.55. To confirm further decline, the asset must break the pattern’s downside border and fix below 72.65.

USDRUB
Risk Warning: the result of previous trading operations do not guarantee the same results in the future

USDJPY, “US Dollar vs Japanese Yen”

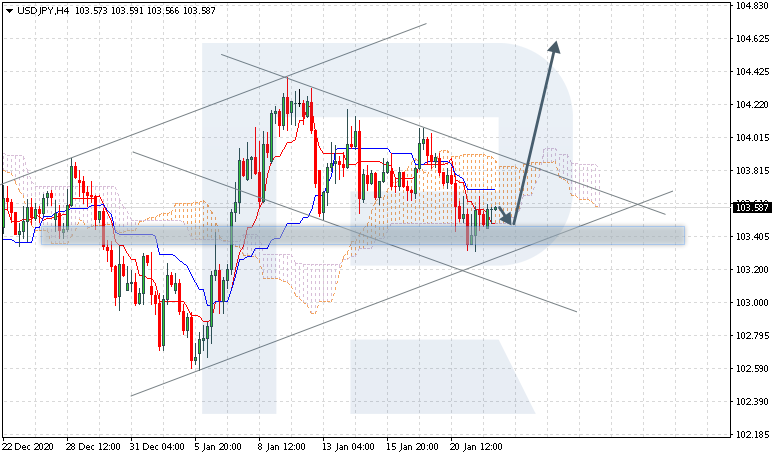
USDJPY is trading at 103.58; the instrument is moving inside Ichimoku Cloud, thus indicating a sideways tendency. The markets could indicate that the price may test the cloud’s downside border at 103.55 and then resume moving upwards to reach 104.65. Another signal in favor of a further uptrend will be a rebound from the support level. However, the bullish scenario may no longer be valid if the price breaks the cloud’s downside border and fixes above 103.20. In this case, the pair may continue falling towards 102.35. To confirm further growth, the asset must break the descending channel’s upside border and fix above 103.95.

USDJPY

Article By RoboForex.com

Attention!
Forecasts presented in this section only reflect the author’s private opinion and should not be considered as guidance for trading. RoboForex LP bears no responsibility for trading results based on trading recommendations described in these analytical reviews.

The Analytical Overview of the Main Currency Pairs on 2021.01.22

by JustForex

The EUR/USD currency pair

Technical indicators of the currency pair:
  • Prev Open: 1.2104
  • Prev Close: 1.2162
  • % chg. over the last day: +0.48%

At the end of Thursday, EUR/USD demonstrated the presence of bullish strength, but the pair is still holding the position of a chasing one among the G10 currencies. Growth in German Bonds yields indicates a possible continuation of the upward movement, but a full renewal of the northern trend is still in question.

Trading recommendations
  • Support levels: 1.2077, 1.2059
  • Resistance levels: 1.2222, 1.2283

The main scenario for trading EUR/USD is buying. Northbound movement may be described as a slow one, but technical characteristics are indicative of a likely continuation. The ADX has reached a high point, which indicates the need for a pullback. The MACD is fixed in the positive zone, but no convergence has occurred, which proves the slow growth.

Alternative scenario: if the price manages to fix below the level of 1.2077, the pair may move to a decline to 1.1799.

EUR/USD
News feed for 2021.01.22:
  • – Germany Manufacturing PMI (Jan) at 11:30 (GMT+2);
  • – Eurozone Manufacturing PMI (Jan) at 12:00 (GMT+2).

The GBP/USD currency pair

Technical indicators of the currency pair:
  • Prev Open: 1.3650
  • Prev Close: 1.3729
  • % chg. over the last day: +0.58%

On Thursday, the sterling continued to dominate and renewed its own records of the year. The bulls were encouraged by positive expectations of UK government support for workspaces. But in the Asian session, there is a rapid decline, which calls further growth into question.

Trading recommendations
  • Support levels: 1.3622, 1.3517
  • Resistance levels: 1.3716, 1.3744

The main scenario in GBP/USD is being traded in a sideways range between 1.3716 and 1.3622. The potential for a southward movement on the ADX is indicated as an increasing one. The fast move sent the MACD to zero and the SMA50 was broken-through, which brings the continuation of the upward movement into question. The pair is likely to stop between the first support and resistance levels.

Alternative scenario: if the pair fixes below 1.3622, the pair is likely to return to 1.3517. A break-through at 1.3716 will indicate a renewed growth.

GBP/USD
News feed for 2021.01.22:
  • – UK Retail Sales (MoM) (Jan) at 10:00 (GMT+2);
  • – UK Services PMI (Jan) at 12:30 (GMT+2).

The USD/JPY currency pair

Technical indicators of the currency pair:
  • Prev Open: 103.52
  • Prev Close: 103.48
  • % chg. over the last day: -0.03%

The USD/JPY was pretty close to the support level but it bounced back, almost forming a daily candle called “Doji”. This usually holds out the prospect of a reversal, but seeing how the pair reacts to the situation of the stock market, the growth remains highly questionable. It’s not yet possible to single out any stable direction in the pair, both on the lower and higher time frames.

Trading recommendations
  • Support levels: 103.32, 102.89
  • Resistance levels: 104.09, 104.40

The main scenario is trading in a range between 104.09 and 103.32. The ADX began to react to both directions, and the frequent change of priorities indicates the development of lateral dynamics. The MACD is near zero, and the price is between the moving averages. All signals are neutral.

The alternative scenario assumes the price-fixing above 104.09. In this case, the pair may return to 104.40 or higher. A break-through of 103.32 will indicate a continued decline.

USD/JPY
There is no news feed for today.

The USD/CAD currency pair

Technical indicators of the currency pair:
  • Prev Open: 1.2632
  • Prev Close: 1.2633
  • % chg. over the last day: -0.01%

On Thursday, oil prices retreated from their highs slightly and continued their decline in the Asian session on Friday. At the same time, the dollar index is correcting, which together caused a northern pullback in the currency pair. But it’s difficult to talk about reversal yet.

Trading recommendations
  • Support levels: 1.2590, 1.2450
  • Resistance levels: 1.2797, 1.2834, 1.2875

The main scenario is purchases. The pair is prone to a rollback and, possibly, the deep one so far. The ADX showed a high potential for an upward movement intraday. The MACD has turned over sharply and is in the positive zone. But for now, the price is fixed below SMA 100. For a more accurate buy signal, it’s advisable to wait for a pullback to SMA 50 and see a rebound or for a break-through and price fixation above SMA 100.

Alternative scenario: if the price can fix below 1.2590, the pair may resume its southward direction.

USD/CAD
There is no news feed for today.

by JustForex


This article reflects a personal opinion and should not be interpreted as an investment advice, and/or offer, and/or a persistent request for carrying out financial transactions, and/or a guarantee, and/or a forecast of future events.