Archive for Forex and Currency News – Page 309

Fibonacci Retracements Analysis 18.02.2021 (AUDUSD, USDCAD)

Article By RoboForex.com

AUDUSD, “Australian Dollar vs US Dollar”

As we can see in the H4 chart, after falling and reaching 23.6% fibo, AUDUSD has formed a new rising impulse towards the high at 0.7820. If the pair breaks the high, it may continue growing to reach the post-correctional extension area between 138.2% and 161.8% fibo at 0.7918 and 0.7978 respectively. However, if the asset rebounds from the high, it may resume falling and expand the correctional range. The correctional targets may be at 38.2% and 50.0% fibo at 0.7503 and 0.7406 respectively.

AUDUSD_H4
Risk Warning: the result of previous trading operations do not guarantee the same results in the future

The H1 chart shows that a local divergence on MACD made the pair start a new correctional downtrend, which, after breaking 23.6% fibo, has failed to reach 38.2% fibo at 0.7713. The next rising wave may be heading to break the local and key highs at 0.7805 and 0.7820 respectively. However, considering the direction of the MACD lines, the market may yet form another descending wave to reach z8.2% and 50.0% fibo at 0.7713 and 0.7684 respectively.

AUDUSD_H1
Risk Warning: the result of previous trading operations do not guarantee the same results in the future

USDCAD, “US Dollar vs Canadian Dollar”

As we can see in the H4 chart, USDCAD is falling again to test the low at 1.2589. Considering a divergence on MACD, the pair may rebound and start a new rising impulse towards 23.6%, 38.2%, and 50.0% fibo at 1.3979, 1.3382, and 1.3628 respectively. On the other hand, the asset may yet continue falling to reach the fractal support at 1.2061.

USDCAD_H4
Risk Warning: the result of previous trading operations do not guarantee the same results in the future

The H1 chart shows that the descending wave has reached 50.0% fibo after a convergence on MACD. Later, the market may continue growing towards 61.8% and 76.0% fibo at 1.2778 and 1.2816 respectively. However, the key target is the local high at 1.2881. The support is the low at 1.2610.

USDCAD_H1

Article By RoboForex.com

Attention!
Forecasts presented in this section only reflect the author’s private opinion and should not be considered as guidance for trading. RoboForex LP bears no responsibility for trading results based on trading recommendations described in these analytical reviews.

Gold Collapses As USD Soars On Data Beat

By Orbex

Gold

It’s been a disappointing week for gold bulls.

Following the recovery rally seen across the first week of February, the gold market has swung back into net sales this week. Gold prices are falling from highs of around the mid-1826 level at the start of the week to lows of around mid-1779 as of writing. Price is now quickly approaching the December 2020 lows.

The main driver behind the sharp selloff in gold this week has been the unexpected recovery in the US dollar.

The greenback surged mid-week in response to much better than expected US data. January Retail Sales came in at 5.3% versus 1.2% expected. Set against the broader backdrop of increased optimism around the US vaccination push, the data has once again lifted USD sentiment as traders keep their eyes firmly on the recovery.

The data has fuelled a sell-off across the commodities and equities space as buyers once again flood back into the dollar.

With the US government pushing ahead with plans to pass the president’s $1.9 trillion fiscal stimulus package, there is room for further dollar appreciation in the near term as traders react to signs of a strengthening economy.

Gold Approaching Key Support

xauusd

Gold prices continue to trade within the bearish channel which has formed the correction from last year’s highs.

Following the break below the 1826.71 level, price is now once again approaching the big 1763.88 level. This is a major support area for gold and a break lower here will open the path for a test of the 1700 handle next.

Silver

Despite the sell-off in gold and the rally in USD this week, silver prices have remained well supported around recent highs.

The silver market has seen congested trading of late and struggled to make a directional move this week. However, silver avoided breaking lower like gold, most likely linked to better demand expectations amidst the burgeoning economic recovery in the US.

Later this week traders will be looking to the next round of manufacturing readings from the US, UK, and EZ which are likely to offer further support for silver prices.

Silver Capped by Resistance

xagusd

Silver prices continue to push up against the 27.4502 level this week. The market broke above the level midweek but returned lower amidst the recovery in USD.

For now, the focus remains on a continued grind higher with bulls looking for a further challenge of the 30.1117 highs. To the downside, any spike lower will see support at the 25.1018 level come back into play.

By Orbex

Fed Warns Economy Is Far From Normal

By Orbex

Dollar Bounces Higher

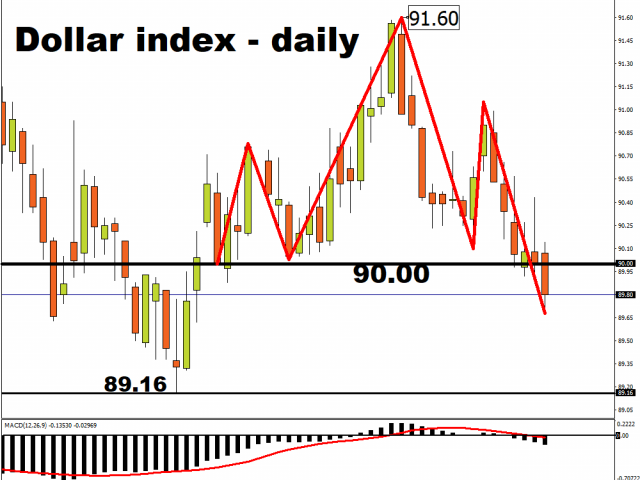
The dollar index rose by a further 0.22% yesterday as it flirted with the 91 handle, its highest level in over a week.

Retail sales for January rose 5.3% on a month-over-month basis versus expectations of 1.1%. Whilst Industrial production increased 0.9% from a month earlier in January 2021, following a downwardly revised 1.3% growth.

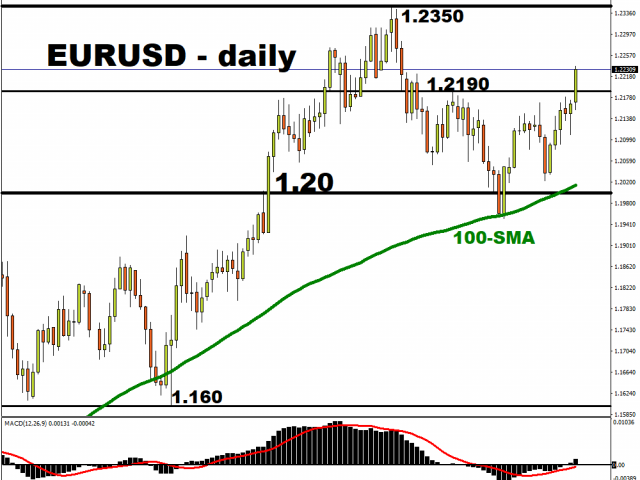
This led to the EURUSD pair collapsing towards 1.20, as it fell by 0.56%, firmly waved goodbye to the 1.21 level.

However, Fed officials see the economy far from where it needs to be, meaning there will be little change to their policy anytime soon.

Sterling Suffers Sell-Off

The pound seemed to exhaust yesterday as it closed 0.28% lower, failing to keep hold of the 1.39 level.

This comes despite figures showing a strong decline in levels of coronavirus infections in England since January.

The Prime Minister will be hoping for continued positive data, as his roadmap out of the restrictions comes into play.

Indices Close Choppy

US stocks ended the trading day mixed, with the the Dow Jones being the best performer on Wall Street.

The S&P was relatively unchanged, whereas the Nasdaq sank 0.58% as technology shares dragged the tech-heavy index lower.

The big driver of the day was Chevron, as its stock rose by almost 2% after Warren Buffett’s Berkshire Hathaway revealed multibillion-dollar stakes in the and oil-and-gas major.

Gold Remains Vulnerable

Gold slid a further 1% yesterday as it continued to lose ground for a fifth consecutive session.

The dollar recovery from multi-week lows weighs in on the metal, as the stage seems set for a retest of Q4 lows.

The greenback remained well supported by the recent runaway rally in the US Treasury bond yields. This was seen as a key factor that drove flows away from the non-yielding yellow metal.

WTI Stocks Dwindle

Oil had a day to remember as it closed 2.5% higher, punching through the $61 ceiling.

API boosted prices as it reported a draw in oil inventories of 5.8 million barrels, against estimates of 2.4 million.

The continuous cold snap in parts of America is also elevating levels, as the freezing temperatures look to remains until the end of the week.

By Orbex

The Analytical Overview of the Main Currency Pairs on 2021.02.18

by JustForex

The EUR/USD currency pair

Technical indicators of the currency pair:
  • Prev Open: 1.2106
  • Prev Close: 1.2039
  • % chg. over the last day: -0.55%.

In the EUR/USD, there is an acceleration of the decline after positive data on retail sales in the US. The continued growth of the dollar index after the “bullish engulfing” candle, formed on Tuesday, may indicate the beginning of a stable trend. Still, the lack of growth in the yield on 2-year US bonds calls into question such a medium-term scenario.

Trading recommendations
  • Support levels: 1.2011, 1.1952
  • Resistance levels: 1.2155, 1.2189

The main scenario for trading the EUR/USD is selling. On the H1 and H4 timeframes, the ADX has shown significant growth, which indicates a high potential for bearish pressure. The pair may hit 1.2011 or below. But on the H1 the oscillators have reached the oversold level, which indicates a high probability of a pullback to the moving average in the 1.2083 area.

Alternative scenario: if the price can gain a foothold above the level of 1.2083, the pair may continue to rise to 1.2155.

EUR/USD
News feed for 2021.02.18:
  • – The Release of the ECB Monetary Policy Account at 14:30 (GMT+2);
  • – The United States Initial Jobless Claims at 15:30 (GMT+2);
  • – The Philadelphia Fed Manufacturing Index (Feb) at 15:30 (GMT+2).

The GBP/USD currency pair

Technical indicators of the currency pair:
  • Prev Open: 1.3899
  • Prev Close: 1.3858
  • % chg. over the last day: -0.30%

The sterling has shown only a slight decrease in price, and the two-day southern movement is proceeding without acceleration, in contrast to the euro. Nevertheless, while the entire market is subject to correction against the dollar, including precious metals, the GBP/USD may still be under pressure.

Trading recommendations
  • Support levels: 1.3775, 1.3680
  • Resistance levels: 1.3950, 1.4000

The main scenario for trading the GBP/USD is cautious selling. On the hourly timeframe, the price consolidated below the SMA 100, which gives more signals to sell. Convergence has been formed on the MACD, confirming the south direction. But the ADX shows minimal reaction when the price goes down, which indicates a slow southern correction.

Alternative scenario: if the pair consolidates above 1.3884, it may return to 1.3950.

GBP/USD
There is no news feed for today.

The USD/JPY currency pair

Technical indicators of the currency pair:
  • Prev Open: 106.02
  • Prev Close: 106.22
  • % chg. over the last day: -0.19%

The dollar-yen has surprisingly been showing a strong correlation with the stock market all week, which has not happened for a long time. Despite the rise in the dollar index, the pair fell following the Asian and American risky assets. A long shadow is visible on Wednesday’s daily candlestick, which may signal a stop in northern movement and the beginning of a correction. But there are no other strong selling points yet.

Trading recommendations
  • Support levels: 105.10, 104.40
  • Resistance levels: 106.12, 106.55

The main scenario is buying. The bullish direction is still the main one. The price was unable to gain a foothold below the moving averages. The MACD dropped to zero. The ADX showed no reaction to the price pullback. This indicates the absence of bearish pressure. The northern trend is still likely to continue.

An alternative scenario implies the price-fixing below 105.50. In this case, the pair may go for a correction to 105.10.

USD/JPY
News feed for 2021.02.18:
  • – The United States Initial Jobless Claims at 15:30 (GMT+2);
  • – The Philadelphia Fed Manufacturing Index (Feb) at 15:30 (GMT+2).

The USD/CAD currency pair

Technical indicators of the currency pair:
  • Prev Open: 1.2687
  • Prev Close: 1.2698
  • % chg. over the last day: +0.09%

The pair was able to only partially react to the movement of the US dollar, showing subtle growth. However, the pressure from the commodity market is becoming noticeable. Oil quotes continued to rise amid the declining US oil inventories and the ongoing emergency in Texas.

Trading recommendations
  • Support levels: 1.2590, 1.2550
  • Resistance levels: 1.2745, 1.2763

The main scenario is trading in a sideways range between 1.2682 and 1.2745. The ADX and the MACD have dropped to their minimum values, which indicates the absence of price direction. The pair is above the moving averages, and it gives little priority to buying. At the same time, a high shadow at the top casts doubt on the upward movement.

Alternative scenario: if the price consolidates below 1.2682, the pair may resume its decline to the level of 1.2590. A rise above 1.2745 will indicate a continuation of the northern correction.

USD/CAD
News feed for 2021.02.18:
  • – The United States Initial Jobless Claims at 15:30 (GMT+2);
  • – The Philadelphia Fed Manufacturing Index (Feb) at 15:30 (GMT+2);
  • – The US crude oil reserves at 18:00 (GMT+2).

by JustForex


This article reflects a personal opinion and should not be interpreted as an investment advice, and/or offer, and/or a persistent request for carrying out financial transactions, and/or a guarantee, and/or a forecast of future events.

The volume of retail sales in the United States showed unexpectedly high figures. The dollar continues to strengthen

by JustForex

January retail sales in the United States grew at the fastest pace in seven months, which was well above economists’ estimates. According to the Ministry of Commerce on Wednesday, the total sales volume increased by 5.3% against a 1% decline in December. The median estimate of the economists’ survey predicted an increase in retail sales by only 1.1%.

The sharp increase of coronavirus cases led to the population’s spending cuts at the end of the year. But as the U.S. government began to ease some restrictions on business, people were given the opportunity to shop more and visit restaurants. Combined with the latest round of payments in the amount of $600, there has been a significant boost of monthly expenses in various segments of the population.

Retail sales in online stores increased by 11% – the highest figure in two years. The number of workplaces in the food service industry increased by 6.9% as the restrictions on restaurants and bars across the country were lifted. Furniture, electronics, and home appliances stores also showed double-digit growth for the month.

The so-called “control group of goods”, which doesn’t include catering products, car showrooms, building materials stores, and gas stations, increased by 6%, which is the largest increase since June. This is the most important indicator, as it’s correlated to GDP the most.

For the stock market, this data is currently ambiguous. On the one hand, this is positive news. But on the other hand, there is the question of the need to distribute the assistance to the population according to the Joe Biden program.

Against this background, investors have taken a wait-and-see attitude. The stock market is gradually declining and the dollar is rising. 10-year government bonds yield slightly decreased to 1.28%.

Main market quotes:

S&P 500 (F) 3,917.12 -10.88 (-0.28%)

Dow Jones 31,613.02 +90.27 (+0.29%)

DAX 13,927.70 +18.43 (+0.13%)

FTSE 100 6,706.14 -4.76 (-0.07%)

USD Index 90.820 -0.129 (-0.14%)

Important events:
  • – Employment change in Australia (Jan) at 02:30 (GMT+2);
  • – Minutes publication of ECB Meeting on the monetary policy at 14:30 (GMT+2);
  • – United States Initial Jobless Claims at 15:30 (GMT+2);
  • – Philadelphia Fed Manufacturing Index (Feb) at 15:30 (GMT+2);
  • – US сrude oil reserves at 18:00 (GMT+2).

by JustForex


This article reflects a personal opinion and should not be interpreted as an investment advice, and/or offer, and/or a persistent request for carrying out financial transactions, and/or a guarantee, and/or a forecast of future events.

Will The Fed Revive The Dollar?

By Orbex

Dollar Reprieve, But for How Long?

The greenback reversed by 0.28% yesterday, bouncing of the 90 handle.

Investors have gained confidence about Biden’s proposal being voted on by the end of the month.

However, analysts were quick to declare that the continuation of the downtrend in the dollar looks the most likely.

We now await today’s retail and production data, with the FOMC minutes shifting attention back to policy narratives.

Eurozone GDP Contracts as Expected

The euro closed 0.20% lower on Tuesday as the expectant GDP figures of Q4 were released.

Eurostat stated GDP in the 19 countries sharing the euro contracted 0.6% QoQ in the October-December period, for a 5% annual decline.

Even though the figure was slightly better than earlier estimates than a contraction of 0.7%, GDP was 4.8% lower than a year earlier.

Where next for the euro bloc?

Sterling Shows Signs of Exhaustion

The pound ended yesterday’s session on an indecisive note as it failed to test the 1.40 psychological handle.

The UK will publish January inflation data shortly. The annual CPI is foreseen at 0.5% from 0.6% previously while the core annual inflation is expected at 1.3%.

Will this be enough for sterling to get back on track as bulls lay in wait.

Indices Touch New Highs

The S&P and the Dow hit all-time highs on Tuesday, as cyclical sectors gained on the prospect of more fiscal aid to lift the US economy from a coronavirus-driven slump.

The three major indices however could not hold onto those gains, as they ended the session on a negative footing.

The main driver on the stocks are the additional stimulus payments, as investors watch closely on any headline announcements from the new President.

Gold Dives Again

Gold closed 1.34% lower on Tuesday as it plummeted over $20, crashing through the $1800 level.

The yellow metal remained on the back foot as it fell to 2-week losses as bears cashed in.

Improvements with coronavirus conditions and the jump in vaccinations joined hopes of the US virus relief favoured metal sellers.

WTI Hovers At $60

Oil eased off the $60 level yesterday as it closed out the session on a mixed setting.

The main talking point in energy markets this week has been the disruption to US productive capacity, due to adverse weather conditions in the Gulf of Mexico region.

The blizzard has reportedly reduced daily crude oil production by 2m bpd. Whilst supply is likely to return to normal soon, the loss of output only serves to further tighten global oil markets which are already being squeezed by ongoing OPEC+ output cuts.

By Orbex

Japanese Candlesticks Analysis 17.02.2021 (GOLD, NZDUSD, GBPUSD)

Article By RoboForex.com

XAUUSD, “Gold vs US Dollar”

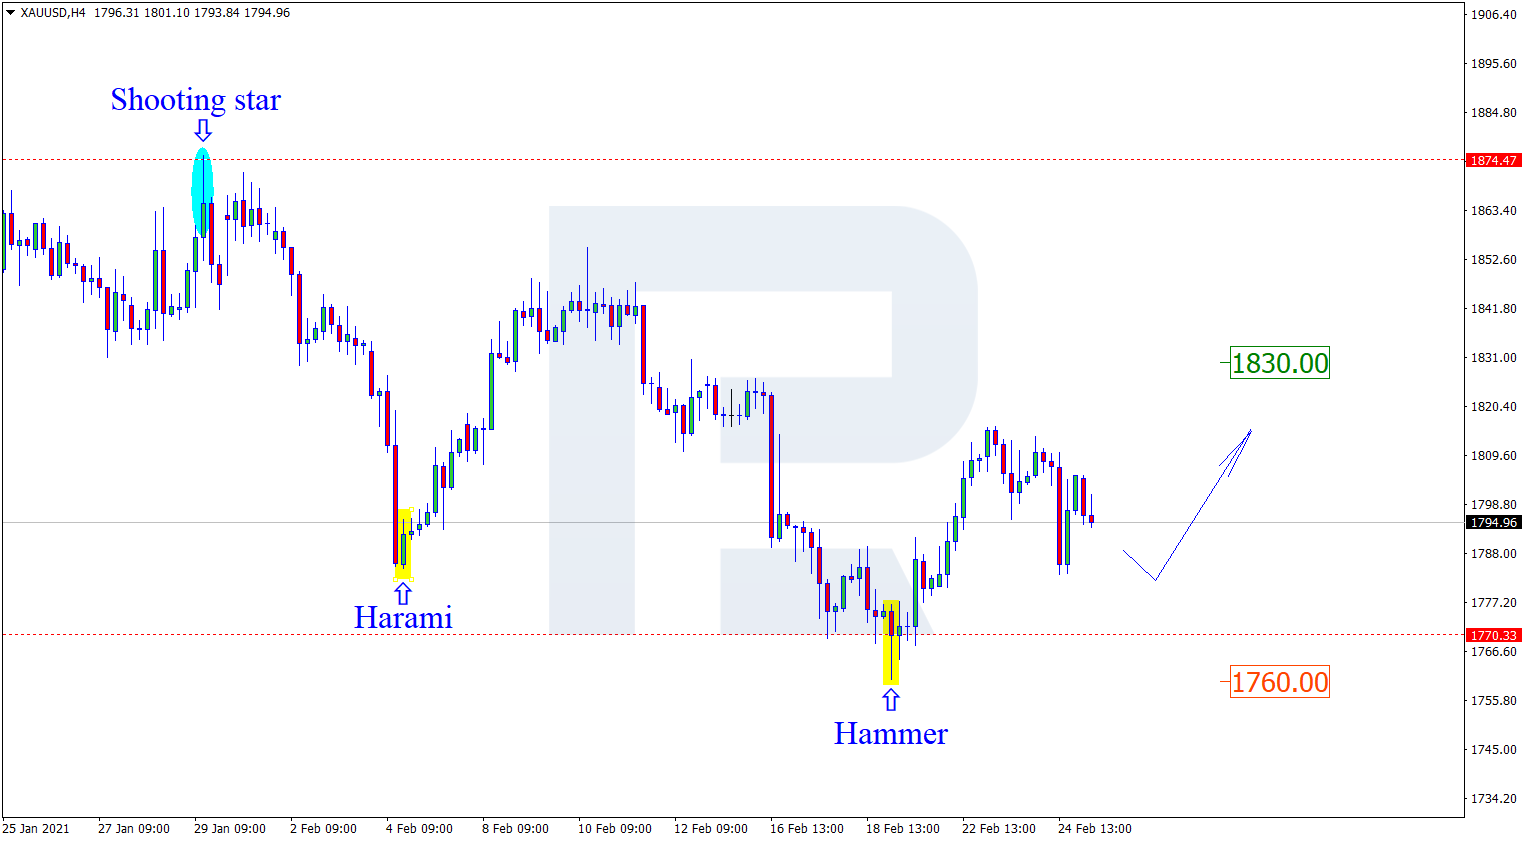
As we can see in the H4 chart, the metal is about to finish the correctional impulse. After forming several reversal patterns, such as Hammer, close to the horizontal support level, XAUUSD may reverse and resume growing towards the resistance area. In this case, the upside target will be at 1842.50. At the same time, an opposite scenario implies that the price may continue its decline towards 1765.00 before further growth.

XAUUSD
Risk Warning: the result of previous trading operations do not guarantee the same results in the future

NZDUSD, “New Zealand vs. US Dollar”

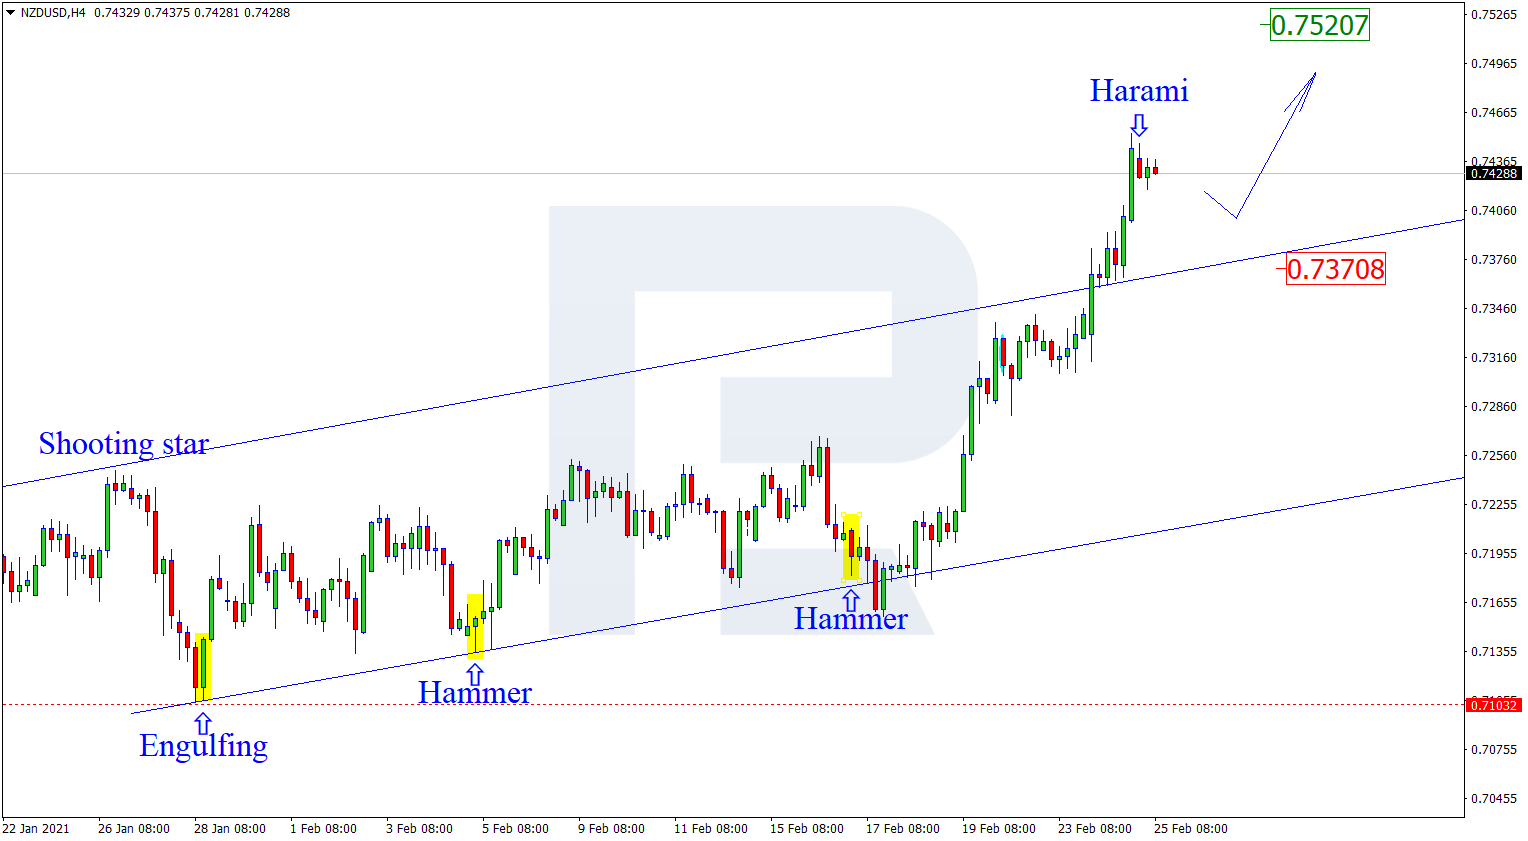
As we can see in the H4 chart, the pair is correcting within the uptrend. By now, NZDUSD has formed several reversal patterns, such as Hammer, close to the support level. The upside target remains at the resistance area at 0.7300. However, an alternative scenario implies that the price may continue the correction towards 0.7170 before resuming the ascending impulse.

NZDUSD
Risk Warning: the result of previous trading operations do not guarantee the same results in the future

GBPUSD, “Great Britain Pound vs US Dollar”

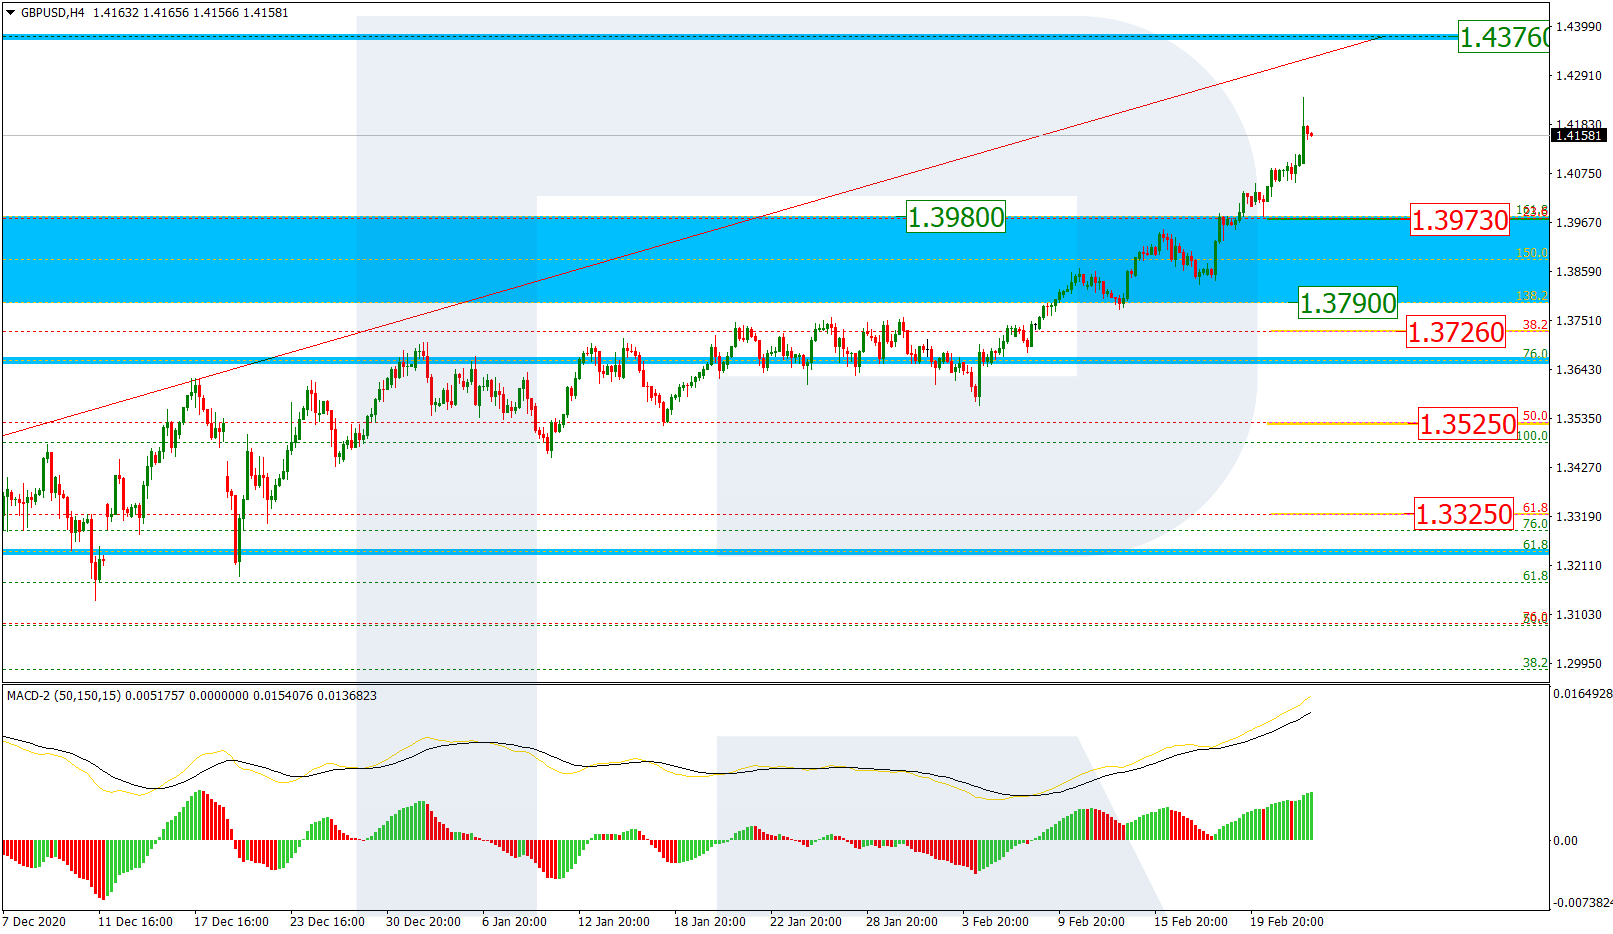
As we can see in the H4 chart, the correctional wave within the uptrend continues. Right now, after forming several reversal patterns, such as Shooting Star, not far from the resistance area, GBPUSD is reversing. In this case, the correctional target is the support level at 1.3795. After that, the instrument may rebound and resume moving upwards to reach the upside target at 1.3980.

GBPUSD

Article By RoboForex.com

Attention!
Forecasts presented in this section only reflect the author’s private opinion and should not be considered as guidance for trading. RoboForex LP bears no responsibility for trading results based on trading recommendations described in these analytical reviews.

Murrey Math Lines 17.02.2021 (USDJPY, USDCAD)

Article By RoboForex.com

USDJPY, “US Dollar vs. Japanese Yen”

As we can see in the H4 chart, after rebounding from the resistance at 8/8, USDJPY is expected to start a new correction to the downside and reach 5/8. However, this scenario may no longer be valid if the price breaks 8/8 to the upside. After that, the instrument may reverse and move upwards to reach the resistance at +1/8.

USDJPY_H4
Risk Warning: the result of previous trading operations do not guarantee the same results in the future

In the M15 chart, the pair may break the downside line of the VoltyChannel indicator and, as a result, continue moving downwards.

USDJPY_M15
Risk Warning: the result of previous trading operations do not guarantee the same results in the future

USDCAD, “US Dollar vs Canadian Dollar”

In the H4 chart, USDCAD is no longer moving within the “oversold area”. In this case, the price is expected to continue growing towards the closest resistance at 1/8. Still, this scenario may no longer be valid if the price breaks 0/8 to the downside. After that, the instrument may reverse and fall to reach the support at -1/8.

USDCAD_H4
Risk Warning: the result of previous trading operations do not guarantee the same results in the future

As we can see in the M15 chart, the pair has broken the upside line of the VoltyChannel indicator and, as a result, may continue trading upwards.

USDCAD_M15

Article By RoboForex.com

Attention!
Forecasts presented in this section only reflect the author’s private opinion and should not be considered as guidance for trading. RoboForex LP bears no responsibility for trading results based on trading recommendations described in these analytical reviews.

The Analytical Overview of the Main Currency Pairs on 2021.02.17

by JustForex

The EUR/USD currency pair

Technical indicators of the currency pair:
  • Prev Open: 1.2128
  • Prev Close: 1.2105
  • % chg. over the last day: -0.19%.

The EUR/USD lost 0.19% intraday amid positive US data. A bearish engulfing candlestick has been formed on the daily chart, which casts doubt on the growth of the pair in the short term. In the credit market, the bond yield spread widened significantly in favor of the US dollar, and the southern pullback may continue for some time.

Trading recommendations
  • Support levels: 1.2081, 1.2059
  • Resistance levels: 1.2155, 1.2189

The main trading scenario for the EUR/USD is trading in a sideways range between 1.2081 – 1.2125. The pair’s decline was stopped near the support level, which allows us to expect another northern bounce. The same is indicated by the ADX, which has reacted very weakly to the southern impulse. At the same time, the position of the MACD and moving averages indicates selling within the range as safer trades.

Alternative scenario: if the price consolidates below the level of 1.2081, the pair may continue to decline to 1.2059. A breakthrough of 1.2125 could bring the pair back to 1.2155.

EUR/USD
News feed for 2021.02.17:
  • – The US Core Retail Sales (m/m) (Jan) at 15:30 (GMT+2);
  • – The Publication of the FOMC minutes at 21:00 (GMT+2).

The GBP/USD currency pair

Technical indicators of the currency pair:
  • Prev Open: 1.3901
  • Prev Close: 1.3898
  • % chg. over the last day: -0.02%

The sterling showed only a symbolic decline after the publication of data in the US on Tuesday. However, the northern trend is slowing down. A doji candlestick has formed on the daily chart, which is a signal of a stop of the movement or a possible price reversal.

Trading recommendations
  • Support levels: 1.3775, 1.3680
  • Resistance levels: 1.3950, 1.4000

The main scenario for the GBP/USD is trading sideways between 1.3860 – 1.3950. On the hourly timeframe, there are signs of the price stopping with the likelihood of further decline. The ADX reacted significantly to the southern impulse on Tuesday, suggesting the emergence of bearish strength in the pair. But until the price breaks below the SMA 100, the pair may remain in the range.

Alternative scenario: if the pair consolidates below 1.3860, it may return to 1.3775. A breakthrough of 1.3950 will resume growth.

GBP/USD
News feed for 2021.02.17:
  • – The UK Consumer Prices Index (CPI) (y/y) (Jan) at 09:00 (GMT+2).

The USD/JPY currency pair

Technical indicators of the currency pair:
  • Prev Open: 105.35
  • Prev Close: 106.03
  • % chg. over the last day: +0.66%

On Tuesday, the dollar-yen pair showed the largest daily gain since January 7. The pair continues to catch up with the stock market, with which it usually correlates to a large extent. The rise in government bond yields is also helping to depreciate the Japanese yen.

Trading recommendations
  • Support levels: 105.10, 104.40
  • Resistance levels: 106.12, 106.55

The main scenario is buying. On Tuesday, northern momentum indicated strengthening bullish pressure. The moving averages show a sharper upward trajectory. But the ADX is already close to the overbought area, which indicates the likelihood of a stop.

An alternative scenario implies the price-fixing below 105.60. In this case, the pair may go for a correction to 105.10.

USD/JPY
News feed for 2021.02.17:
  • – The US Core Retail Sales (m/m) (Jan) at 15:30 (GMT+2);
  • – The Publication of the FOMC minutes at 21:00 (GMT+2).

The USD/CAD currency pair

Technical indicators of the currency pair:
  • Prev Open: 1.2636
  • Prev Close: 1.2686
  • % chg. over the last day: +0.40%

The pair bounced off January lows, pointing to strong support around 1.2590. Corrective growth was supported by positive data in the US and a southern pullback in the oil market. However, there are no fundamental reasons for a price reversal. The growth can still be used to build up short positions.

Trading recommendations
  • Support levels: 1.2590, 1.2550
  • Resistance levels: 1.2763, 1.2781

The main scenario is buying. The ADX and the MACD have sharply changed the position. The potential trend has reversed to the north and indicates an upward direction as true. As long as the price is above the moving averages, growth may continue but will be limited by the first resistance level. The south trend can be expected to resume at any moment.

Alternative scenario: if the price manages to consolidate below 1.2679, the pair may resume its decline to the level of 1.2590.

USD/CAD
News feed for 2021.02.17:
  • – The US Core Retail Sales (m/m) (Jan) at 15:30 (GMT+2);
  • – The Canada Core Consumer Price Index (CPI) (m/m) (Jan) at 15:30 (GMT+2);
  • – The Publication of the FOMC minutes at 21:00 (GMT+2).

by JustForex


This article reflects a personal opinion and should not be interpreted as an investment advice, and/or offer, and/or a persistent request for carrying out financial transactions, and/or a guarantee, and/or a forecast of future events.

The stock market backed down from the highs.The dollar strengthened after the data of the manufacturing sector of New York state

by JustForex

The global rally of equities discontinued on Tuesday, despite the continued growth in bond yields. The strategists of large banks have a suspicion that a correction in risky assets is approaching. For example, Citigroup expects a 10% pullback in US stocks, which seems highly probable as the markets are balanced on a risk-reward basis.

But no one expects a sharp fall. The market continues to remain optimistic, as the economy is gradually emerging from the recession, and the soft monetary policy will support bulls on the stock markets for at least another year.

The positive data from the US manufacturing sector continue to be received. The NY Empire State Manufacturing Index increased the most in February in five months to 12.1 from 3.5 a month earlier. This was mainly due to the rise in prices for raw materials from 12.3 to 57.8. The Producer Price Index increased by 8.2 to 23.4, both values are the highest since May 2011. More and more manufacturers expect higher raw material costs and the continued growth in producer prices over the next six months. In addition, new orders increased from 6.6 to 10.8 and the employment rate increased slightly too. Optimism about economic conditions in the next six months among manufacturers increased to 34.9 from 31.9 earlier.

Against this background, the American dollar moved to strengthening. Treasury yields were at their highest level since February last year, reaching 1.33%.

There is also positive data from Germany. The ZEW Indicator of Economic Sentiment increased by 9.4 points this month reaching 71.2 compared to the previous month, well above market forecasts. This is the highest indicator since September as markets are optimistic about the future of the German economy, which is expected to return to growth over the next six months. In particular, a significant recovery in consumption and retail trade is expected, accompanied by higher inflationary expectations. But at the same time, the index of current conditions fell to -67.2 from -66.4, indicating a slow recovery at the beginning of the year.

Main market quotes:

S&P 500 (F) 3,928.12 +0.37 (+0.01%)

Dow Jones 31,522.75 +64.35 (+0.20%)

DAX 14,018.55 -46.05 (-0.33%)

FTSE 100 6,728.85 -20.01 (-0.30%)

USD Index 90.737 +0.234 (+0.26%)

Important events:
  • – UK Consumer Price Index (y/y) (Jan) at 09:00 (GMT+2);
  • – US Core Retail Sales (m/m) (Jan) at 15:30 (GMT+2);
  • – Canada Core Consumer Price Index m/m) (Jan) at 15:30 (GMT+2);
  • – Publication of the FOMC minutes at 21:00 (GMT+2).

by JustForex


This article reflects a personal opinion and should not be interpreted as an investment advice, and/or offer, and/or a persistent request for carrying out financial transactions, and/or a guarantee, and/or a forecast of future events.