Archive for Forex and Currency News – Page 282

Technical Outlook: Yen Crosses Under the Spotlight

By Lukman Otunuga Research Analyst, ForexTime

A sense of caution enveloped financial markets on Tuesday amid reports of military tensions between China and Taiwan. The negative mood weighed on global equities while boosting appetite for safe-haven currencies.

Our currency spotlight shines on the Japanese Yen which has appreciated against most G10 currencies today.

Yen bulls could remain in the scene if U.S. Treasury yields decline further.

USDJPY blocked below 109.686?

It was not only the Japanese Yen that derived strength from the market caution. The Dollar has also dominated the G10 space today, appreciating against major peers including the Yen.

Given how the risk-off sentiment is supporting both currencies, a technical move could be needed to determine the USDJPY’s near-term outlook. There seems to be some layers of resistance around the 109.686 and 109.30 regions. Sustained weakness below these levels could encourage a decline towards 108.30 and possibly lower.

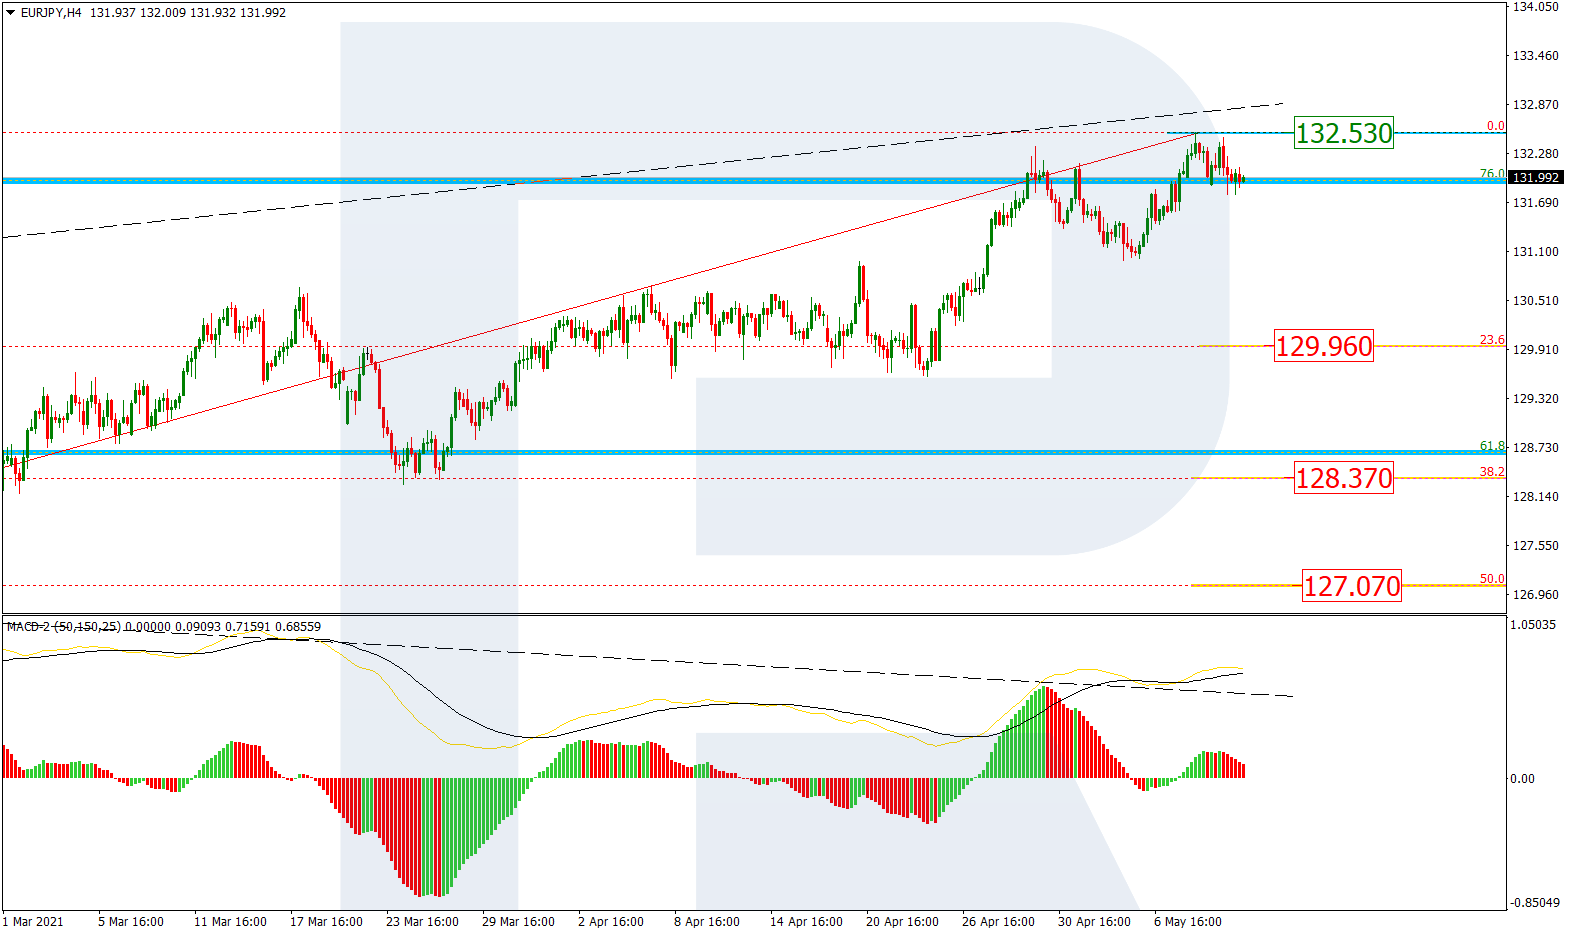
EURJPY: Technical pullback or start of a downtrend?

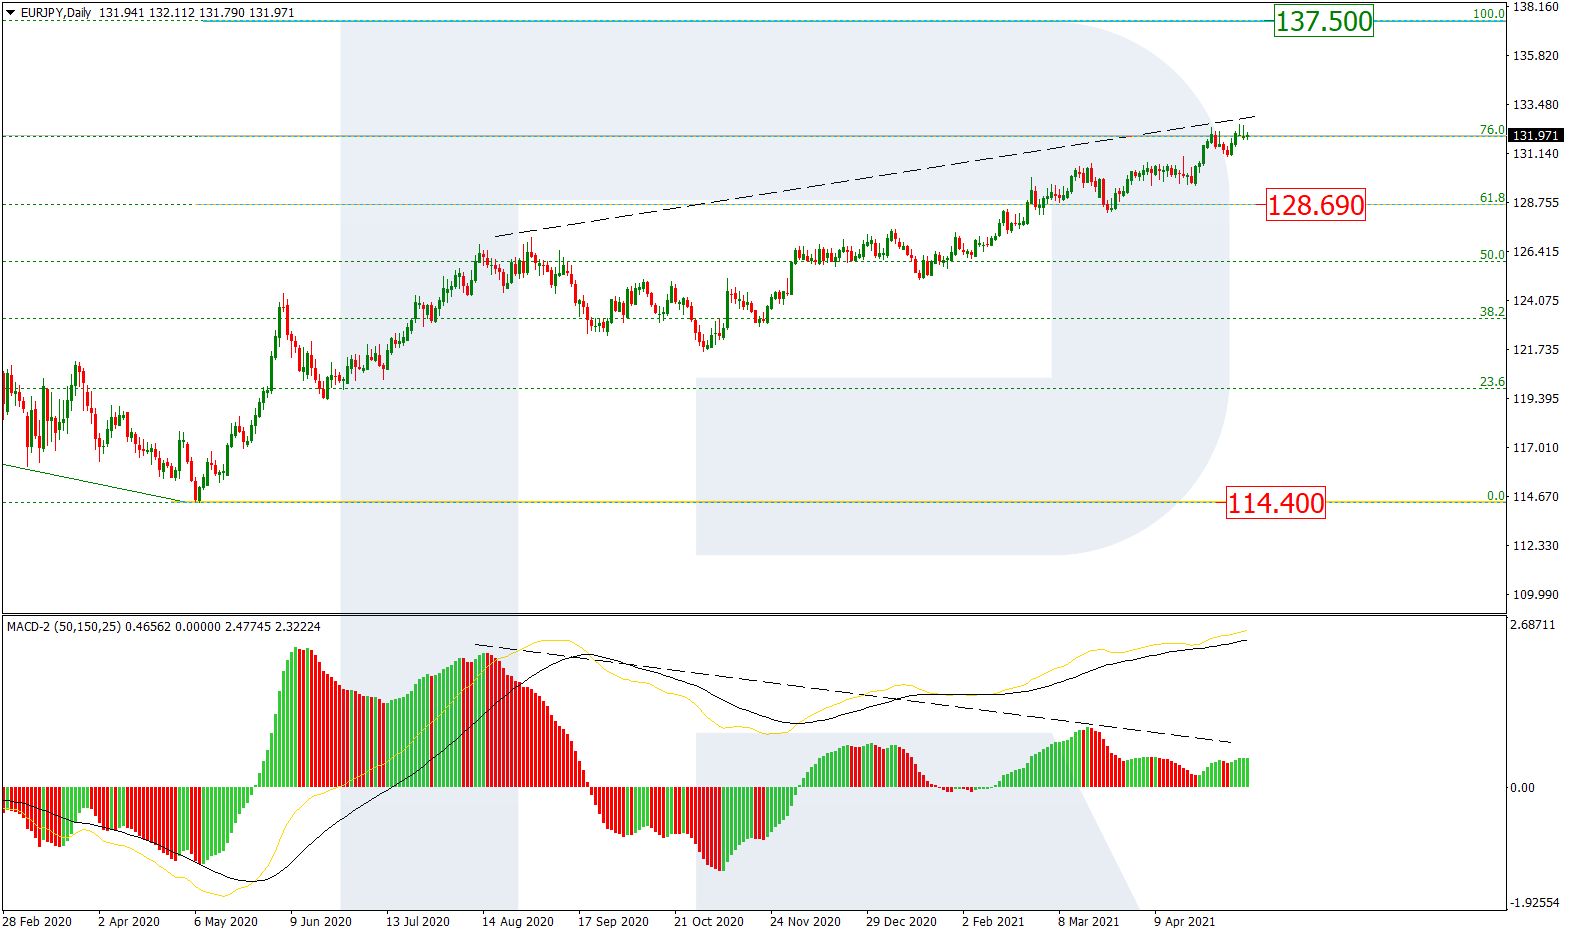
Taking a look at the technical picture, the EURJPY is heavily bullish on the daily charts. There have been consistently higher highs and higher lows while the MACD is trading comfortably above 0.

A technical pullback is in the works with 130.60 acting as potential dynamic support for bulls to push prices back higher. However, if this level proves to be unreliable support, a decline back towards 129.70 could be on the cards. Such a move may threaten the current uptrend and invite bears back into the game.

GBPJPY breakout on the horizon?

The currency pair has formed a symmetrical triangle pattern on the daily charts. This pattern either signals a continuation of the current trend or the start of a new trend in the opposite direction.

Given how prices are trading above both the 50-day and 100-day Simple Moving Average, the technicals swing in favour of bulls. However, an appreciating Japanese Yen could throw a proverbial wrench in the works, opening the doors for bears. A breakdown below the 50-day Simple Moving Average could result in a sell-off towards 148.50. If this level is cracked, the GBPJPY will turn bearish on the daily charts. Alternatively, a strong move back above 153.40 will most likely signal further upside.

Disclaimer: The content in this article comprises personal opinions and should not be construed as containing personal and/or other investment advice and/or an offer of and/or solicitation for any transactions in financial instruments and/or a guarantee and/or prediction of future performance. ForexTime (FXTM), its affiliates, agents, directors, officers or employees do not guarantee the accuracy, validity, timeliness or completeness, of any information or data made available and assume no liability as to any loss arising from any investment based on the same.


Forex-Time-LogoArticle by ForexTime

ForexTime Ltd (FXTM) is an award winning international online forex broker regulated by CySEC 185/12 www.forextime.com

Japanese Candlesticks Analysis 04.05.2021 (XAUUSD, NZDUSD, GBPUSD)

Article By RoboForex.com

XAUUSD, “Gold vs US Dollar”

As we can see in the H4 chart, the instrument is forming another correction. After forming several reversal patterns, such as Shooting Star, close to the resistance level, XAUUSD is reversing. In this case, the correctional target may be the support area at 1770.00. At the same time, an opposite scenario implies that the price may grow to reach 1815.00 without testing the support level.

XAUUSD
Risk Warning: the result of previous trading operations do not guarantee the same results in the future

NZDUSD, “New Zealand vs US Dollar”

As we can see in the H4 chart, the correction continues. By now, NZDUSD has formed several reversal patterns, such as Shooting Star, close to the resistance level. The pattern materialization target may be at 0.7125. Later, the price may test the support area, rebound from it, and resume moving upwards. However, an alternative scenario implies that the price may continue growing towards 0.7270 without testing the support level.

NZDUSD
Risk Warning: the result of previous trading operations do not guarantee the same results in the future

GBPUSD, “Great Britain Pound vs US Dollar”

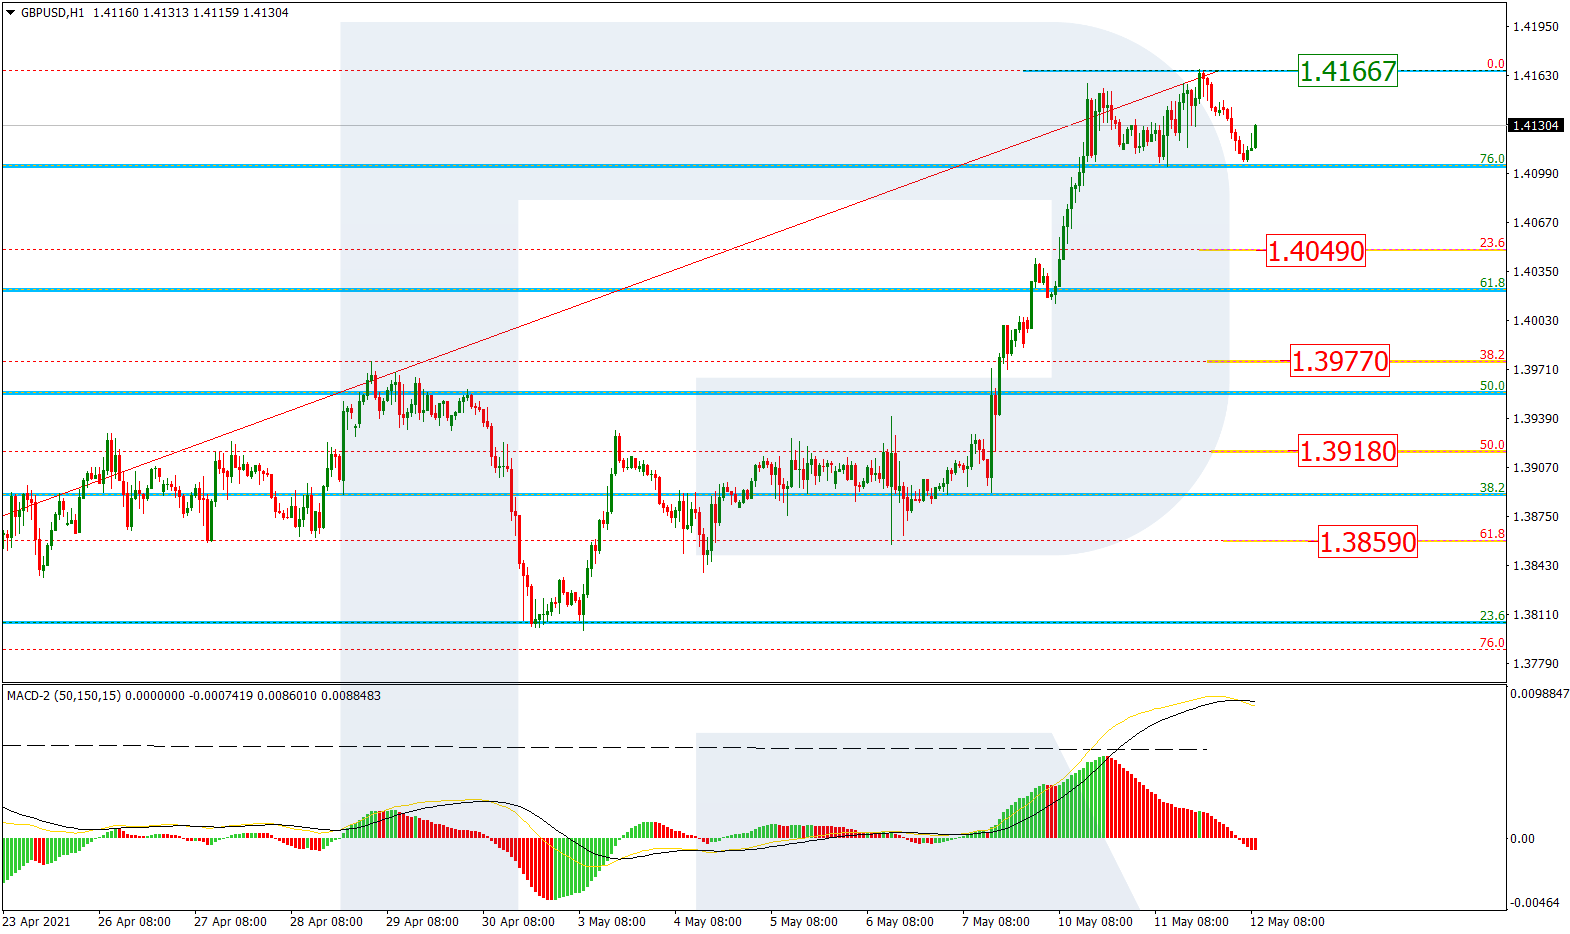
As we can see in the H4 chart, the asset is still correcting within the ascending tendency. By now, GBPUSD has formed several reversal patterns, such as Hammer, not far from the support area. At the moment, the pair is reversing in favor of further growth. In this case, the upside target may be at 1.3970. After that, the instrument may break the resistance area and boost the ascending tendency. Still, there might be an alternative scenario, according to which the asset may continue falling towards 1.3827 before resuming the ascending tendency.

GBPUSD

Article By RoboForex.com

Attention!
Forecasts presented in this section only reflect the author’s private opinion and should not be considered as guidance for trading. RoboForex LP bears no responsibility for trading results based on trading recommendations described in these analytical reviews.

Ichimoku Cloud Analysis 04.05.2021 (BRENT, AUDNZD, NZDUSD)

Article By RoboForex.com

BRENT

Brent is trading at 67.39; the instrument is moving above Ichimoku Cloud, thus indicating an ascending tendency. The markets could indicate that the price may test the cloud’s upside border at 65.95 and then resume moving upwards to reach 72.45. Another signal in favor of a further uptrend will be a rebound from the rising channel’s downside border. However, the bullish scenario may no longer be valid if the price breaks the cloud’s downside border and fixes below 64.35. In this case, the pair may continue falling towards 60.65.

BRENT
Risk Warning: the result of previous trading operations do not guarantee the same results in the future

AUDNZD, “Australian Dollar vs New Zealand Dollar”

AUDNZD is trading at 1.0802; the instrument is moving above Ichimoku Cloud, thus indicating an ascending tendency. The markets could indicate that the price may test the cloud’s upside border at 1.0770 and then resume moving upwards to reach 1.0895. Another signal in favor of a further uptrend will be a rebound from the descending channel’s upside border. However, the bullish scenario may no longer be valid if the price breaks the cloud’s downside border and fixes below 1.0705. In this case, the pair may continue falling towards 1.0605.

AUDNZD
Risk Warning: the result of previous trading operations do not guarantee the same results in the future

NZDUSD, “New Zealand Dollar vs US Dollar”

NZDUSD is trading at 0.7170; the instrument is moving below Ichimoku Cloud, thus indicating a descending tendency. The markets could indicate that the price may test the cloud’s downside border at 0.7205 and then resume moving downwards to reach 0.6995. Another signal in favor of a further downtrend will be a rebound from the rising channel’s downside border. However, the bearish scenario may be canceled if the price breaks the cloud’s upside border and fixes above 0.7265. In this case, the pair may continue growing towards 0.7355. To confirm further decline, the asset must break the support level and fix below 0.7120 to complete the Head & Shoulders reversal pattern.

NZDUSD

Article By RoboForex.com

Attention!
Forecasts presented in this section only reflect the author’s private opinion and should not be considered as guidance for trading. RoboForex LP bears no responsibility for trading results based on trading recommendations described in these analytical reviews.

The Analytical Overview of the Main Currency Pairs on 2021.05.04

by JustForex

The EUR/USD currency pair

Technical indicators of the currency pair:
  • Prev Open: 1.2027
  • Prev Close: 1.2062
  • % chg. over the last day: +0.29%

After Friday’s sharp drop, Monday was relatively calm for the EUR/USD currency pair. As a result, the price slightly recovered its positions and closed near moving average at the end of the trading session.

Trading recommendations
  • Support levels: 1.2021, 1.1957, 1.1835
  • Resistance levels: 1.2074, 1.2108, 1.2145, 1.2176, 1.2212, 1.2243

The MACD indicator quickly returned to zero marks, where it was on Friday before the fall. But the price returned only to the middle of the movement. Indicates a weakness of the buyers, so the most reasonable thing on the EUR/USD pair is to look for sell trades from the nearest resistance levels. But negative statistics are expected on the U.S. trade balance today, which might push the euro a little higher.

Alternative scenario: if the price breaks up through the 1.2108 level and holds above, the general uptrend will continue with a high probability.

News feed for 2021.05.04:
  • – US Trade Balance (m/m) at 15:30 (GMT+3).

The GBP/USD currency pair

Technical indicators of the currency pair:
  • Prev Open: 1.3807
  • Prev Close: 1.3907
  • % chg. over the last day: +0.72%

Despite the bank holiday in the U.K. on Monday, the GBP/USD currency pair rose by 100 pips. The price broke through and held above the moving average, but it failed to break out the 1.3913 level at the first attempt.

Trading recommendations
  • Support levels: 1.3864, 1.3835, 1.3801, 1.3756, 1.3690
  • Resistance levels: 1.3913, 1.3996, 1.4149

Sellers need to hold the 1.3913 resistance level to remain in the local downtrend. But given that the up movement to the resistance level was by impulse candlesticks, it is likely that the buyers will retake control.

Alternative scenario: if the price breaks up through the 1.3913 resistance level and holds above, the bullish scenario will become active again with a high probability.

There is no news feed for today.

The USD/JPY currency pair

Technical indicators of the currency pair:
  • Prev Open: 109.24
  • Prev Close: 109.06
  • % chg. over the last day: -0.16%

On Monday, the currency pair USD/JPY fell by fast impulse. Last days MACD was actively showing the divergence. Also, the price strongly deviated from the moving average, so this correction was not a surprise.

Trading recommendations
  • Support levels: 108.87, 108.44, 108.19,107.77, 107.47, 107.04
  • Resistance levels: 109.23, 109.64, 109.95, 110.51

MACD went into the negative area, but the price is still above the moving average. Therefore, the best strategy for USD/JPY will be looking for purchases from the nearest support levels.

Alternative scenario: if the price drops below 108.44, the general downtrend will continue with a high probability.

There is no news feed for today.

The USD/CAD currency pair

Technical indicators of the currency pair:
  • Prev Open: 1.2286
  • Prev Close: 1.2275
  • % chg. over the last day: -0.09%

The USD/CAD currency pair continues to trade in a narrow range. The support level of 1.2280 is no longer relevant, the support level of 1.2270 instead of it. MACD indicator continues to show a divergence.

Trading recommendations
  • Support levels: 1.2270, 1.2165
  • Resistance levels: 1.2321, 1.2388, 1.2414, 1.2519, 1.2618

The trend remains bearish, so it is most reasonable to look for sell trades from the resistance levels. The entry price is not the most optimal now, so it is better to wait for a rebound or look for purchases within the intraday uptrend.

Alternative scenario: if the price breaks through the 1.2414 resistance level and holds above, a local corrective uptrend will be formed with a high probability.

News feed for 2021.05.04:
  • – Canadian Trade Balance (m/m) at 15:30 (GMT+3).

by JustForex


This article reflects a personal opinion and should not be interpreted as an investment advice, and/or offer, and/or a persistent request for carrying out financial transactions, and/or a guarantee, and/or a forecast of future events.

The U.S. stock market showed multidirectional dynamics of the main indices.

by JustForex

The Dow Jones index closed higher Monday based on signs of a faster economic recovery which pushed up several sectors, including energy, health care, and commodities.

The Dow Jones Industrial Average rose by +0.70%, the S&P 500  was up by +0.27%, and the Nasdaq Composite was down by -0.44%.

European stock prices rose slightly on Monday despite the negative statistical data on the Manufacturing PMI in European countries.

The energy market boomed yesterday thanks to rising oil prices as investors once again expect a recovery in oil demand, despite the continuing rise in Covid-19 cases in India.

Gold fell Tuesday morning in Asia after hitting a more than two-month high in the previous session as the dollar strengthened and investors discussed U.S. Federal Reserve Chairman Jerome Powell’s optimistic comments about the economic recovery.

By the start of the Asian session, MSCI Asia-Pacific’s broadest index of stocks was up just by +0.15%, amid holidays in China and Japan, with volatility remaining low.

Main market quotes:

S&P 500 (F) 4,192.66 +11.49 (+0.27%)

Dow Jones 34,113.23 +238.38 (+0.70%)

DAX 15,236.47 +100.56 (+0.66%)

FTSE 100 6,969.81 0 (0%)

USD Index 90.96 -0.33 (-0.33%)

Important events:
  • – US Trade Balance (m/m) at 15:30 (GMT+3);
  • – Canadian Trade Balance (m/m) at 15:30 (GMT+3).

by JustForex


This article reflects a personal opinion and should not be interpreted as an investment advice, and/or offer, and/or a persistent request for carrying out financial transactions, and/or a guarantee, and/or a forecast of future events.

Dollar to be weighed down by dovish Fed

By Han Tan Market Analyst, ForexTime

The dollar index (DXY) yesterday pared some of Friday’s gains, dipping below the psychological 91 mark before resurfacing.

The dollar’s declines come as Fed Chair Jerome Powell reminded markets that the US economic recovery needs to be more equitable, with almost 1 out of every 5 of the lowest-paid workers in America still unemployed since the pandemic broke out over a year ago. Powell’s comments prompted some segments of the markets to walk back expectations that the Fed could start removing its support for financial markets sooner than expected. The benchmark 10-year Treasury yields moderated back below the psychologically-important 1.60% mark on Monday, which in turn prompted a softening of the dollar.

Monday’s lower-than-expected readings for the final Markit US manufacturing PMI and the ISM manufacturing print, which registered 60.5 and 60.7 respectively, also underwhelmed dollar bulls. Compare the US data points against the latest economic indicators out of Europe on Monday. Germany’s March retail sales far exceeded market expectations, while the Markit Eurozone manufacturing PMI posted a record high.

Noting that the euro accounts for 57.6% of the DXY, the euro’s gains against the dollar heaped downward pressure on the dollar index. EURUSD is currently testing its 100-day moving average for support.


Meanwhile, despite the Pound’s climb yesterday, GBPUSD remains very much rangebound, with the 1.40 psychological level proving a tough nut to crack. With markets expecting a 60.7 print for the UK’s Markit manufacturing PMI announcement later today, a positive surprise could help lift Sterling higher. The Pound accounts for 11.9% of the DXY, hence Sterling gains tend to exert downward pressure on the DXY.


The buck has clearly started off the new month on the back foot against its G10 peers, and could continue being weighed down by dovish Fed commentary.

The slate of speeches by Fed officials over the coming days could force further moves in the greenback:

Tuesday, May 4

  • San Fran. Fed President Mary Daly
  • Minneapolis Fed President Neel Kashkari

Wednesday, May 5

  • Chicago Fed President Charles Evans
  • Cleveland Fed President Loretta Mester

Thursday, May 6

  • Dallas Fed President Robert Kaplan
  • Cleveland Fed President Loretta Mester


The far-reaching impact of the Fed’s next policy move extends beyond major currencies. US stocks have also been swaying to such shifts in market expectations.

On Monday, the reflation trade made its presence known, with the Dow Jones Industrial Average gaining 0.7% while the Nasdaq 100 fell by about 0.5%.

Investors bought up stocks in sectors that stand to benefit from the US economic reopening, such as energy, materials and industrials. Meanwhile, the S&P 500’s consumer discretionary sector was weighed down by the likes of Amazon and Tesla, as investors shy away from these pandemic-era darlings.

As long as market participants continue pinning their hopes on the global vaccination drive that is set to bring the world out of the pandemic, and worry less about the nagging concerns in the likes of India and Southeast Asia, that could ensure more legs for the reflation trade. As such, the tech-heavy Nasdaq 100 could underperform in the interim, with the index still trying to shed its tag of having too-rich valuations.

At the time of writing, the futures contracts for all 3 major US benchmark indices are in the red, suggesting declines at Tuesday’s market open, should this trend persist until then.


Forex-Time-LogoArticle by ForexTime

ForexTime Ltd (FXTM) is an award winning international online forex broker regulated by CySEC 185/12 www.forextime.com

Fibonacci Retracements Analysis 03.05.2021 (GOLD, USDCHF)

Article By RoboForex.com

XAUUSD, “Gold vs US Dollar”

As we can see in the H4 chart, a local divergence on MACD made XAUUSD complete the ascending wave at 38.2% fibo and start a new pullback to the downside. After the pullback is over, the rising dynamics may resume towards 50.0%, 61.8%, and 76.0% fibo at 1818.15, 1851.32, and 1891.40 respectively. The scenario that implies a further downtrend towards the low at 1676.78 is very unlikely.

GOLD_H4
Risk Warning: the result of previous trading operations do not guarantee the same results in the future

In the H1 chart, a convergence on MACD made the pair stop the correctional downtrend at 50.0% fibo and start a new growth. There is a possibility of another descending impulse towards 61.8% fibo at 1752.00 but the key scenario implies a further uptrend to reach the current high at 1797.87.

GOLD_H1
Risk Warning: the result of previous trading operations do not guarantee the same results in the future

USDCHF, “US Dollar vs Swiss Franc”

In the H4 chart, a convergence on MACD made the pair stop at 61.8% fibo and start a new ascending wave towards the high at 0.9473. Another scenario suggests one more decline to reach 76.0% fibo at 0.9015 but it is very unlikely.

USDCHF_H4
Risk Warning: the result of previous trading operations do not guarantee the same results in the future

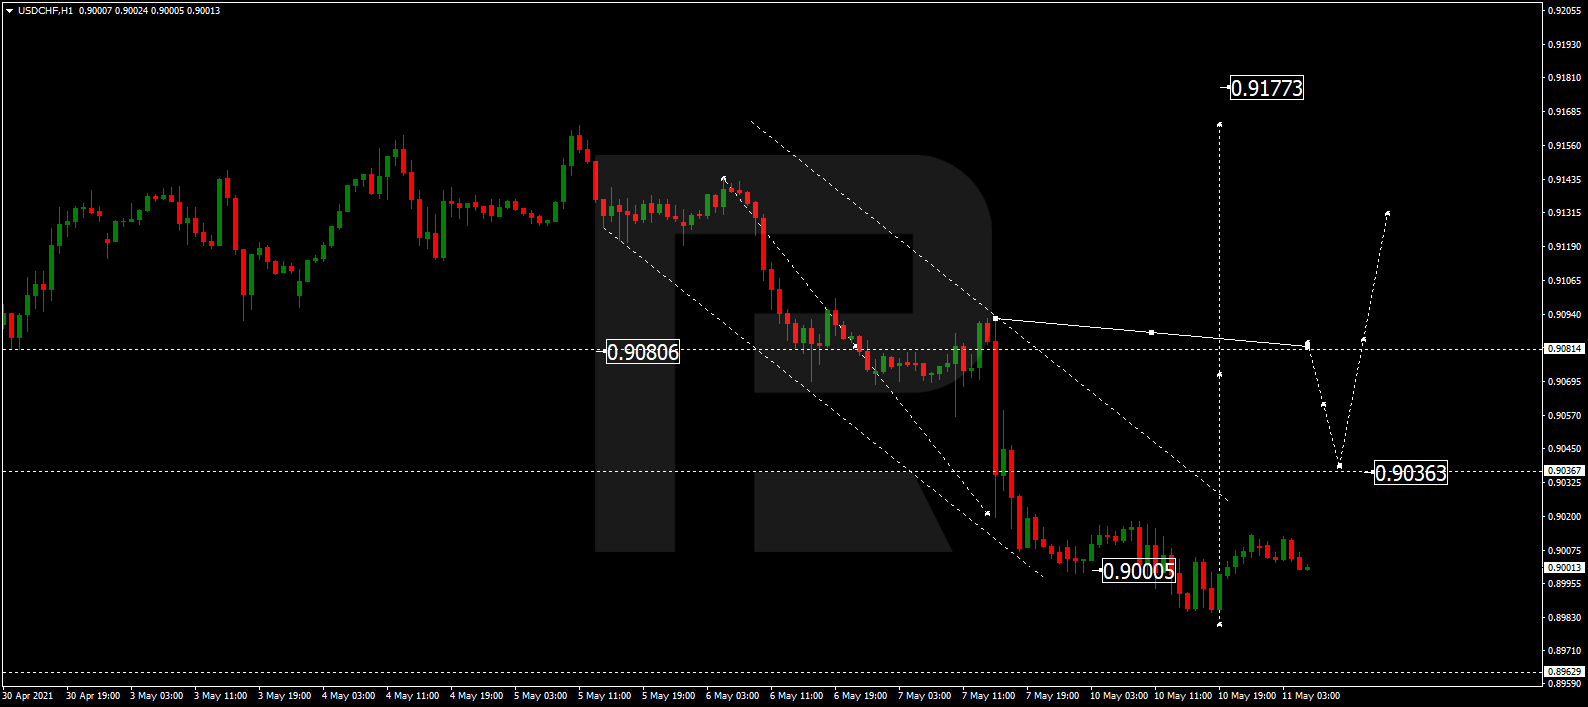
The H1 chart shows potential short-term upside targets after a convergence on MACD – 23.6%, 38.2%, and 50.0% fibo at 0.9173, 0.9230, and 0.9277 respectively. The local support is the low at 0.9080.

USDCHF_H1

Article By RoboForex.com

Attention!
Forecasts presented in this section only reflect the author’s private opinion and should not be considered as guidance for trading. RoboForex LP bears no responsibility for trading results based on trading recommendations described in these analytical reviews.

Forex Technical Analysis & Forecast for May 2021

Article By RoboForex.com

EURUSD, “Euro vs US Dollar”

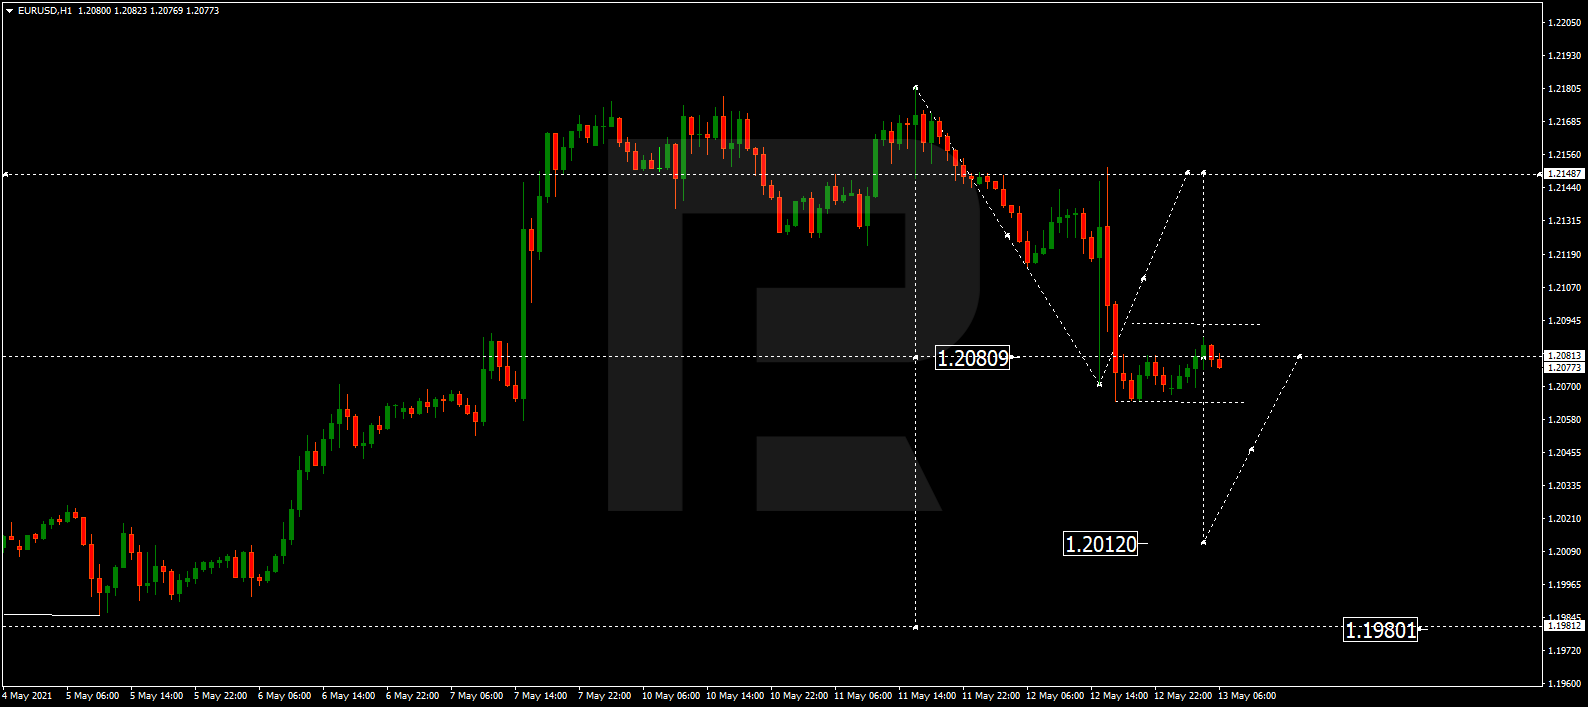
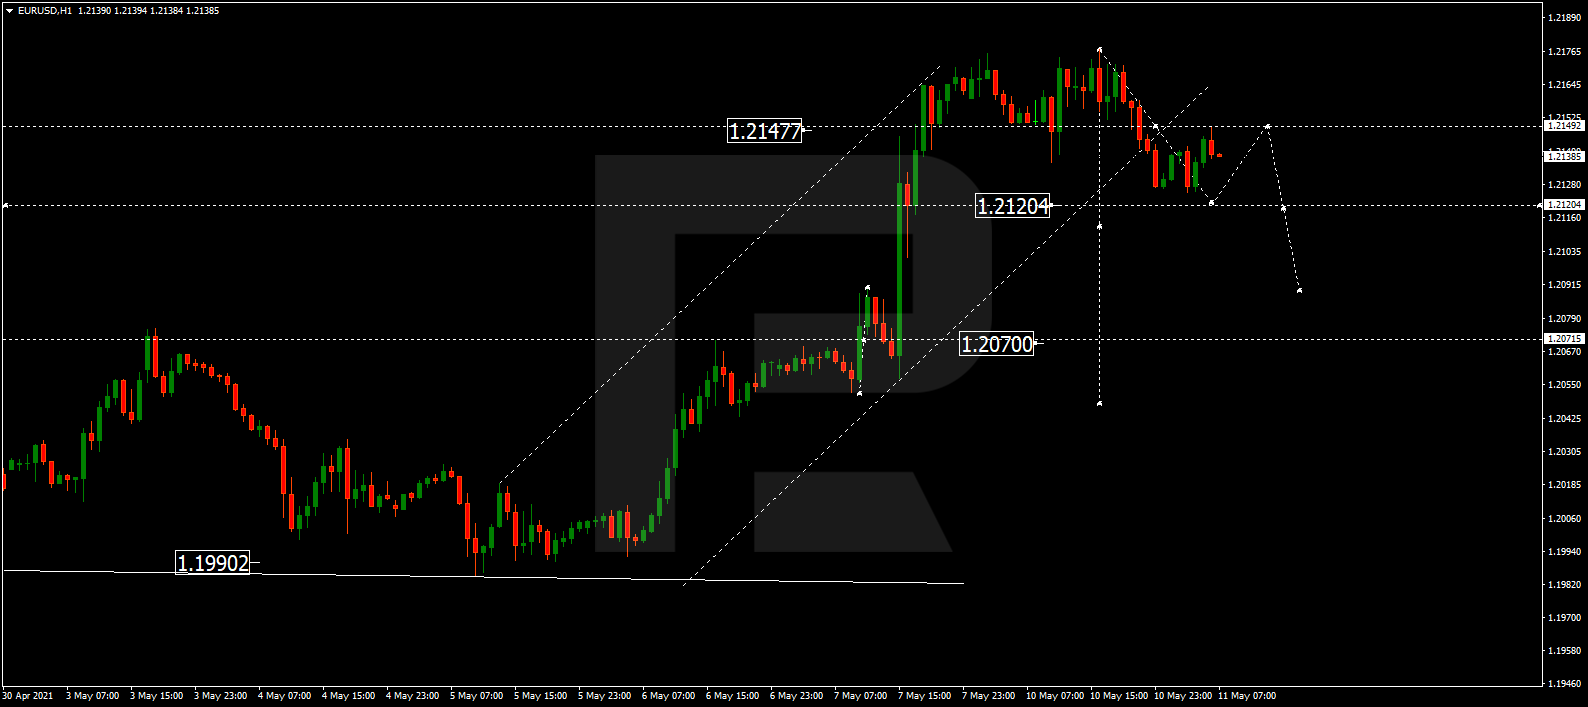
As we can see in the daily chart, after finishing the correction at 1.2150, EURUSD is expected to form a new descending wave towards 1.1600; right now, it is forming the first impulse of this wave to reach 1.1860. Possibly, the pair may form a downside continuation pattern around this level.

EURUSD
Risk Warning: the result of previous trading operations do not guarantee the same results in the future

GBPUSD, “Great Britain Pound vs US Dollar”

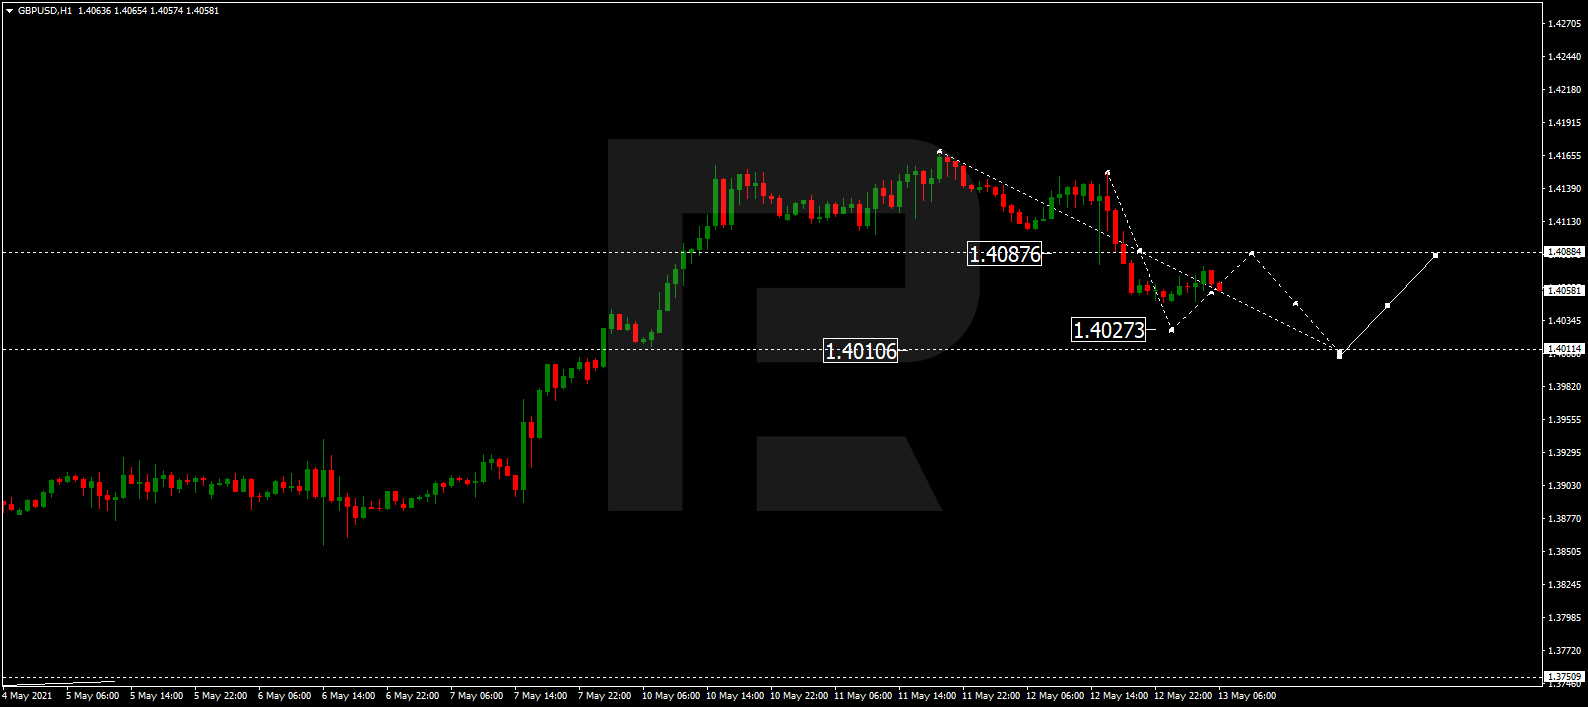
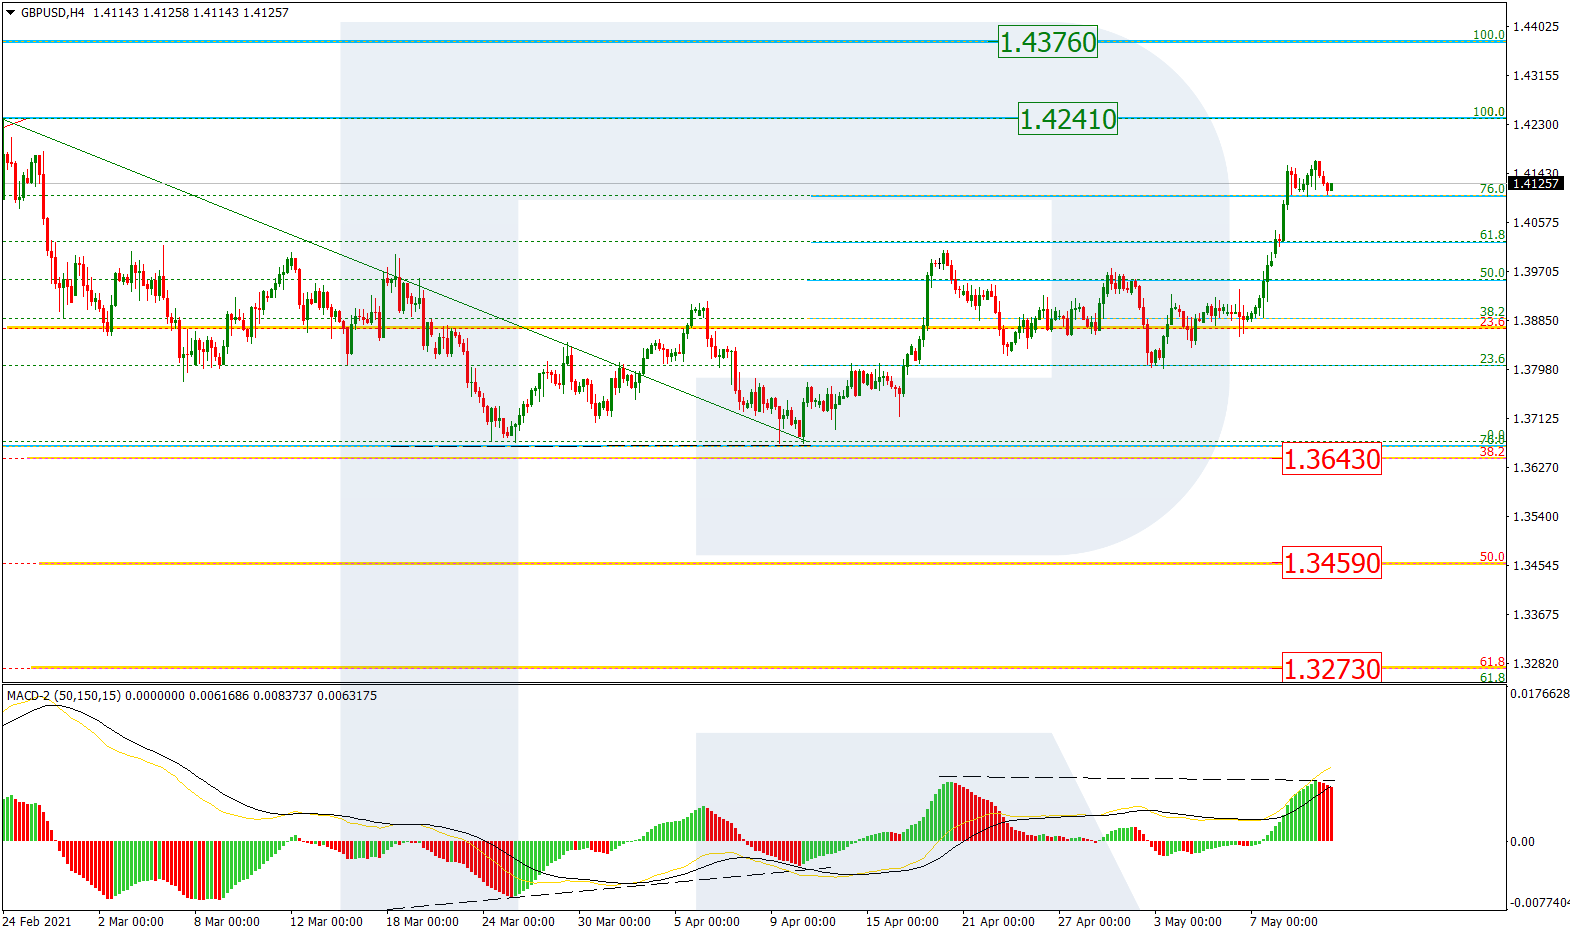
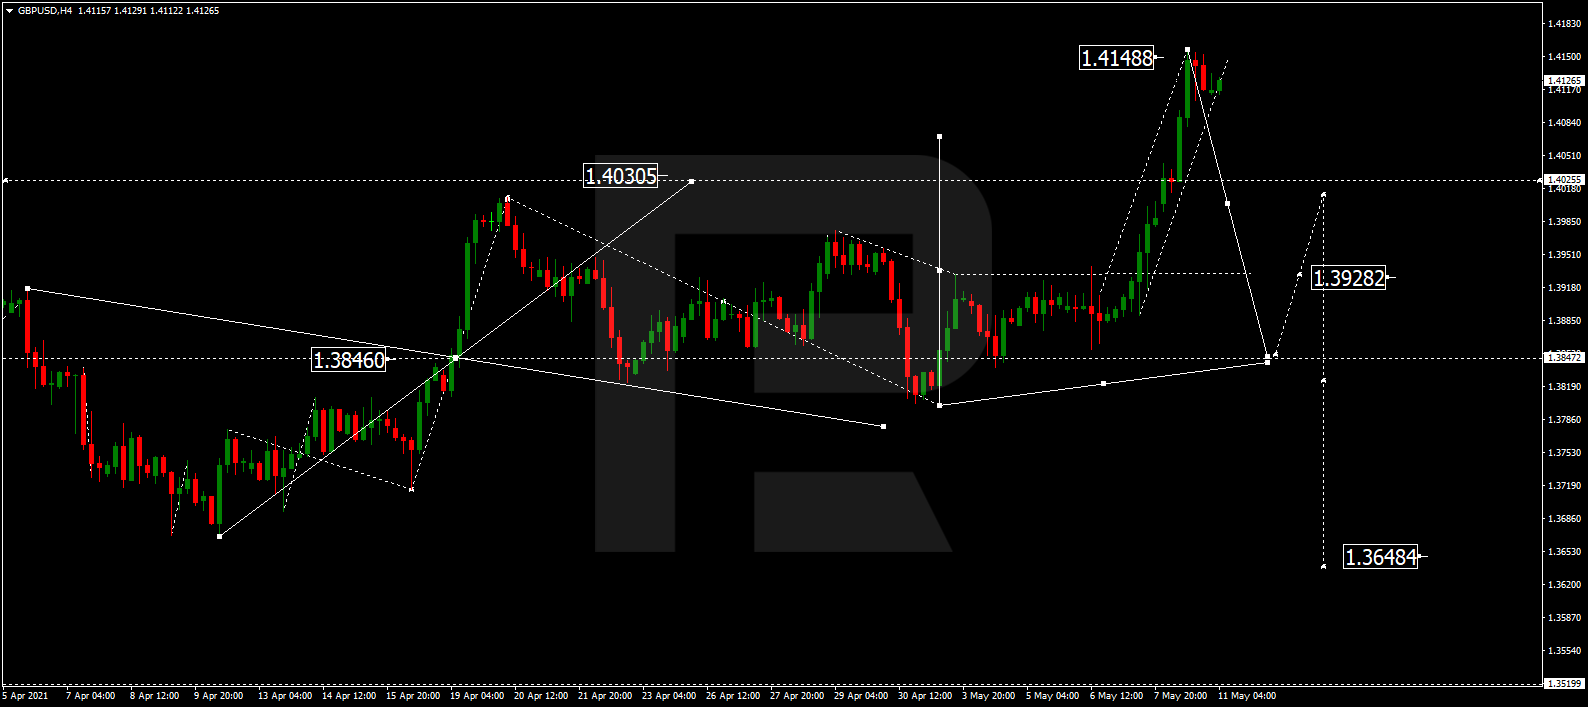
In the daily chart, after completing another descending impulse at 1.3800 along with the correction towards 1.4000, GBPUSD is expected to form a new descending wave with the target at 1.3710. Possibly, the pair may reach it and then form a downside continuation pattern towards 1.3450.

GBPUSD
Risk Warning: the result of previous trading operations do not guarantee the same results in the future

USDRUB, “US Dollar vs Russian Ruble”

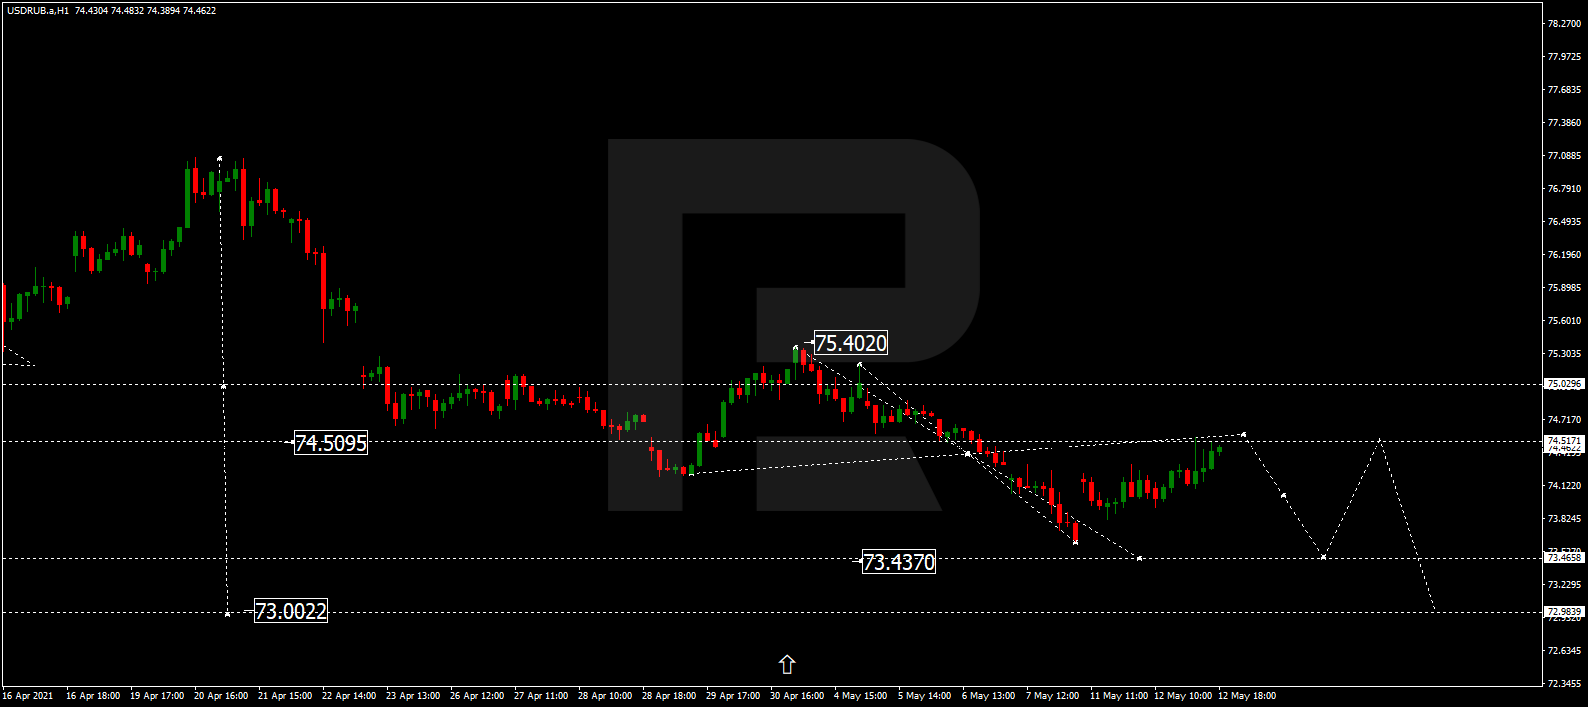
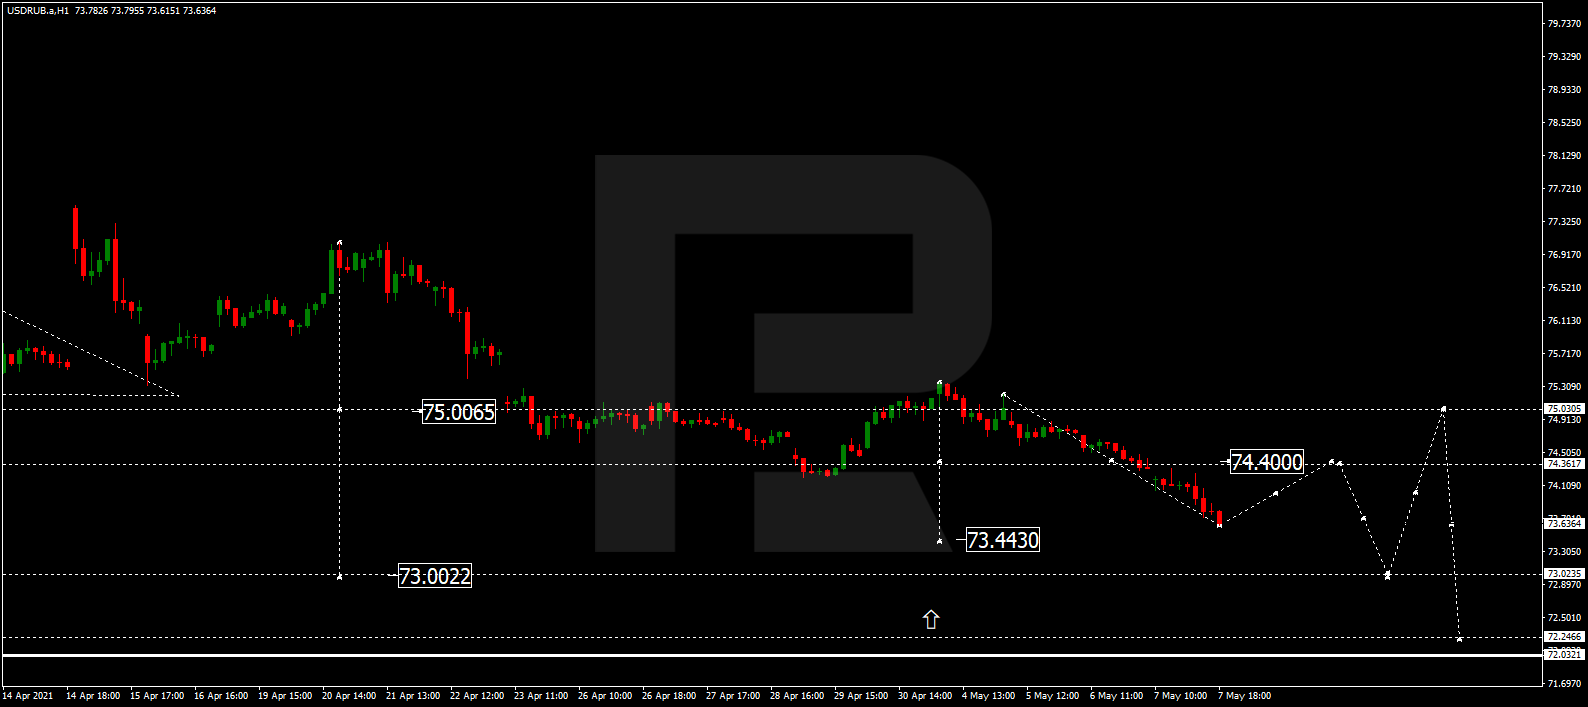
As we can see in the daily chart, after finishing the descending wave at 75.00, USDRUB is forming a wide consolidation range around this level. Possibly, the pair may break this range to the upside and correct towards 76.40. After that, the instrument may start a new decline with the short-term target at 73.00. Later, the market may resume growing to test 75.00 from below and then form one more descending wave with the first target at 72.00.

USDRUB
Risk Warning: the result of previous trading operations do not guarantee the same results in the future

USDJPY, “US Dollar vs Japanese Yen”

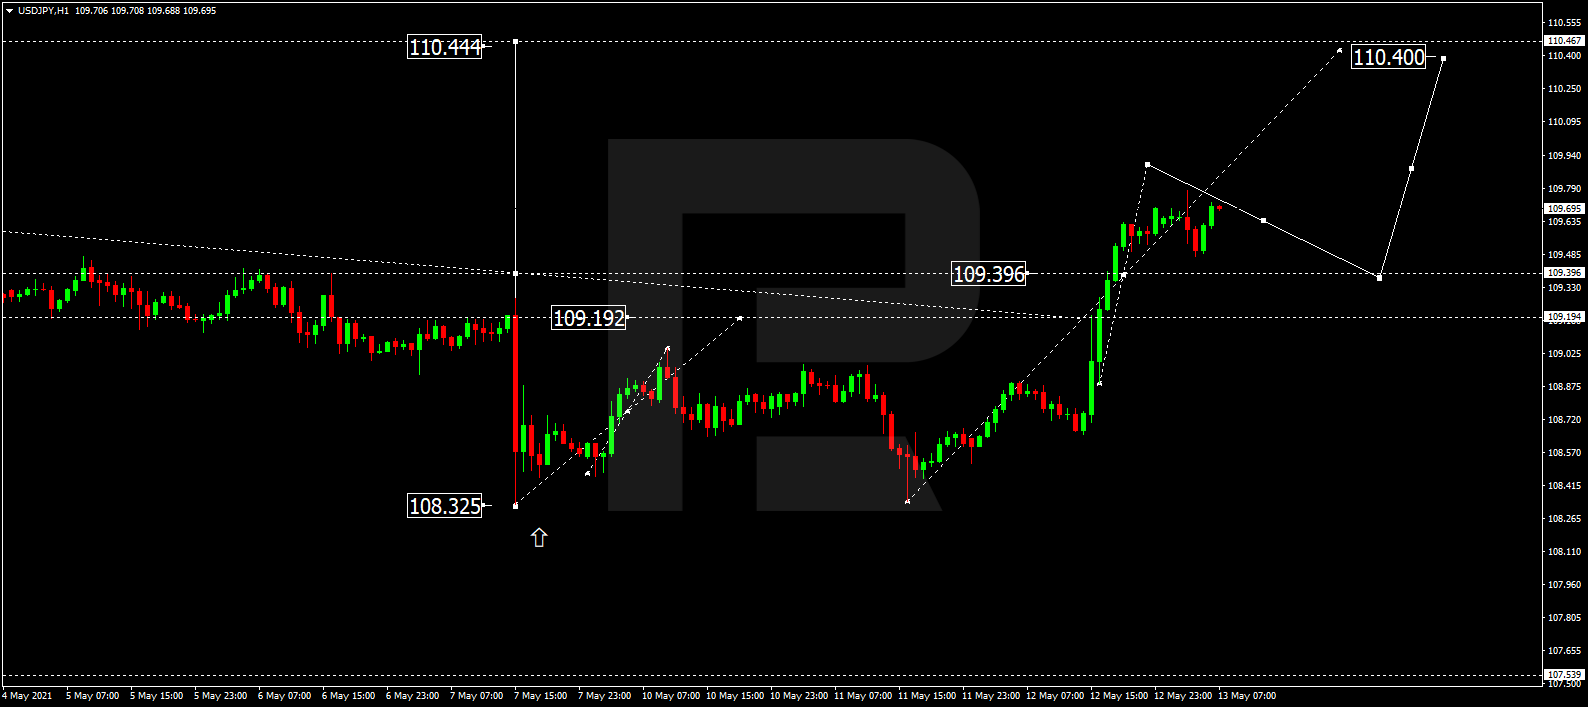
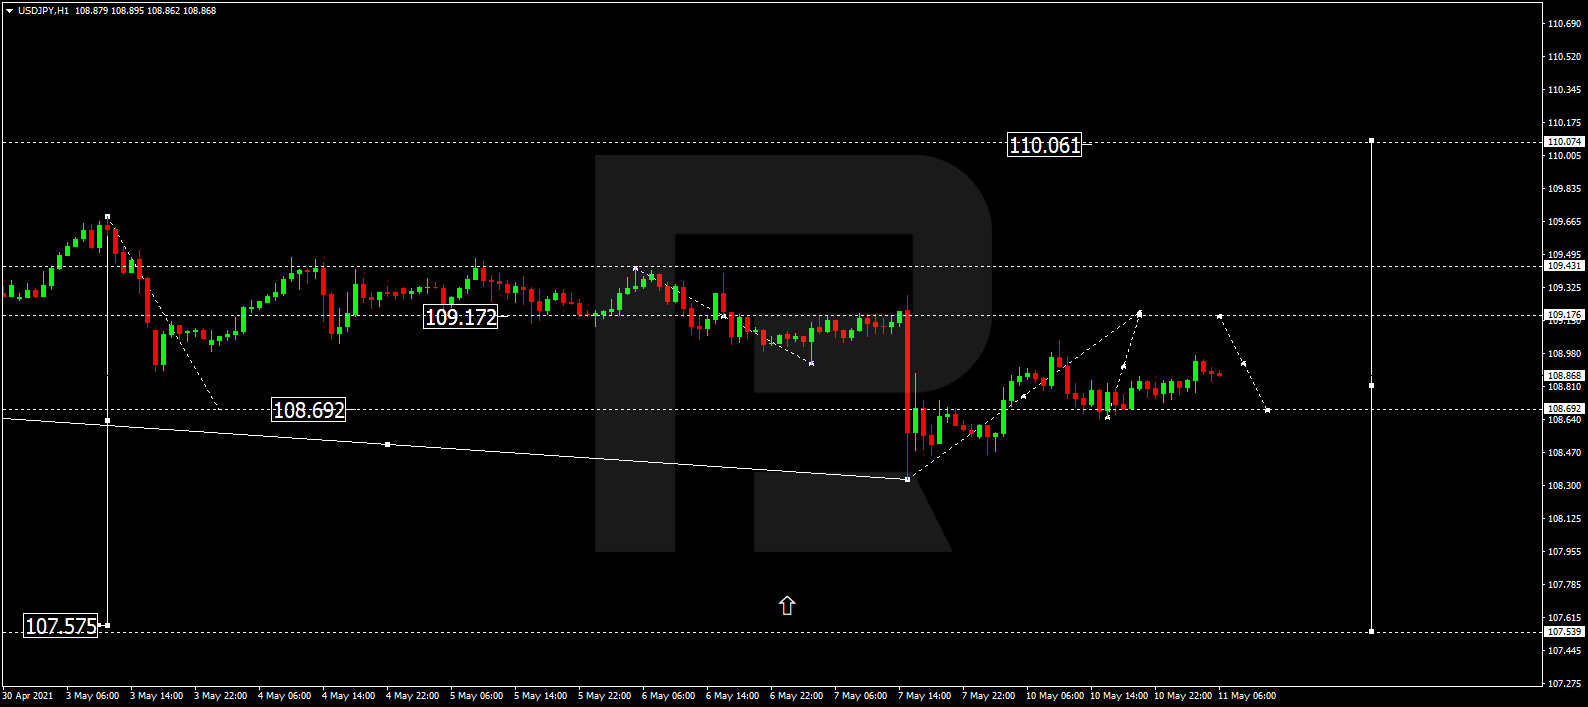
In the daily chart, after completing the descending correction at 107.50, USDJPY is trading upwards and this movement may be considered as another ascending wave with the target at 111.44. By now, the asset has broken 109.40 and may later consolidate around this level. After breaking this range to the upside, the instrument may start a new growth to reach the above-mentioned target and then resume falling with the first target at 104.40.

USDJPY
Risk Warning: the result of previous trading operations do not guarantee the same results in the future

BRENT

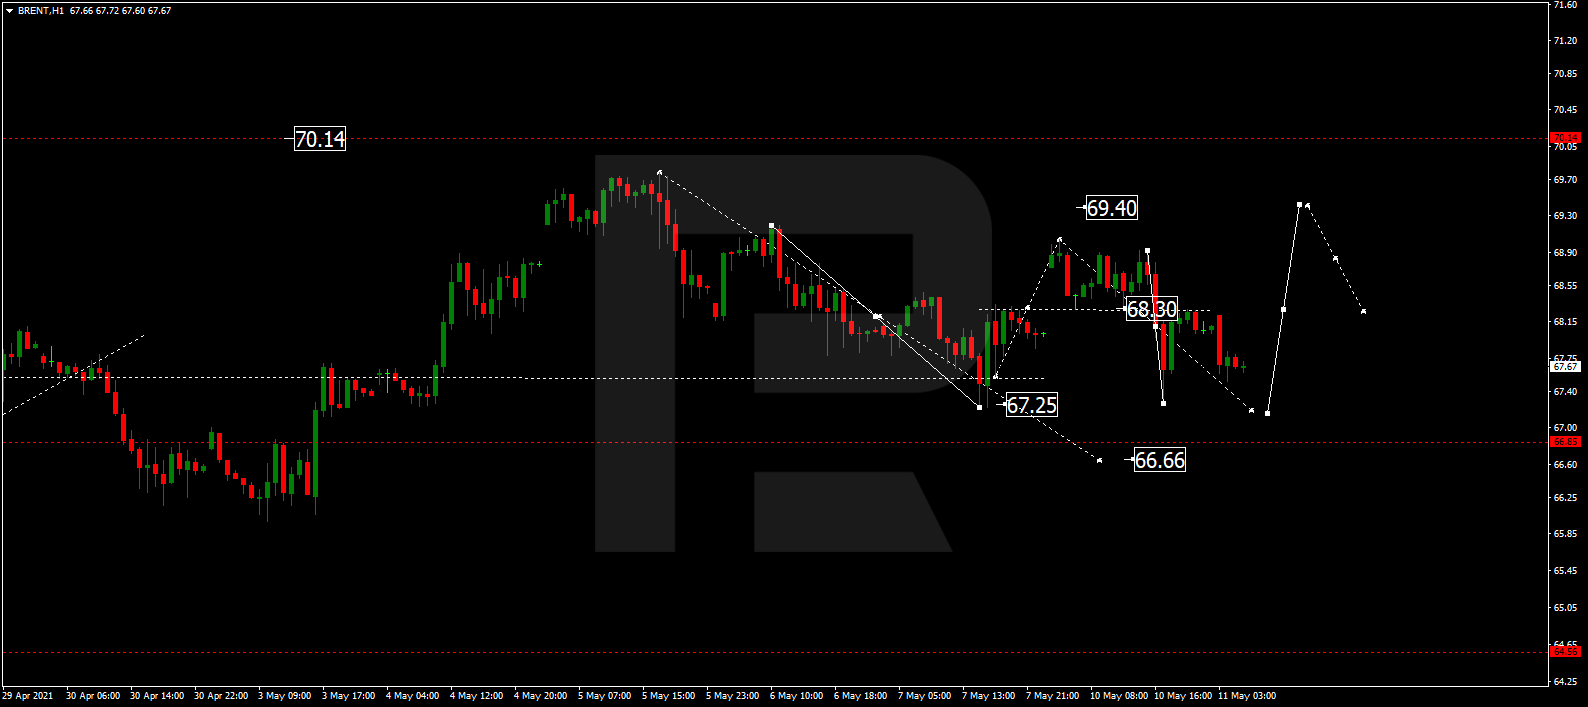
As we can see in the daily chart, after finishing the ascending wave at 63.00 and breaking this level to the upside, Brent is still forming another wave to the upside with the short-term target at 75.00. Later the market may correct to return to 63.00 and then continue trading within the uptrend with the key target at 90.00.

BRENT
Risk Warning: the result of previous trading operations do not guarantee the same results in the future

XAUUSD, “Gold vs US Dollar”

In the daily chart, Gold has completed another ascending structure at 1777.77; right now, it is consolidating around this level. Possibly, the metal may break the range to the upside and form one more ascending wave with the first target at 1900.00. After that, the instrument may start a new correction to reach 1780.00 and then resume moving upwards with the target at 2000.00.

GOLD
Risk Warning: the result of previous trading operations do not guarantee the same results in the future

S&P 500

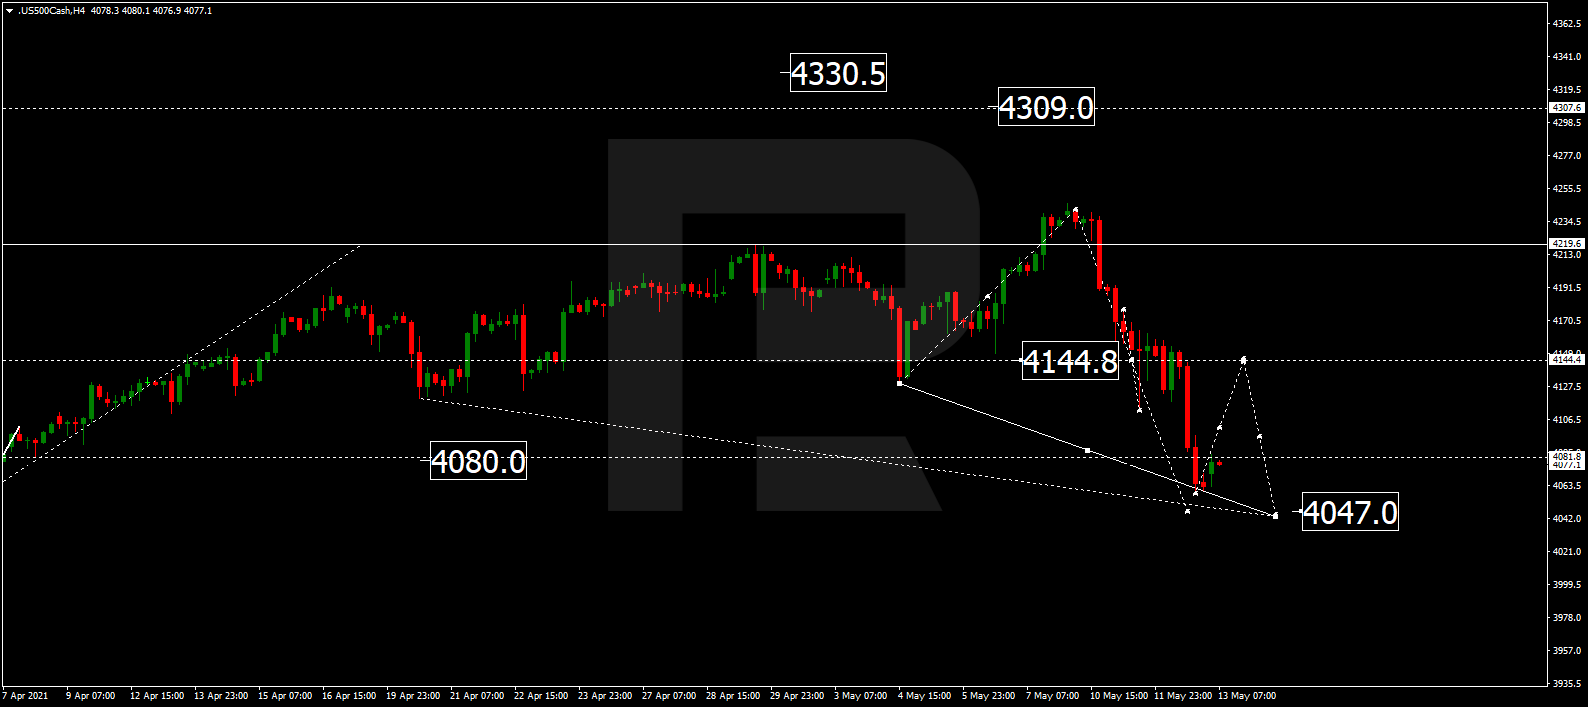
In the daily chart, the S&P index continue trading upwards to reach. Later, the market may start a new correction towards 4058.0 and then resume trading within the uptrend with the target at 4380.00.

S&P 500
Risk Warning: the result of previous trading operations do not guarantee the same results in the future

Article By RoboForex.com

Attention!
Forecasts presented in this section only reflect the author’s private opinion and should not be considered as guidance for trading. RoboForex LP bears no responsibility for trading results based on trading recommendations described in these analytical reviews.

The Analytical Overview of the Main Currency Pairs on 2021.05.03

by JustForex

The EUR/USD currency pair

Technical indicators of the currency pair:
  • Prev Open: 1.2115
  • Prev Close: 1.2019
  • % chg. over the last day: -0.79%

On Friday, the EUR/USD currency pair fell by 0.79%, dropping almost 100 pips. This primarily was due to the released negative statistics on German GDP and Europe, where the strict lockdown scenario continues.

Trading recommendations
  • Support levels: 1.1994, 1.1957
  • Resistance levels: 1.2108, 1.2049, 1.2145, 1.2176, 1.2212, 1.2243

The price broke down the critical support level of 1.2088, activating the alternative scenario. The 1.2049 support level and the main uptrend line were also broken down by impulsive candles, as a result, the price held under the moving average. MACD went into the negative area. The best strategy for EUR/USD would be to look for short positions from resistance levels within the local downtrend.

Alternative scenario: if the price breaks up through the 1.2108 level and holds above, with a high probability, the general uptrend will continue.

News feed for 2021.05.03:
  • – German Final Manufacturing PMI (m/m) at 10:55 (GMT+3);
  • – US ISM Manufacturing PMI (m/m) at 17:00 (GMT+3);;
  • – Fed Chair Powell Speaks at 21:20 (GMT+3).

The GBP/USD currency pair

Technical indicators of the currency pair:
  • Prev Open: 1.3936
  • Prev Close: 1.3809
  • % chg. over the last day: -1.2%

The British currency fell more than 1% on Friday. The price moved below the moving average, and the MACD went deep below 0. In addition, the price easily passed three support levels at once. All these are signs of strong bearish pressure.

Trading recommendations
  • Support levels: 1.3794, 1.3756, 1.3690
  • Resistance levels: 1.3835, 1.3864, 1.3913, 1.3996, 1.4149

The price has consolidated below 1.3864, so it is best to focus on opening sell trades. But the entry price is not optimal right now, traders need to wait for a minor pullback to the resistance levels.

Alternative scenario: if the price breaks up through the 1.3864 resistance level and holds above, with a high probability, the bullish scenario will become active again.

There is no news feed for today.

The USD/JPY currency pair

Technical indicators of the currency pair:
  • Prev Open: 108.91
  • Prev Close: 109.33
  • % chg. over the last day: +0.38%

On Friday, the currency pair USD/JPY reached the resistance level of 109.36 and stopped in front of it. At the market opening on Monday, the price broke through this level and went upwards. The MACD indicator keeps signaling a divergence, which suggests that the buyers are getting weaker. But as long as the price is above the moving average and the uptrend line, it is not recommended to open short positions.

Trading recommendations
  • Support levels: 109.36, 109.04, 108.87, 108.44, 108.19,107.77, 107.47, 107.04
  • Resistance levels: 109.95, 110.51

The price has deviated strongly from the moving average, which acts like a magnet. Therefore, the most likely price will make a small pullback in the next few days.

Alternative scenario: if the price drops below 108.44, with a high probability, the general downtrend will continue.

There is no news feed for today.

The USD/CAD currency pair

Technical indicators of the currency pair:
  • Prev Open: 1.2281
  • Prev Close: 1.2289
  • % chg. over the last day: +0.06%

The USD/CAD currency pair traded in a narrow range all Friday and failed to break down through the 1.2280 support level. In addition, there is a divergence on the MACD indicator, and a bullish impulse appeared on intraday timeframes. All these are signs of the possible start of the local correction upwards.

Trading recommendations
  • Support levels: 1.2280, 1.2165
  • Resistance levels: 1.2321, 1.2388, 1.2414, 1.2519, 1.2618

For USD/CAD, the trend is strictly downward, so it is reasonable to look for sell trades from the resistance levels or a local downtrend line. The entry price for opening short positions is not the best now, so it is better to wait for the rebound or look for intraday purchases within the intraday uptrend.

Alternative scenario: if the price breaks through the 1.2414 resistance level and holds above, with a high probability, a local corrective uptrend will be formed.

News feed for 2021.05.03:
  • – Canada’s Gross Domestic Product at 15:30 (GMT+3).

by JustForex


This article reflects a personal opinion and should not be interpreted as an investment advice, and/or offer, and/or a persistent request for carrying out financial transactions, and/or a guarantee, and/or a forecast of future events.

After a challenging month, will the dollar recover?

By Hussein Sayed Chief Market Strategist (Gulf & MENA), ForexTime

The month of April was not a good one for dollar bulls. The greenback has posted its first monthly decline of 2021, erasing over 2 per cent of its value against six major currencies.

According to the latest data from the Commodity Futures Trading Commission, the net short positions on the dollar reached $10.27 billion against its major peers. That is more than $2 billion net shorts added compared to a week earlier and the highest in six weeks.

The dollar’s decline followed three back-to-back monthly gains as data began to show the US economy recovering at an amazingly fast pace, leading to higher inflation expectations and bond yields suggesting sooner than anticipated tightening in monetary policy.

However, the Federal Reserve did not agree with the market’s view and remained committed to keeping monetary policy extremely loose last week at its policy meeting, setting a high bar for any start date to reduce the pace of its asset purchases. The Fed requires substantial further progress in reaching its employment goals before starting the tapering process. Given the US labour market remains 8.4 million jobs short of its pre-pandemic employment levels, it seems there’s still a long way to go.

Data on Friday revealed a surge in US personal spending, personal income, personal consumption expenditure and consumer sentiment. This was a reminder of how far the US economy is outperforming other developed nations, especially after the Eurozone’s first quarter GDP report showed the continent had fallen into a double dip recession.

Given the market is a forward-looking mechanism, it tends to incorporate all currently known information and anticipated events. The narrative now is that the rest of the global economy continues to struggle with the Covid-19 pandemic but will sooner rather than later catch up with the US. However, latest Covid developments in India, Brazil and Turkey should be a reminder not to take anything for granted. The divergence of the global economy may or may not narrow depending on how these issues play out.

This week’s economic data will likely show the ongoing recovery in the US in the hard hit services sector, after the activity index jumped to a record high in March. Manufacturing activity is also expected to continue booming. On Friday, we will learn how many jobs were added to the US economy in April after 916,000 Americans found jobs in March. If we see an uptick in US 10-year yields towards 1.7%, this should become supportive of the US dollar, otherwise the global reflation trade will continue to pressure the greenback.

Despite Fed Chair Jerome Powell continuing to insist that inflationary pressures are transitory in nature, if commodity prices continue to surge and push breakeven rates higher, the Fed will need to change its language. We are already seeing member’s views diverging from Powell, with Dallas Fed President Robert Kaplan saying on Friday that any signs of excessive risk-taking would suggest it is time to consider fewer bond purchases. An increasing amount of similar voices could completely change the narrative in the market from a global economy narrowing the gap with the US to a one of the US tightening policy first.


Disclaimer: The content in this article comprises personal opinions and should not be construed as containing personal and/or other investment advice and/or an offer of and/or solicitation for any transactions in financial instruments and/or a guarantee and/or prediction of future performance. ForexTime (FXTM), its affiliates, agents, directors, officers or employees do not guarantee the accuracy, validity, timeliness or completeness, of any information or data made available and assume no liability as to any loss arising from any investment based on the same.


Forex-Time-LogoArticle by ForexTime

ForexTime Ltd (FXTM) is an award winning international online forex broker regulated by CySEC 185/12 www.forextime.com