Article By RoboForex.com
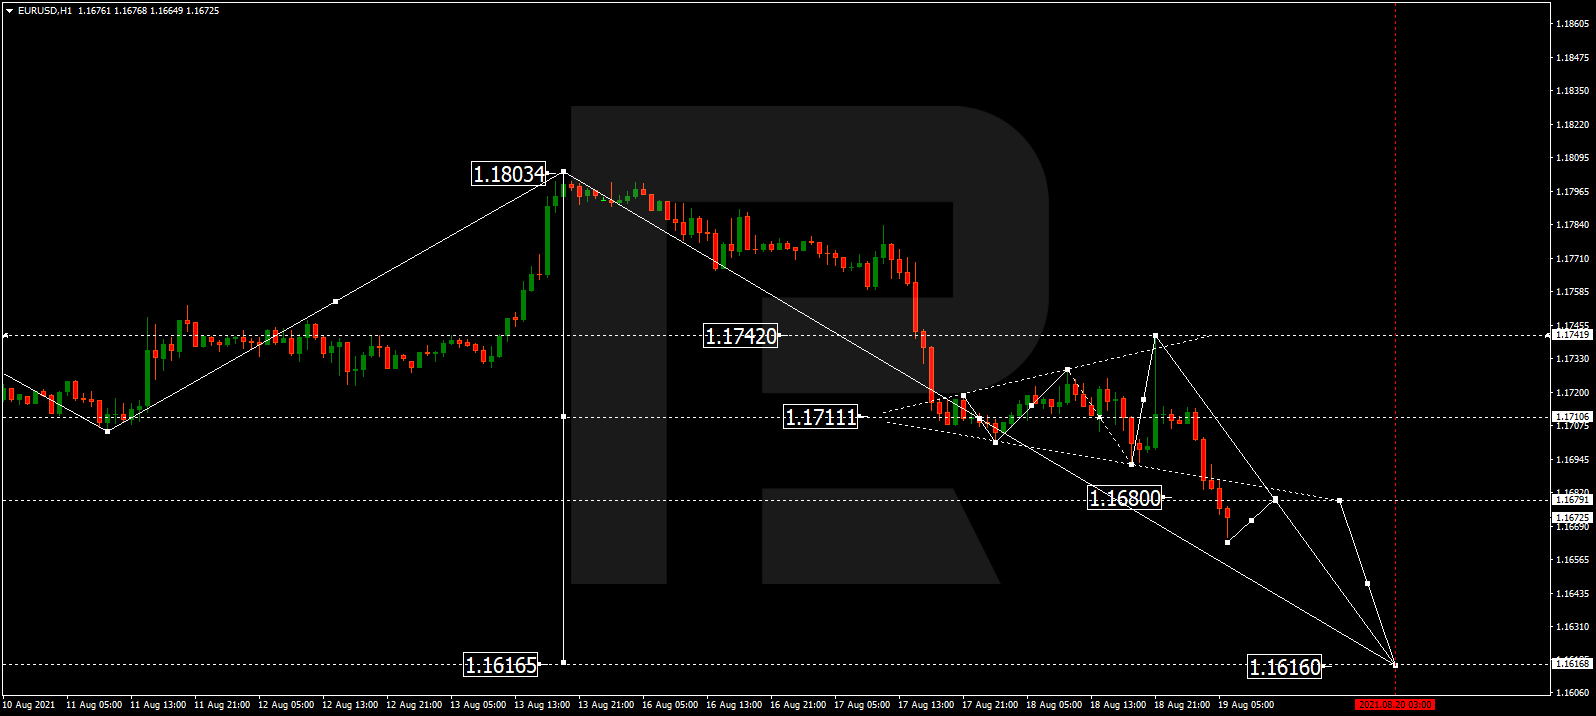
EURUSD, “Euro vs US Dollar”
After finishing the correction at 1.1740 and rebounding from this level, EURUSD has reached 1.1680, thus forming a downside continuation pattern around 1.1711, which may be considered as the third wave to the downside with the short-term target at 1.1616. Later, the market may start a new correction to return to 1.1711 and test it from below.

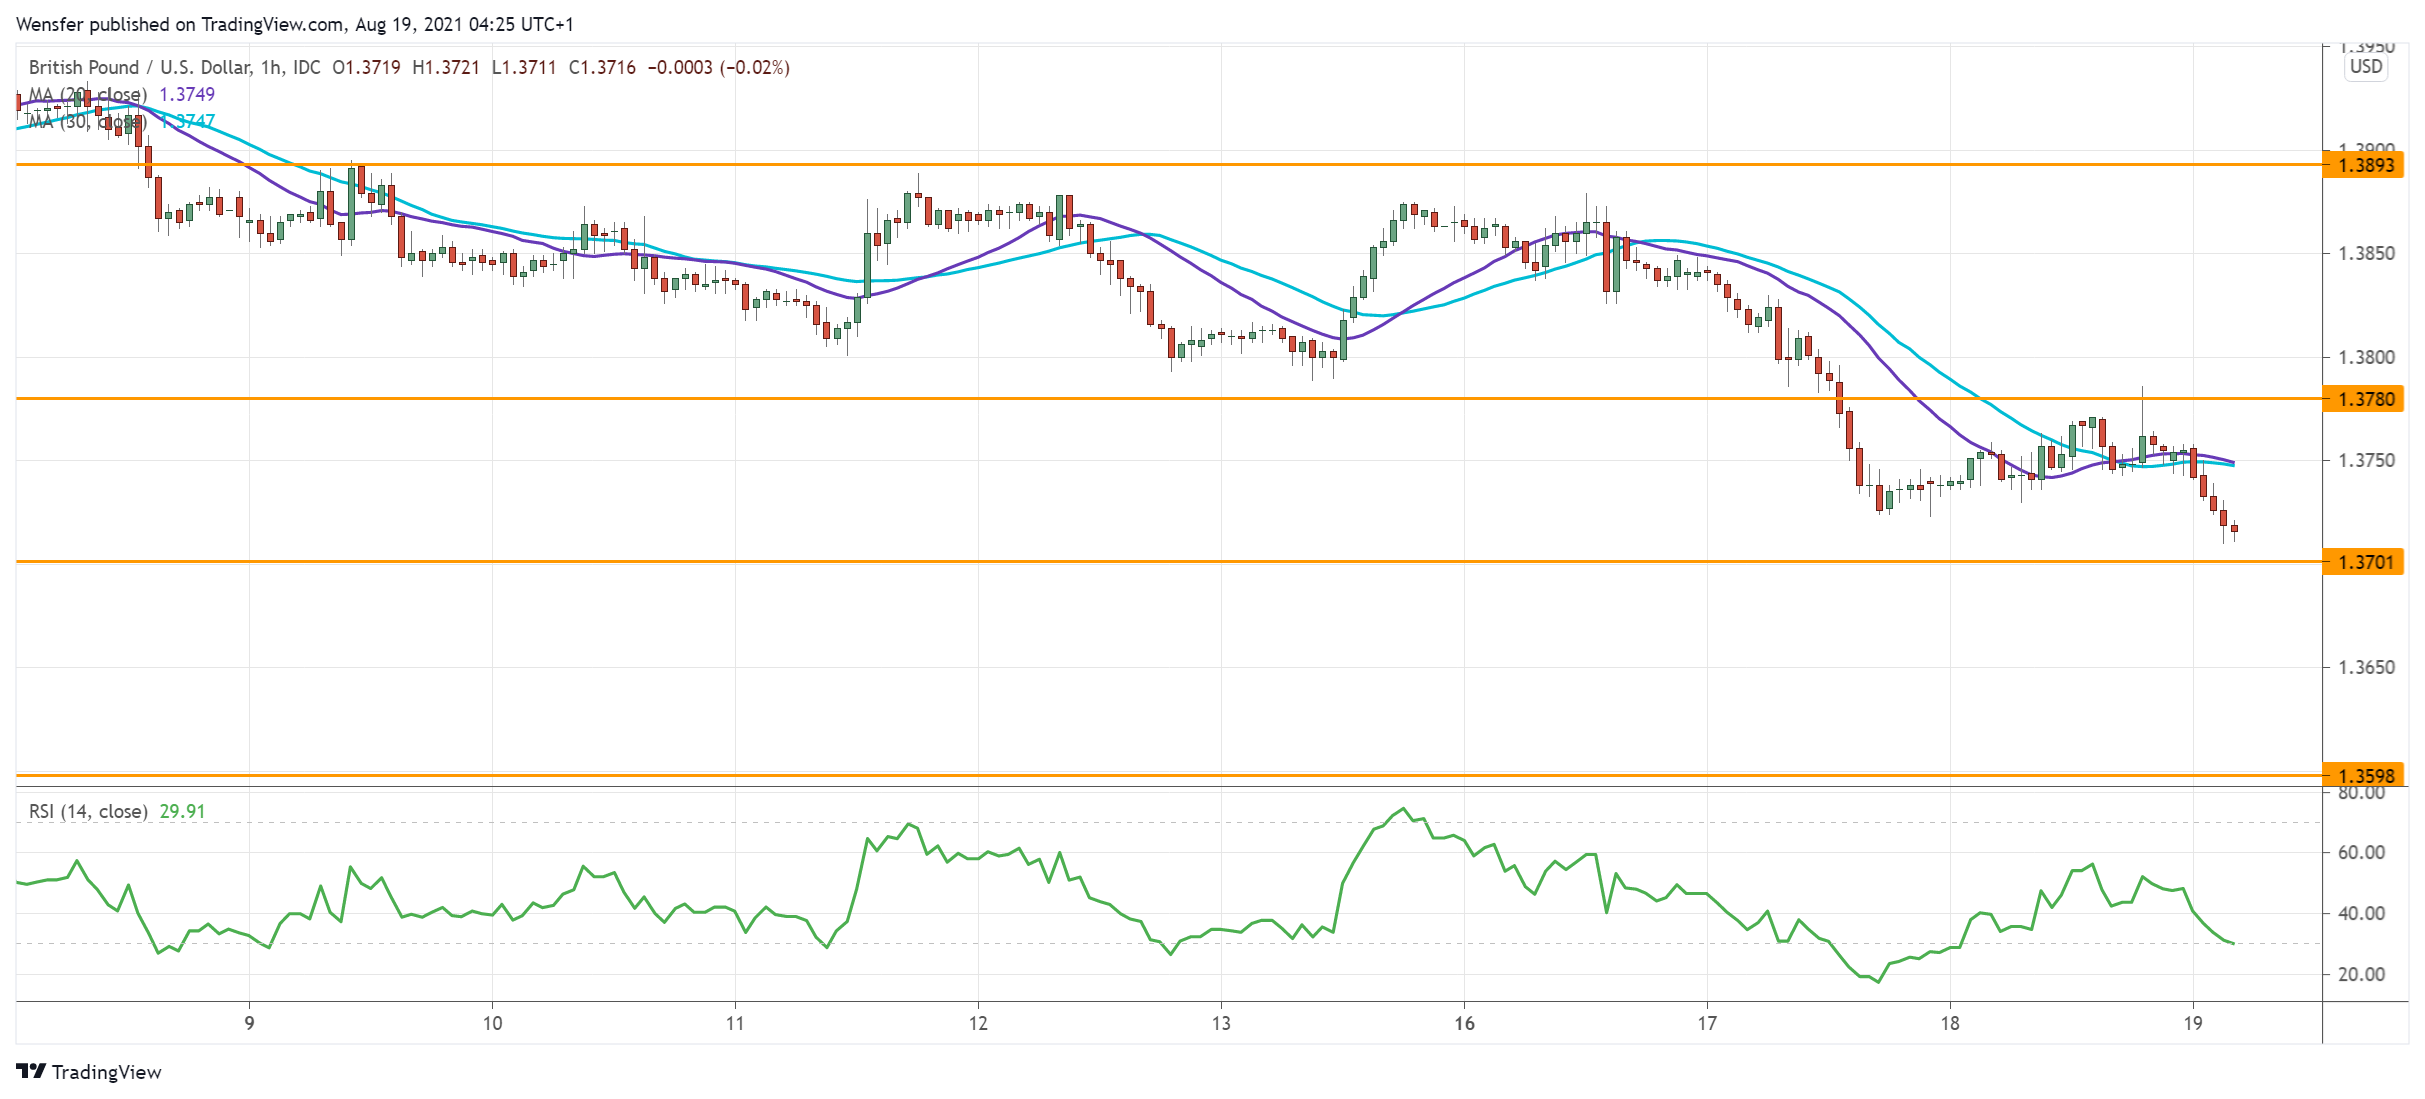
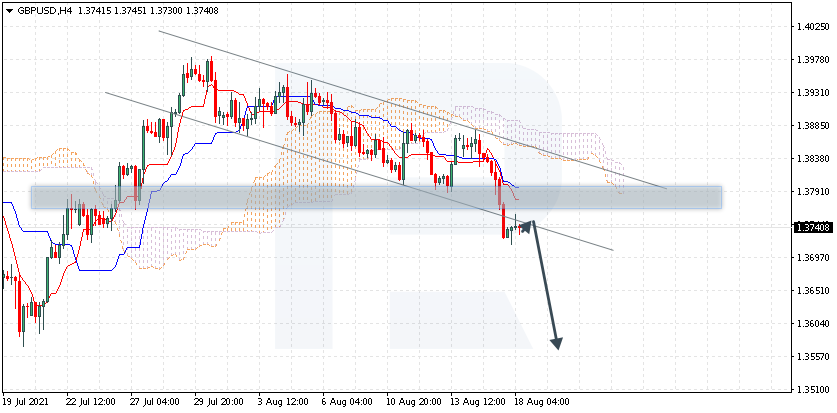
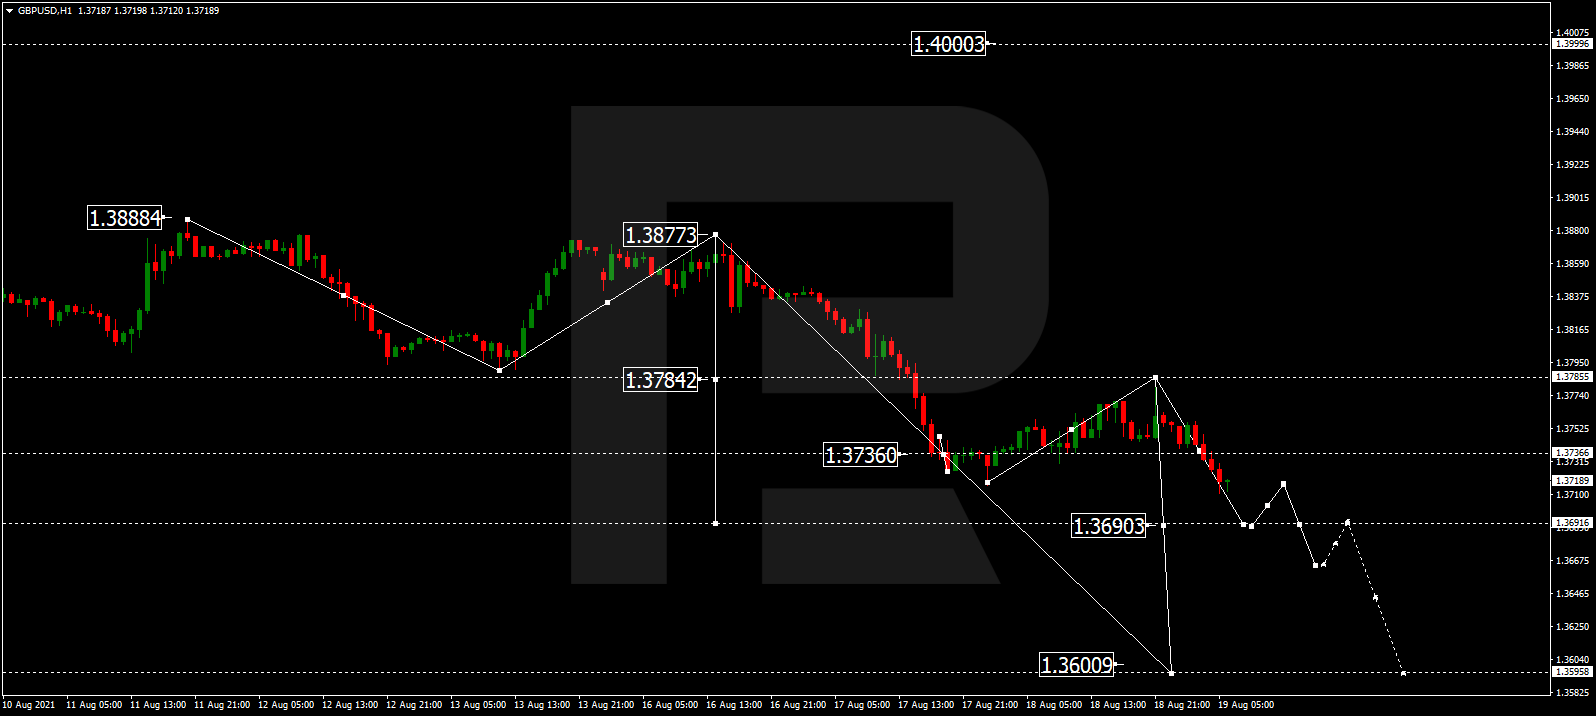
GBPUSD, “Great Britain Pound vs US Dollar”
After completing the correction at 1.3780 and rebounding from this level, GBPUSD is still falling; by now, it has reached 1.3715. Today, the pair may continue falling towards 1.3690, which is considered as the centre of another descending wave. After that, the instrument may form a new consolidation range around the latter level in the form of a continuation pattern. The predicted downside target at 1.3600.
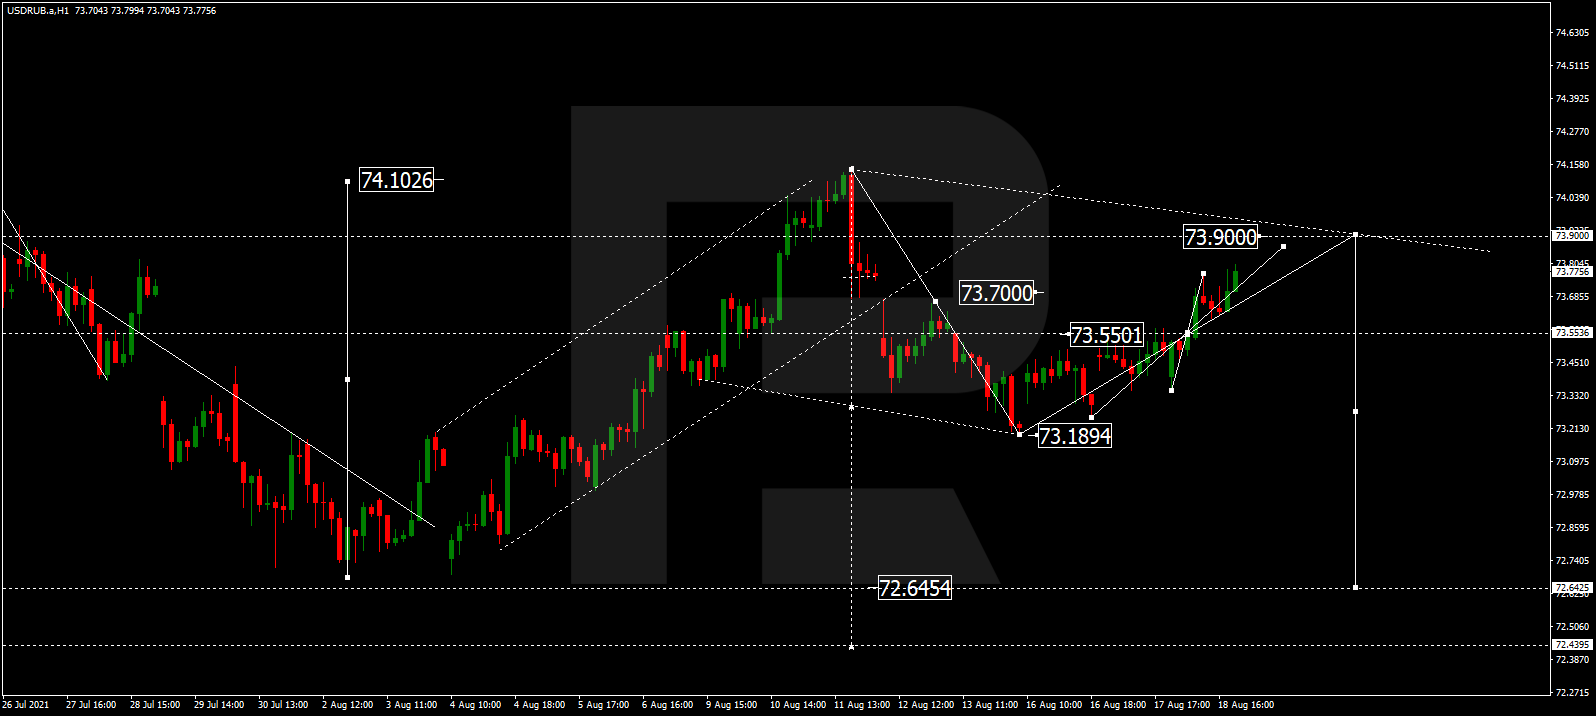
USDRUB, “US Dollar vs Russian Ruble”
USDRUB has finished the ascending structure at 73.93. Possibly, today the pair may consolidate around this level. If later the price breaks this range to the downside, the market may resume trading downwards with the target at 72.70.
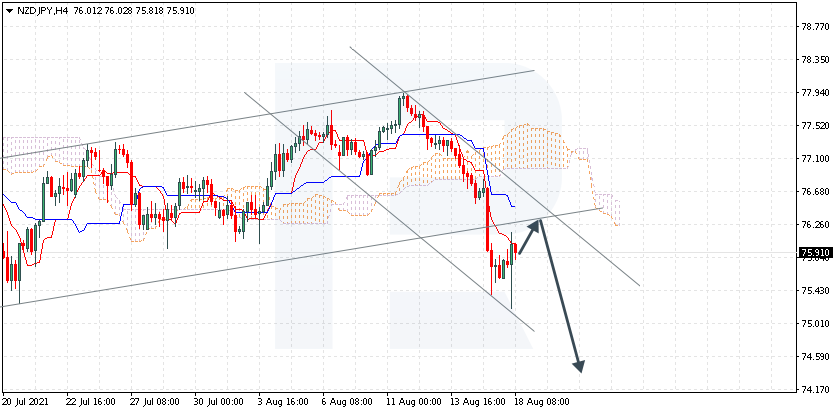
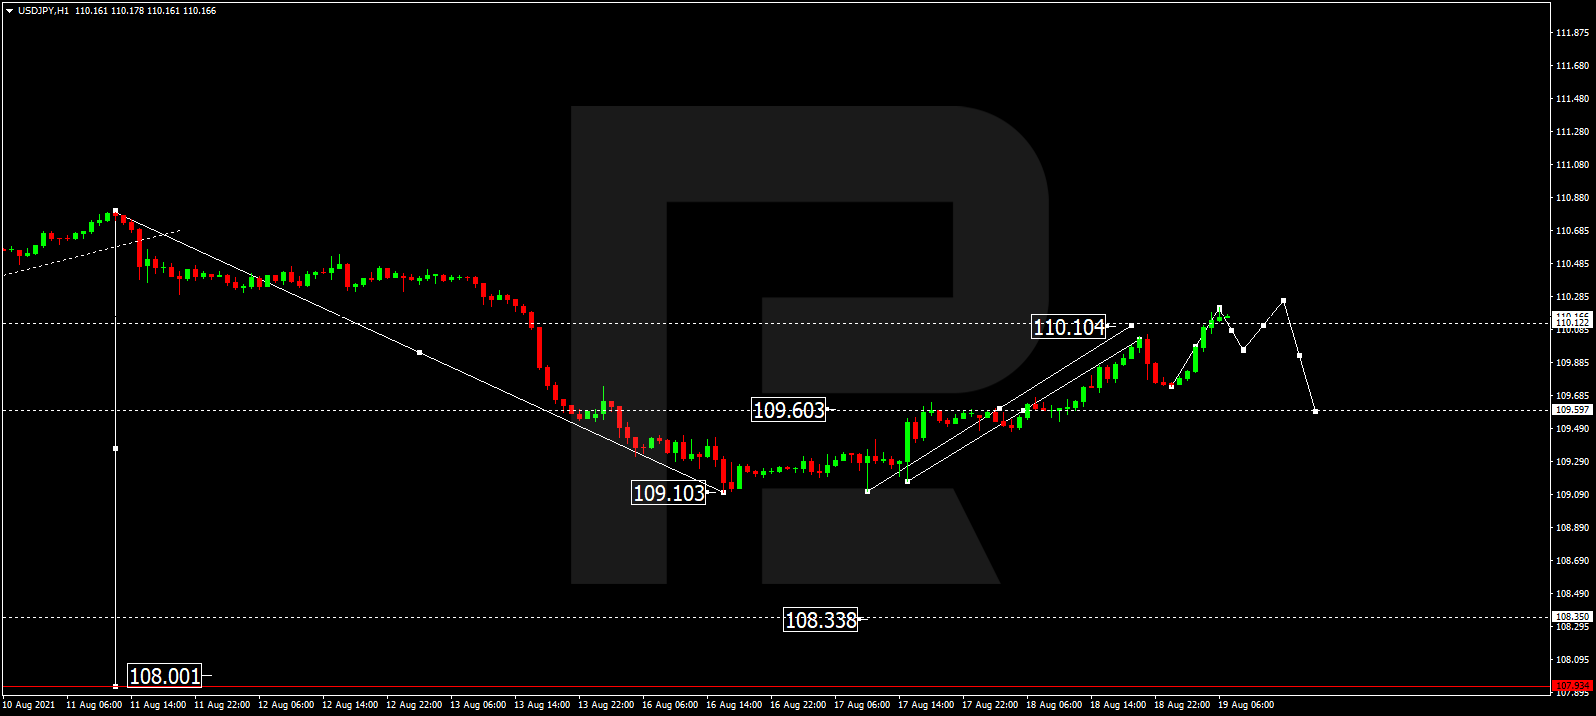
USDJPY, “US Dollar vs Japanese Yen”
After completing the correction at 110.10, USDJPY is expected to consolidate there. If later the price breaks this range to the downside, the market may start another decline to break 109.33 and then continue falling within the downtrend with the short-term target at 108.50.
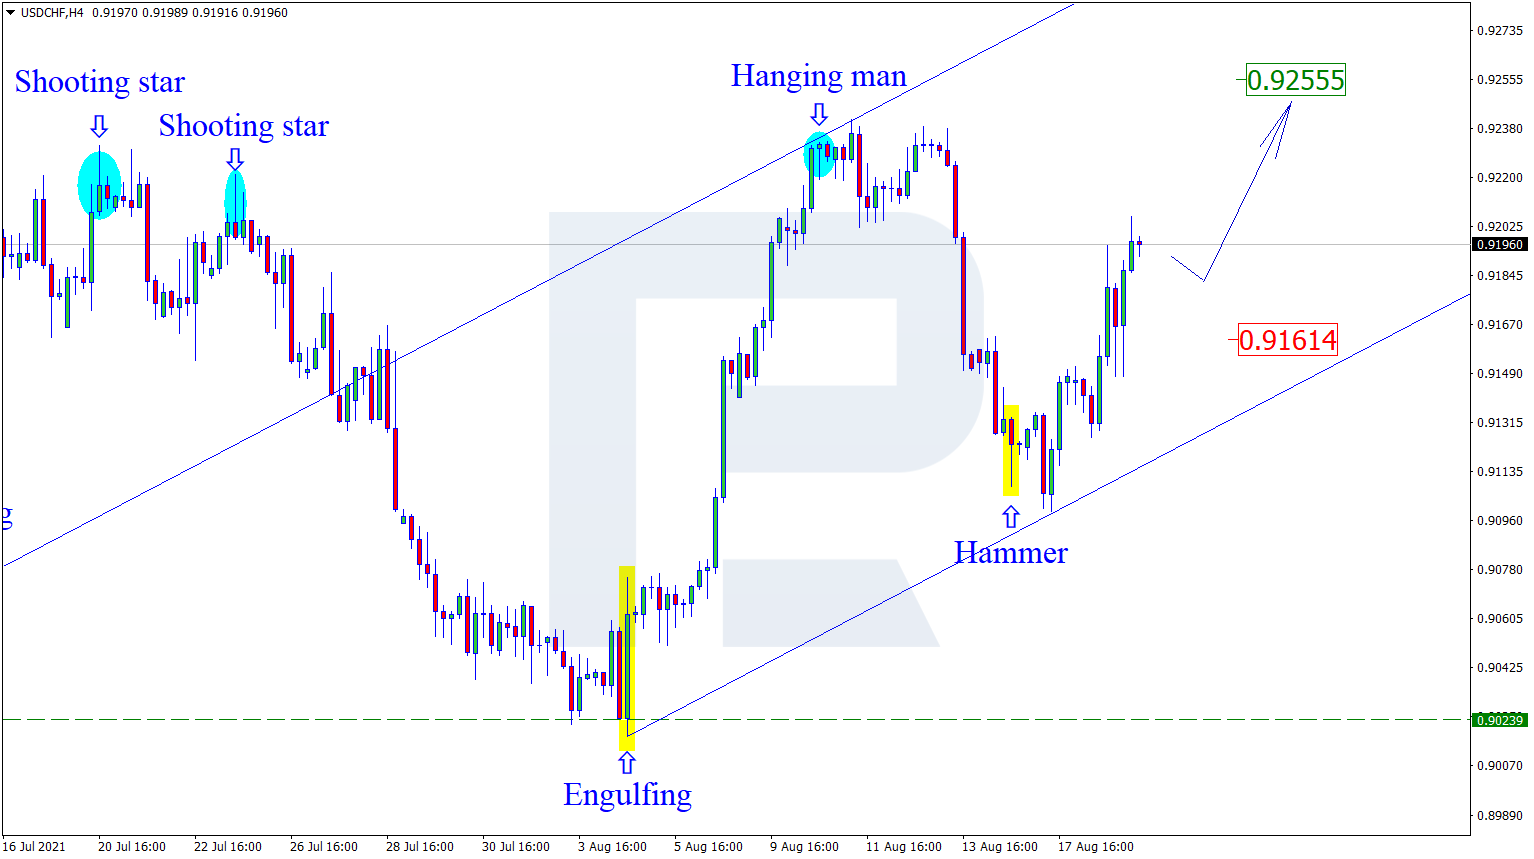
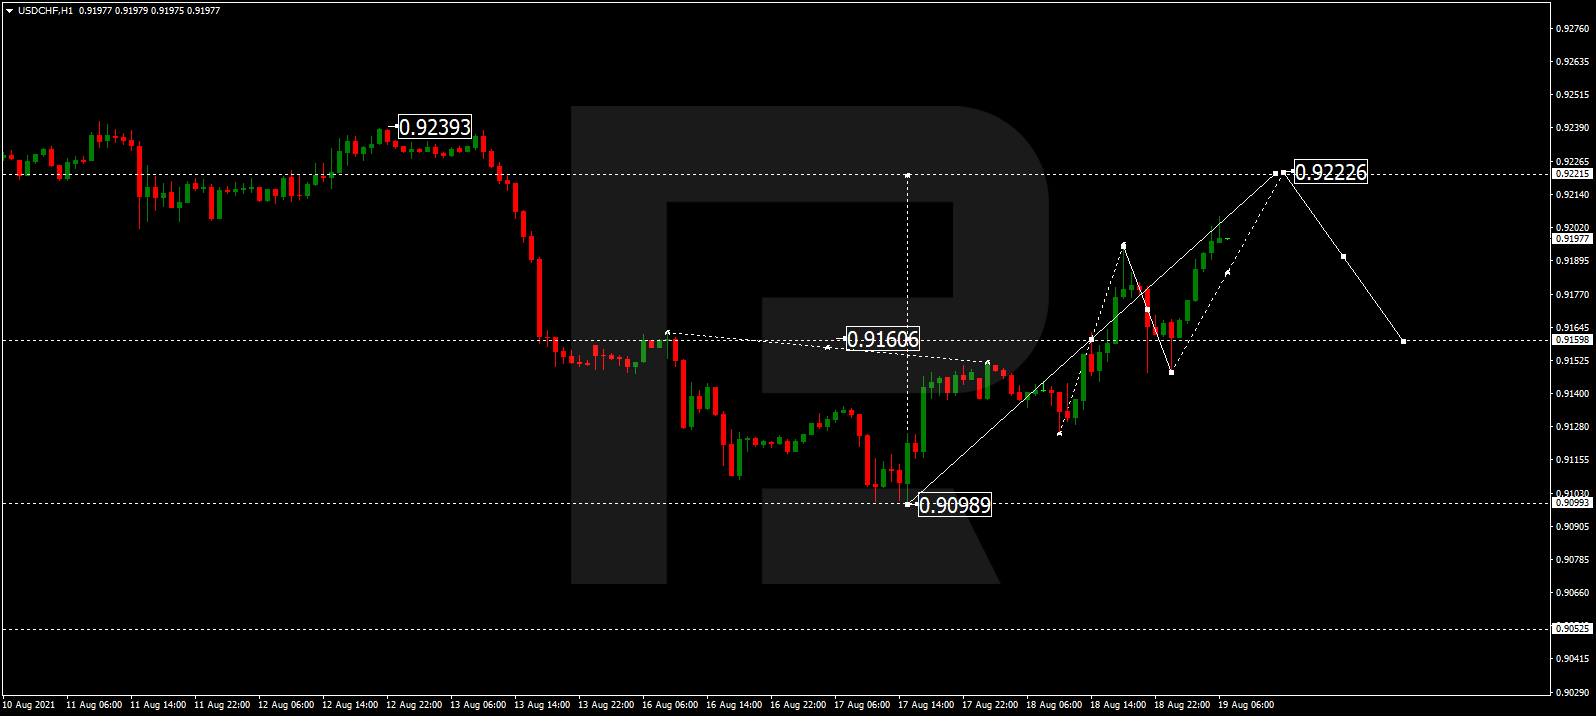
USDCHF, “US Dollar vs Swiss Franc”
USDCHF is still trading upwards to reach 0.9222. After that, the instrument may correct towards 0.9150 and then start a new growth with the target at 0.9290.
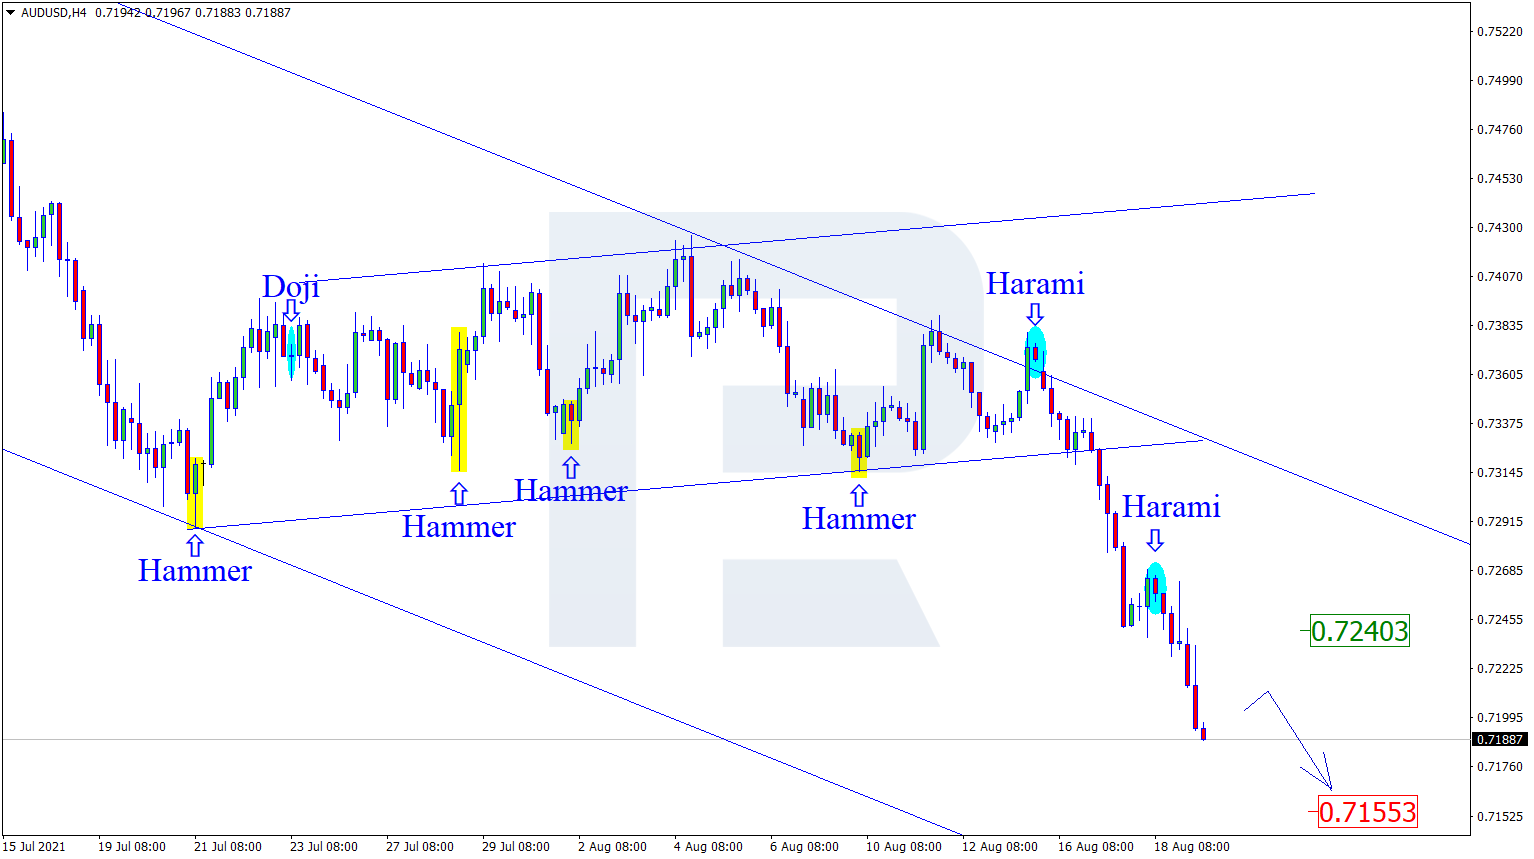
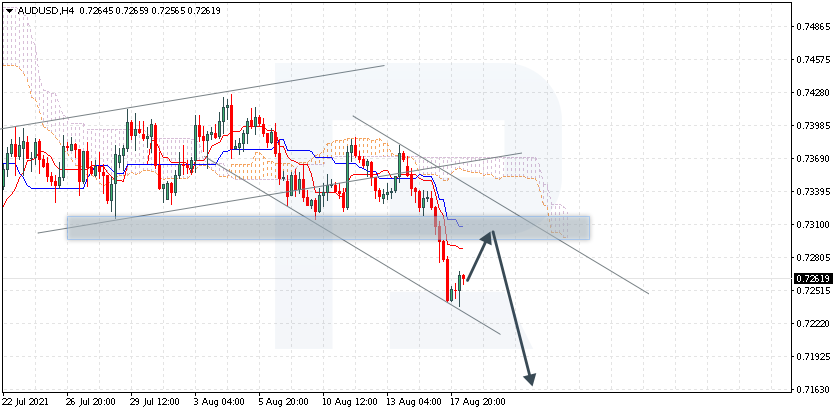
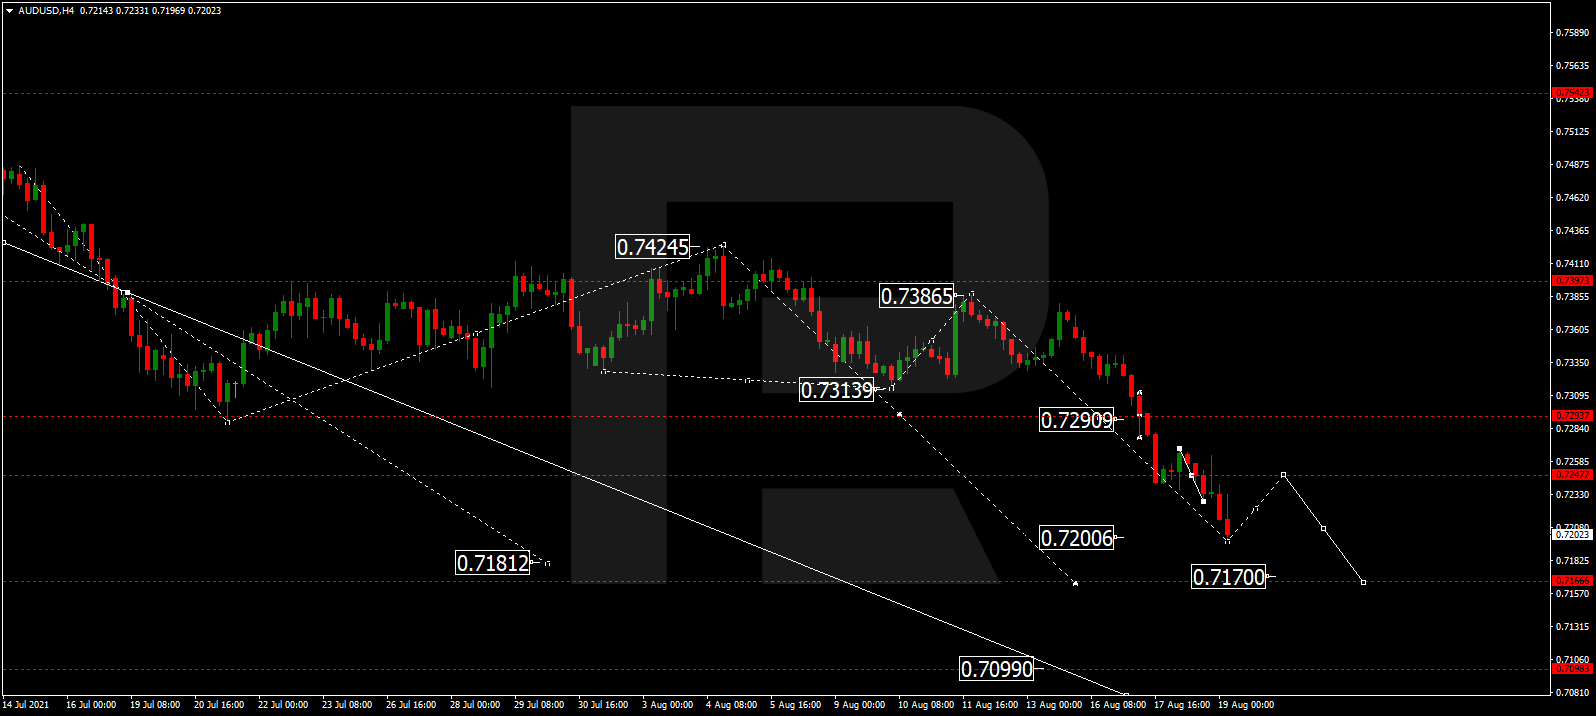
AUDUSD, “Australian Dollar vs US Dollar”
AUDUSD continues falling; by now, it has reached 0.7200. Possibly, today the pair may grow towards 0.7240 and then resume trading within the downtrend with the short-term target at 0.7170.
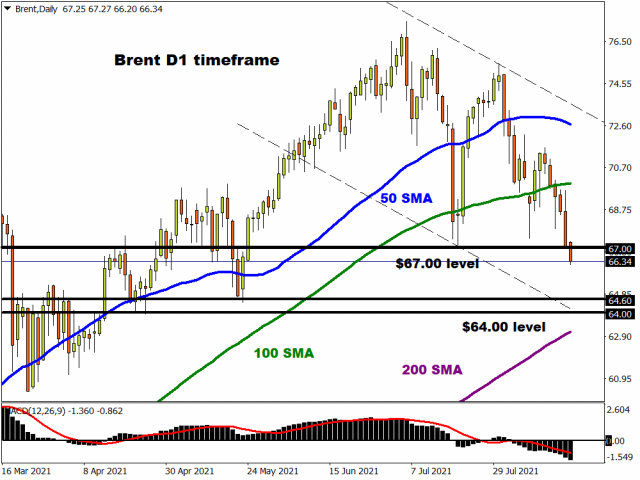
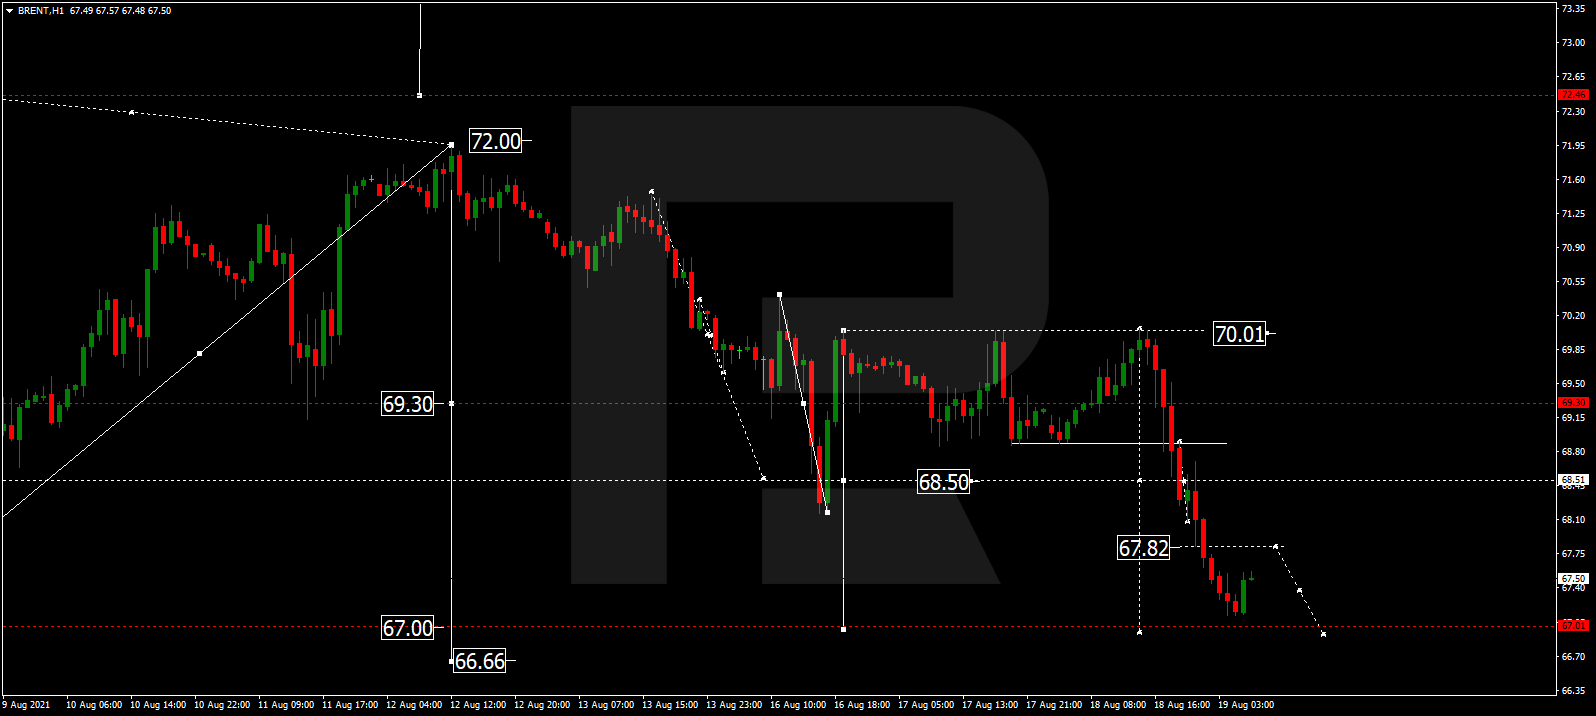
BRENT
After breaking the consolidation range to the downside, Brent has completed the descending structure at 67.15. Today, the asset may grow towards 67.80 and then resume falling to reach 67.00, at least, to finish this descending wave. After that, the instrument may form a new consolidation range near the lows with a reversal pattern. If later the price breaks this range to the upside, the market may form resume trading upwards with the target at 72.00.
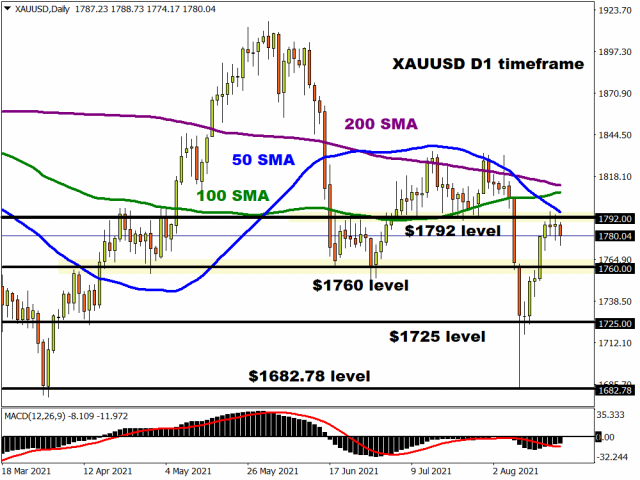
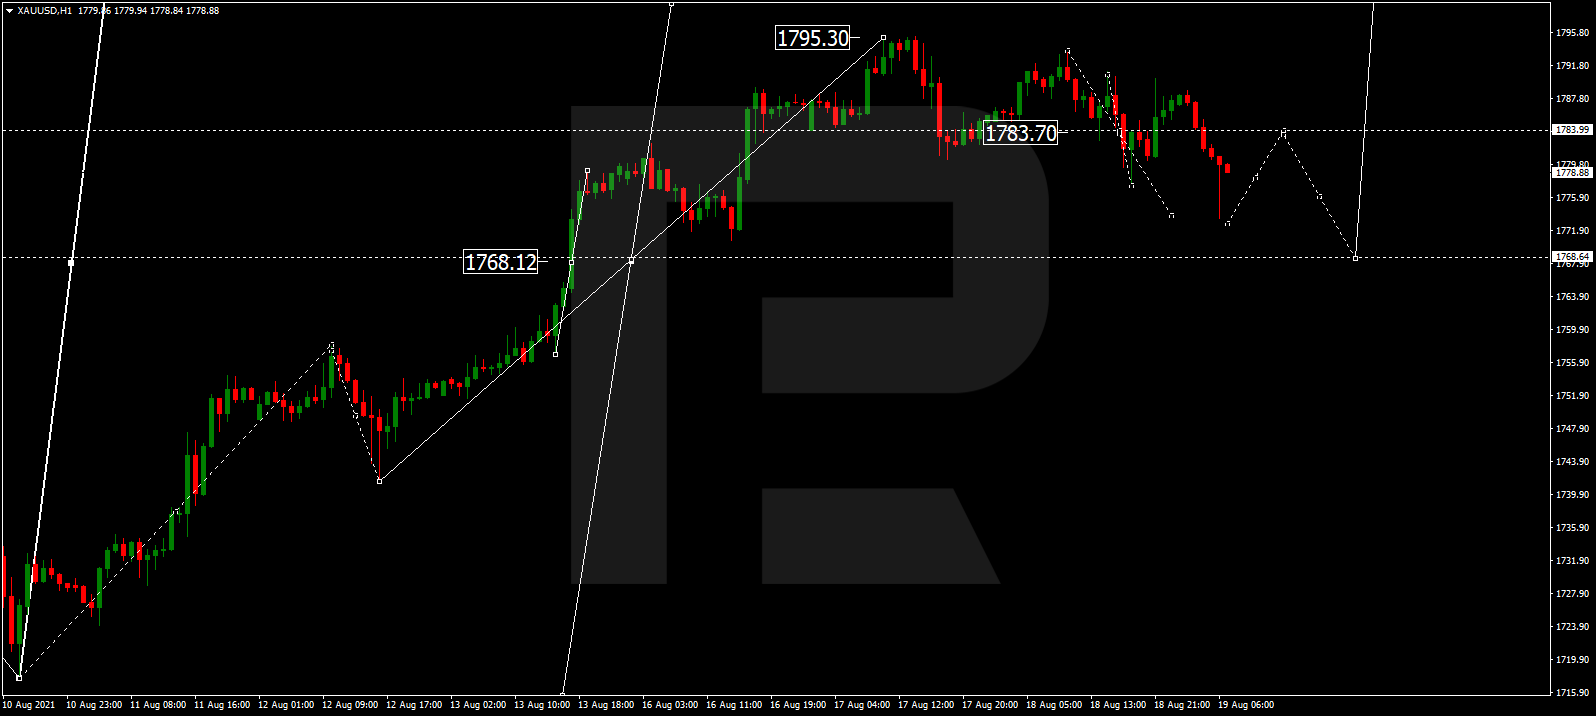
XAUUSD, “Gold vs US Dollar”
Gold is forming the second descending impulse with the target at 1777.00. Later, the market may grow towards 1784.00 and then resume falling to reach 1768.68. After that, the instrument may form one more ascending structure with the target at 1817.00.
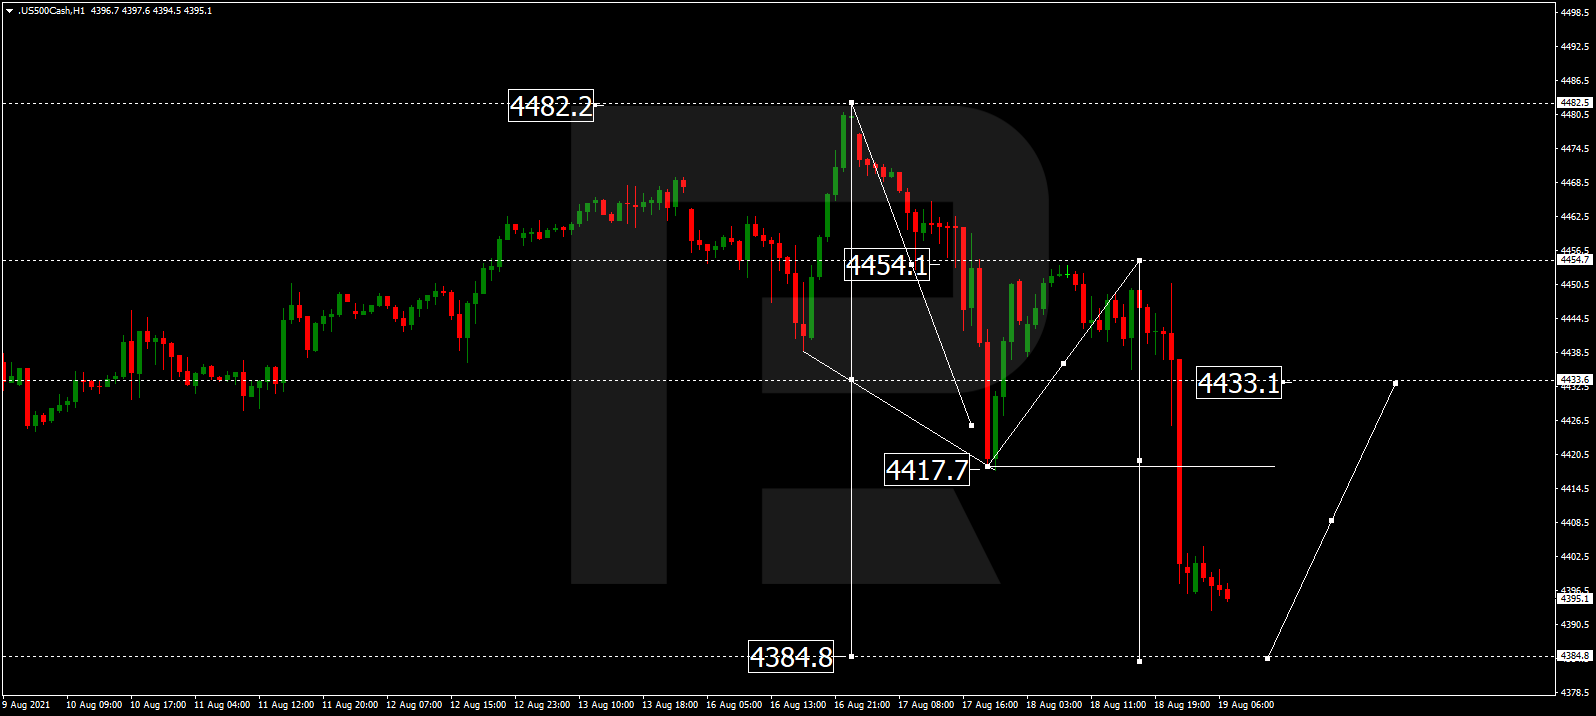
S&P 500
After finishing the ascending structure at 4454.5 and rebounding from this level, the S&P index is falling towards 4384.8 and may later consolidate around this level. If the price breaks this range to the upside, the market may start another correction towards 4433.0.
Article By RoboForex.com
Attention!
Forecasts presented in this section only reflect the author’s private opinion and should not be considered as guidance for trading. RoboForex LP bears no responsibility for trading results based on trading recommendations described in these analytical reviews.