By ForexTime
There’s been a lot of major movements across currency markets of late, as the US dollar’s scorched-earth ascent to a fresh 20-year high leaves its major peers lying in a heap.
And some of our recent Market Analysis report had served as a prelude to these major FX moves.
In case you missed it, let’s revisit some of them:
1) Sept 1st article: “How does the US Dollar typically fare in September?”
This time last week, I wrote:
“The US dollar is expected to register further gains in September 2022, even as DXY now trades around its highest levels in 20 years.”
Sure enough, the benchmark dollar index duly delivered with a higher high, posting a fresh peak since 2002.
To be clear, the DXY has moderated back below the psychologically-important 110 mark at the time of writing, and has returned to around last Thursday’s highs. It appears that the DXY is now seeing a pullback from “overbought” conditions, with its 14-day relative strength index moving back below the 70 threshold.

Even the equally-weighted USD index has printed a higher high since, trading around levels not seen since the early months of the global pandemic back in 2020.

In that same September 1st article, we also highlighted some of the world’s top-traded major currency pairs and key levels to look out for this month:
- EURUSD: 59% chance of hitting 0.985
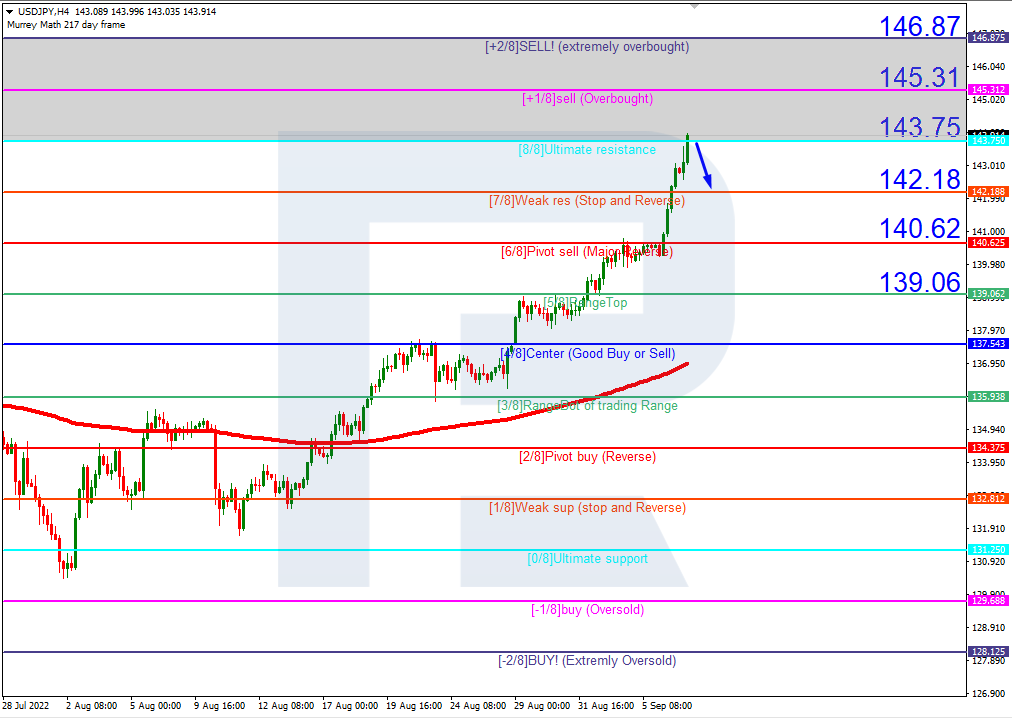
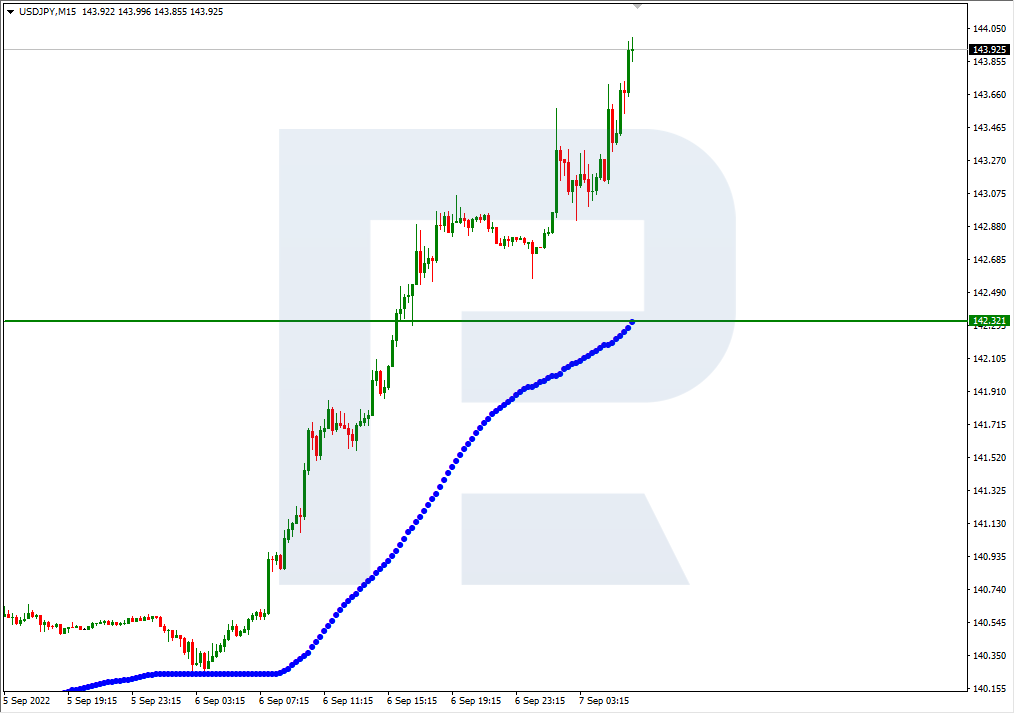
- USDJPY: 70% chance of reaching 141.0
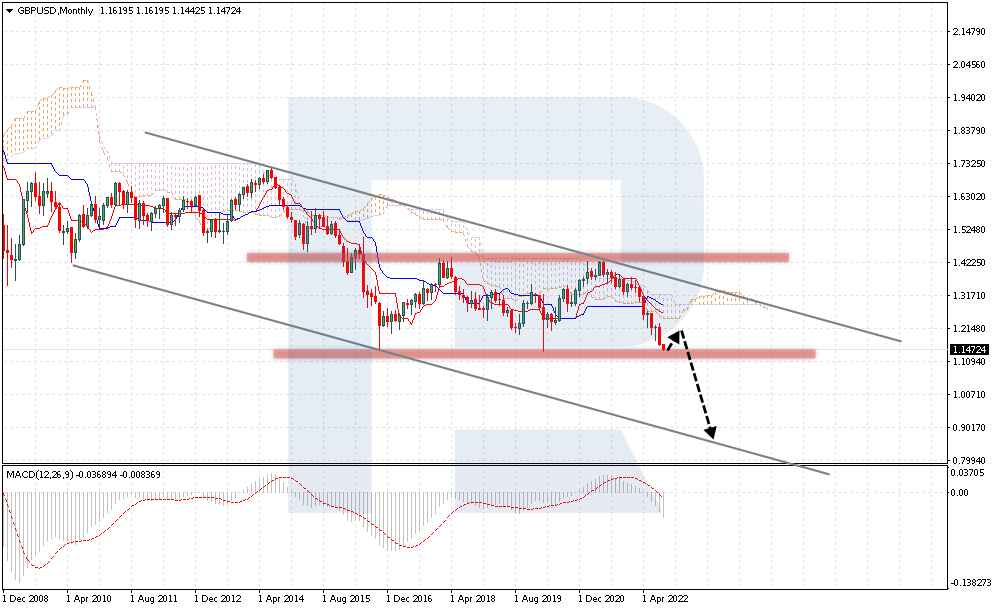
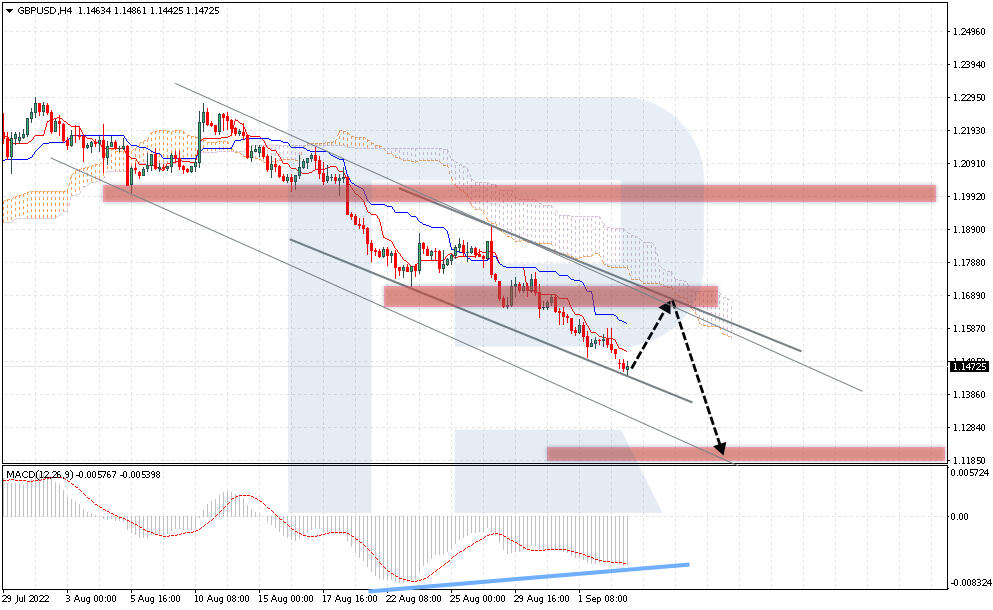
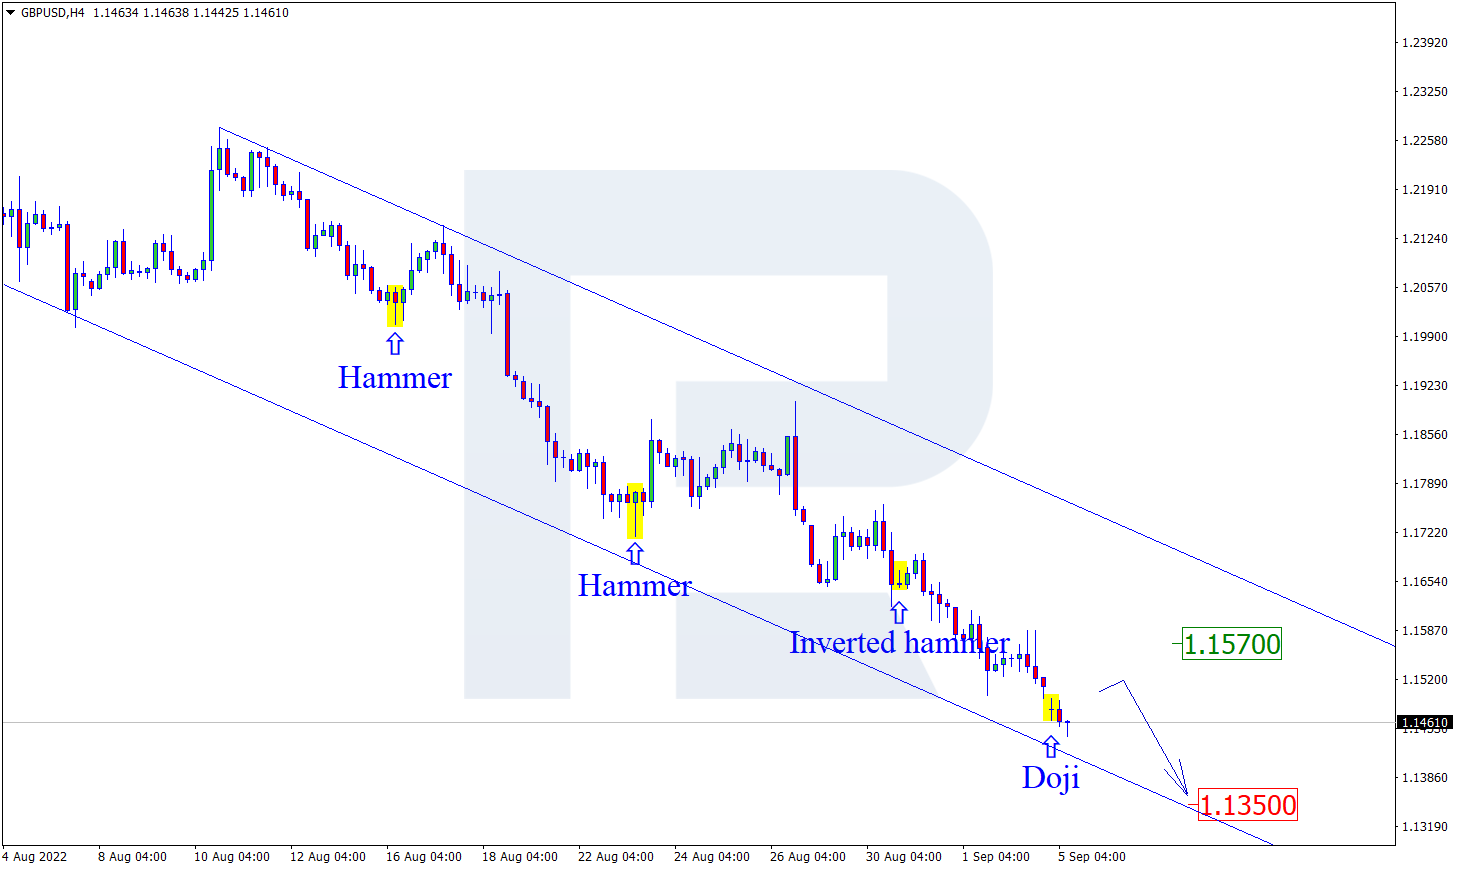
- GBPUSD: 87% chance of touching 1.15
Suffice to say, those levels for USDJPY and GBPUSD have been resoundingly breached, arriving much sooner in September than anticipated, thanks (or no thanks) to the US dollar’s resilient climb.
USDJPY is now trading around levels not seen since 1998 …

… while GBPUSD is making a throwback to 1985, back when Margaret Thatcher was UK Prime Minister.

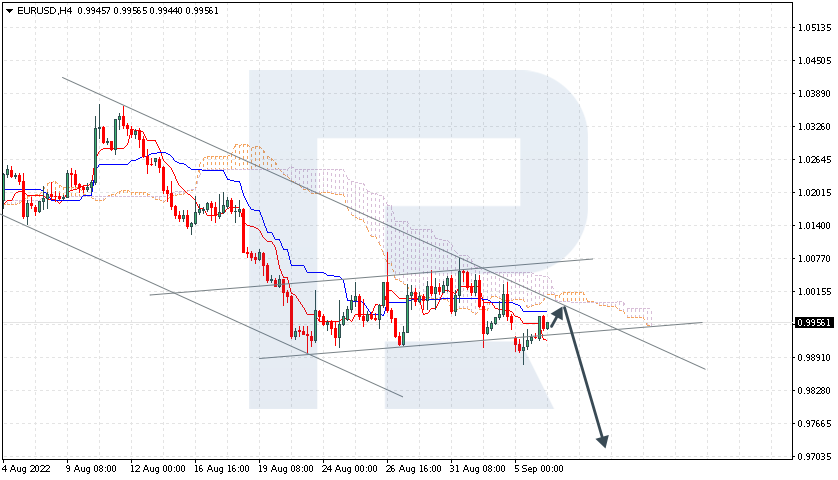
EURUSD: oh, so close …
EURUSD came within a whisker of the 0.985 level earmarked for the entirety of September, as mentioned in last Thursday’s (Sept 1st) article.
The day after, we published our latest Week Ahead article (our regular feature on Fridays):
2) Sept 2nd article: Week Ahead – ECB may surprise markets
in which I wrote:
“EURUSD could fall to as low as 0.986 in the coming week.”
To be fair, this past Tuesday, EURUSD came within a whisker of those levels.
Still, one can’t yet rule out such a move, especially with EURUSD struggling to stay around the parity mark as we count down to the European Central Bank’s policy decision due very soon.

Now, back to the US dollar wrecking havoc across major asset classes …
even dollar-denominated commodities have not been spared.
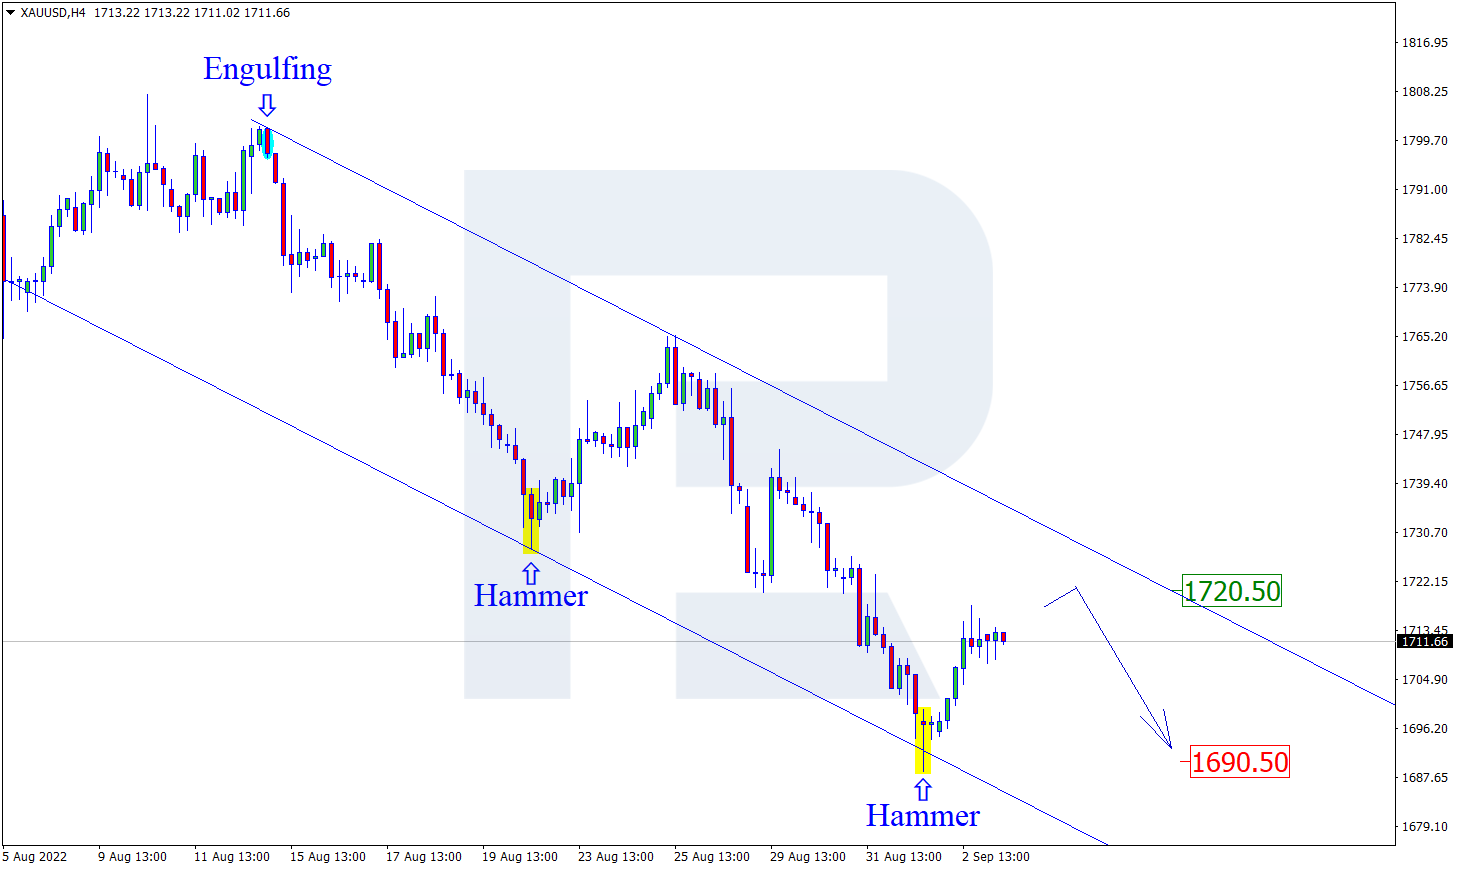
3) Aug 29th article: Trade of the Week – Gold to retest $1700 support?
Gold has been testing the psychologically-important $1700 support level over the past week, as suggested in the title of our August 29th Trade of the Week article.

And here’s what we wrote a couple of weeks ago:
“$1700: stronger support should arrive at this psychologically-important line, noting that previous dips below $1700 have proved short-lived in recent years.”
And gold’s performance since that Trade of the Week article (published every Monday) has indeed mimicked the price action from recent years, whereby dips below $1700 have proven short lived.

And that’s just a short recap of what’s transpired with these popular assets of late.
There’s bound to be more volatility and excitement across global financial markets before 2022 is over.
So keep checking back with our Daily Market Analysis as we help you keep pace with various instruments along the way,
![]() Article by ForexTime
Article by ForexTime
ForexTime Ltd (FXTM) is an award winning international online forex broker regulated by CySEC 185/12 www.forextime.com