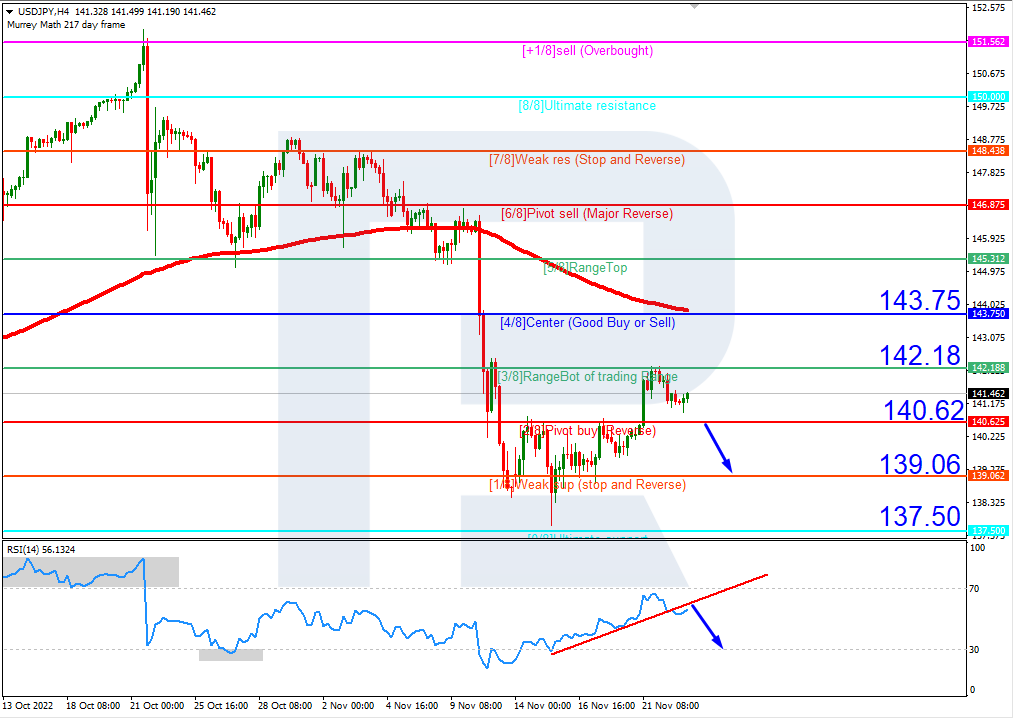
On H4, the quotes are under the 200-day Moving Average, which indicates the prevalence of a downtrend. The RSI has broken through the ascending trendline downwards. As a result, we should expect a test of 2/8 (140.62), a breakaway, and falling to the support level of 1/8 (139.06). The scenario can be cancelled by rising over the resistance level of 3/8 (142.18). In this case, the pair may rise to 4/8 (143.75).
On M15, a breakaway of the lower line of VoltyChannel will increase the probability of a decline.
USDCAD, “US Dollar vs Canadian Dollar”
The situation with the USDCAD pair is similar. On H4, the quotes are under the 200-day Moving Average, and the RSI has broken through the ascending trendline. A breakaway of 1/8 (1.3305) is expected, followed by falling to 0/8 (1.3183). The scenario can be cancelled by rising over the resistance level of 2/8 (1.3427). In this case, the pair may reach 3/8 (1.3549).
On M15, the lower line of VoltyChannel is broken away. This indicates a downtrend and a high probability of further falling.
Attention! Forecasts presented in this section only reflect the author’s private opinion and should not be considered as guidance for trading. RoboForex LP bears no responsibility for trading results based on trading recommendations described in these analytical reviews.
The BTC is recovering and looking good: the leading cryptocurrency has returned to 16,582 USD upon falling below it. However, the whole situation is troublesome.
We may suppose that the current pullback is purely technical because fundamentally speaking, the market is stressed.
Genesis keeps fighting for its life. The company has hired counselors to work out all the ways of remaining afloat. Bankruptcy is also being discussed. Moreover, experts are looking for creditors that could help deposit the company’s balance for 500 million and up to 1 billion USD.
Market players are clearly seeing the risks that have impacted other players of the sector as well. Asset withdrawal from any platform may be rough and merciless. And no one seems insured from this.
On Wednesday, capitalisation of the crypto market is 823.61 billion USD: it has restored from the bottom hit yesterday. The BTC takes up 38.7%, the ETH – 17.3%.
Salvador: times of regulations
Salvador authorities have started working on regulating digital asset services and crypto emission. They plan to create a special commission that will be registering crypto companies and control their business. Moreover, the draft bill mentions creation of a department that will be managing, storing, and invest funds.
New York State authorities have banned PoW-based mining
Governor of the New York state Kathy Hochul has signed a law that puts a two-year ban on Proof-of-Work (PoW) crypto mining. Earlier a ban was imposed on opening new companies that use environmentally dirty mining.
CRV sky-rocketed
The quotes of the CRV (Curve DAO Token) have grown by 43% overnight. Now the coin is number 82 in the Top 100 rating of crypto. The LTC have also demonstrated sufficient dynamics, growing by 29% overnight.
Attention! Forecasts presented in this section only reflect the author’s private opinion and should not be considered as guidance for trading. RoboForex LP bears no responsibility for trading results based on trading recommendations described in these analytical reviews.
ECB officials are still trying to decide which interest rate hike should be chosen at the December meeting. The main discussions are between the steps of 50 and 75 bps. Analysts think that considering the first signs of an inflation slowdown in the Eurozone, ECB will not raise the rate aggressively and, therefore, will stop at the step of 0.5%.
Trading recommendations
Support levels: 1.0193, 1.0092, 1.0043, 0.9968
Resistance levels: 1.0341, 1.0504
From the technical point of view, the trend on the EUR/USD currency pair on the hourly time frame is bullish. The price is trading at the level of the moving averages, and the MACD indicator is positive again. For buy deals, it is best to wait for the completion of the corrective movement to the support levels of 1.0193, but with additional confirmation. Sell deals can be considered from the resistance level of 1.0341 inside the day, but it is also better with confirmation.
Alternative scenario: if the price breaks down through the support level of 0.9993 and fixes below it, the downtrend will likely resume.
News feed for 2022.11.23:
– Eurozone France Manufacturing PMI (m/m) at 10:15 (GMT+3);
– Eurozone France Services PMI (m/m) at 10:15 (GMT+3);
– Eurozone German Manufacturing PMI (m/m) at 10:30 (GMT+3);
– Eurozone German Services PMI (m/m) at 10:30 (GMT+3);
– Eurozone Manufacturing PMI (m/m) at 11:00 (GMT+3);
– Eurozone Services PMI (m/m) at 11:00 (GMT+3);
– US Durable Goods Orders (m/m) at 15:30 (GMT+3);
– US Initial Jobless Claims (w/w) at 15:30 (GMT+3);
– US Manufacturing PMI (m/m) at 16:45 (GMT+3);
– US Services PMI (m/m) at 16:45 (GMT+3);
– US New Home Sales (m/m) at 17:00 (GMT+3);
– US Michigan Consumer Sentiment (m/m) at 17:00 (GMT+3);
– US Natural Gas Storage (w/w) at 19:00 (GMT+3);
– US FOMC Meeting Minutes at 21:00 (GMT+3).
The GBP/USD currency pair
Technical indicators of the currency pair:
Prev Open: 1.1821
Prev Close: 1.1884
% chg. over the last day: +0.53 %
According to a new report from the influential Paris-based OECD group, economic growth in the UK lags behind the world’s largest economies after the Covid-19 pandemic and is well below average. The G-7 countries, which include Canada, France, Germany, Italy, Japan, the US, and the UK, have collectively grown GDP by 2.5%, with only the UK registering a decline. That is the reason why the UK government first needs to regain investor confidence.
Trading recommendations
Support levels: 1.1684, 1.1476, 1.1418, 1.1172, 1.1093, 1.0915, 1.0817
Resistance levels: 1.1921
From the technical point of view, the trend on the GBP/USD currency pair on the hourly time frame is bullish. The price is trading at the level of the moving averages. The MACD indicator is inactive, and a flat structure is formed in the form of a narrowing triangle pattern. Under such market conditions, it is better to look for buy deals from the support level of 1.1684, but with confirmation. It is best to look for sell trades on intraday time frames from the resistance level of 1.1921, but it is also better with confirmation because the level has already been tested.
Alternative scenario: if the price breaks down from the 1.1418 support level and fixes below it, the downtrend will likely resume.
News feed for 2022.11.23:
– UK Manufacturing PMI (m/m) at 11:30 (GMT+3);
– UK Services PMI (m/m) at 11:30 (GMT+3).
The USD/JPY currency pair
Technical indicators of the currency pair:
Prev Open: 142.07
Prev Close: 141.21
% chg. over the last day: -0.61 %
Japan’s weighted average inflation rate, tracked as an indicator of whether price growth is expanding, reached a record 1.1% in October, indicating that inflationary pressures due to rising commodity and labor costs are intensifying. Unlike the Consumer Price Index (CPI), which is affected by fuel and energy costs, the weighted median inflation rate is useful for tracking how broadly prices are rising. According to analysts, the Bank of Japan (BOJ) may change its ultra-low interest rates if wages rise in tandem with inflation next year.
From the technical point of view, the medium-term trend on the currency pair USD/JPY is bearish. But the price is approaching the priority change level. The MACD indicator has become inactive again, and the flat structure is being formed again. Under such market conditions, traders can look to buy trades on the intraday time frames from the support level of 140.75 or 139.44, but only with confirmation. Sell positions can be looked for from the resistance level of 143.17, provided that there is a reversal or a false breakdown.
Alternative scenario: If the price fixes above 145.84, the uptrend will likely resume.
There is no news feed for today. It’s a bank holiday.
The USD/CAD currency pair
Technical indicators of the currency pair:
Prev Open: 1.3449
Prev Close: 1.3372
% chg. over the last day: -0.58 %
Statistics Canada said retail sales in September fell by 0.5%, in line with market estimates. This is below the 0.4% gain in August. On an annualized basis, retail sales rose to 6.9%. However, retail sales fell by 1% in the third quarter, which is the first quarterly decline since 2020. Against the backdrop of weakening retail sales, USD/CAD quotes declined due to heightened recession fears.
From the point of view of technical analysis, the trend on the USD/CAD currency pair is bearish. The price has corrected to the support levels. The MACD indicator became negative, and within the day, there was slight sellers’ pressure. The best way to sell is to consider the resistance level of 1.3508, but with confirmation. Buy trades should be considered on the lower time frames from the support level of 1.3351 or 1.3281, but with additional confirmation in the form of a reverse initiative.
Alternative scenario: if the price breaks out and consolidates above the resistance level of 1.3508, the uptrend will likely resume.
This article reflects a personal opinion and should not be interpreted as an investment advice, and/or offer, and/or a persistent request for carrying out financial transactions, and/or a guarantee, and/or a forecast of future events.
The US indices returned to growth on Tuesday, helped by a series of positive quarterly results from retailers. As the stock market closed, the Dow Jones Index (US30) increased by 1.18%, and the S&P 500 Index (US500) added 1.36%. The NASDAQ Technology Index (US100) gained 1.36% yesterday.
To summarize the comments from Fed officials over the past two weeks, the Central Bank is hinting at a slowdown in the pace of rate hikes at its December meeting, but the peak of rate hikes will likely be higher than previously expected. The prospect of a longer rate hike has investors worried that the Fed will not avoid a soft landing and that the economy will face a recession.
According to Statistics Canada, retail sales fell by 0.5% in September. Retail sales fell by 1% in the third quarter, the first quarterly decline since 2020. Lower-income Canadians will be hit the hardest as debt-service costs rise and purchasing power declines. According to analysts, the pain of the coming recession will not be shared equally between Canadian businesses and households. The manufacturing sector is likely to be among the first to suffer.
The OECD’s Global Economic Outlook report was also released Tuesday. According to the report, the global economy will slow down in the coming year due to the energy market shock caused by the Russian invasion of Ukraine and on the back of excessive inflation, low consumer confidence, and global risks. Nevertheless, the OECD believes the world will avoid a recession and predicts global economic growth of 3.1% in 2022, 2.2% in 2023, and 2.7% in 2024.
Stock markets in Europe were mostly up Tuesday. Germany’s DAX (DE30) gained 0.29%, France’s CAC 40 (FR40) added 0.35%, Spain’s IBEX 35 (ES35) increased by 1.67%, and the British FTSE 100 (UK100) closed up by 1.03% yesterday.
The European Union softened its latest sanctions proposal on price caps on oil exports from Russia, postponing its full implementation. According to the document, the bloc proposed adding a 45-day transition period to the imposition of the cap. Allies had previously discussed setting an upper limit between $40 and $60 a barrel – a range from prewar production costs in Russia – but analysts said the price range would probably be a bit higher. The EU is also proposing a 90-day transition period in case of any future changes in the price cap level. Most G-7 countries and the EU plan to stop importing Russian oil this year. Petroleum product regulations, including the oil price cap, will take effect in February.
Asian markets traded flat yesterday. Japan’s Nikkei 225 (JP225) gained 0.61% on Tuesday, Hong Kong’s Hang Seng (HK50) decreased by 1.31%, while Australia’s S&P/ASX 200 (AU200) ended the day up by 0.59%.
The Central Bank of New Zealand raised interest rates by a record 75 basis points and hinted at the further tightening of policy. The RBNZ forecasts show that OCR will peak at 5.5% in the third quarter of 2023, up from the previous peak of 4.1%. The bank forecasts that the economy will contract for four consecutive quarters starting in the second quarter of next year, with inflation starting to decline in the first quarter of 2023.
Concerns are growing in Japan that supply and demand for electricity will be strained this winter. The Japanese government is asking households and companies across the country to start saving electricity from December 1 through March 31. Although no quantitative figures have been set, this is the first time in seven years that people are being asked to save electricity during winter.
S&P 500 (F) (US500) 4,003.58 +53.64 (+1.36%)
Dow Jones (US30) 34,098.10 +397.82 (+1.18%)
DAX (DE40) 14,422.35 +42.42 (+0.29%)
FTSE 100 (UK100) 7,452.84 +75.99 (+1.03%)
USD Index 107.17 0.67 (-0.62%)
Important events for today:
– Australia Manufacturing PMI (m/m) at 00:00 (GMT+3);
– Australia Services PMI (m/m) at 00:00 (GMT+3);
– New Zealand RBNZ Interest Rate Decision at 03:00 (GMT+3);
– New Zealand RBNZ Monetary Policy Statement at 03:00 (GMT+3);
– New Zealand RBNZ Press Conference at 04:00 (GMT+3);
– Singapore Consumer Price Index (m/m) at 07:00 (GMT+3);
– Eurozone France Manufacturing PMI (m/m) at 10:15 (GMT+3);
– Eurozone France Services PMI (m/m) at 10:15 (GMT+3);
– Eurozone German Manufacturing PMI (m/m) at 10:30 (GMT+3);
– Eurozone German Services PMI (m/m) at 10:30 (GMT+3);
– Eurozone Manufacturing PMI (m/m) at 11:00 (GMT+3);
– Eurozone Services PMI (m/m) at 11:00 (GMT+3);
– UK Manufacturing PMI (m/m) at 11:30 (GMT+3);
– UK Services PMI (m/m) at 11:30 (GMT+3);
– US Durable Goods Orders (m/m) at 15:30 (GMT+3);
– US Initial Jobless Claims (w/w) at 15:30 (GMT+3);
– US Manufacturing PMI (m/m) at 16:45 (GMT+3);
– US Services PMI (m/m) at 16:45 (GMT+3);
– US New Home Sales (m/m) at 17:00 (GMT+3);
– US Michigan Consumer Sentiment (m/m) at 17:00 (GMT+3);
This article reflects a personal opinion and should not be interpreted as an investment advice, and/or offer, and/or a persistent request for carrying out financial transactions, and/or a guarantee, and/or a forecast of future events.
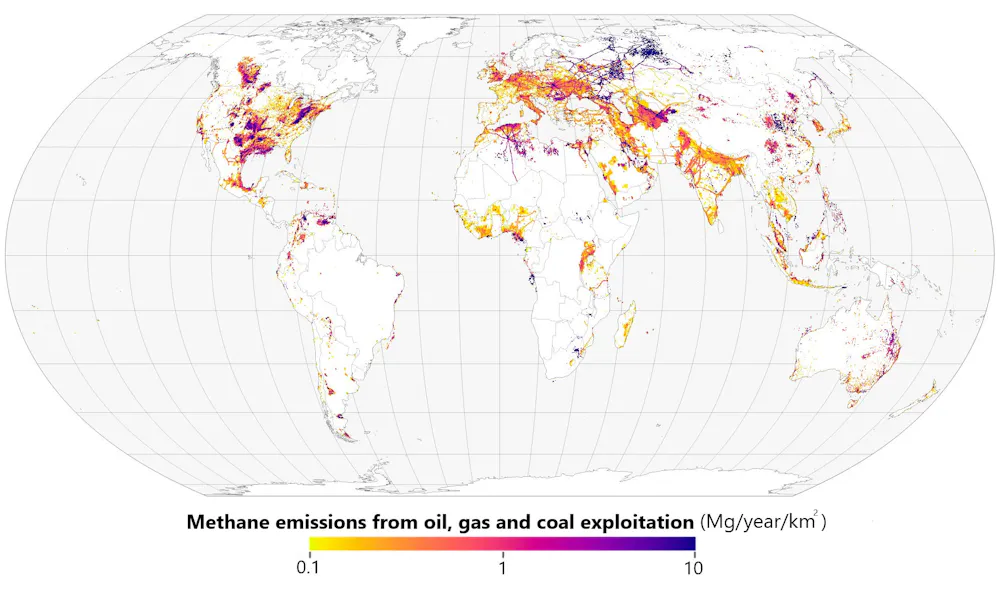
What’s the cheapest, quickest way to reduce climate change without roiling the economy? In the United States, it may be by reducing methane emissions from the oil and gas industry.
Methane is the main component of natural gas, and it can leak anywhere along the supply chain, from the wellhead and processing plant, through pipelines and distribution lines, all the way to the burner of your home’s stove or furnace.
Once it reaches the atmosphere, methane’s super heat-trapping properties render it a major agent of warming. Over 20 years, methane causes 85 times more warming than the same amount of carbon dioxide. But methane doesn’t stay in the atmosphere for long, so stopping methane leaks today can have a fast impact on lowering global temperatures.
That’s one reason governments at the 2022 United Nations climate change conference in Egypt focused on methane as an easy win in the climate battle.
So far, 150 countries, including the United States and most of the big oil producers other than Russia, have pledged to reduce methane emissions from oil and gas by at least 30%. China has not signed but has agreed to reduce emissions. If those pledges are met, the result would be equivalent to eliminating the greenhouse gas emissions from all of the world’s cars, trucks, buses and all two- and three-wheeled vehicles, according to the International Energy Agency.
There’s also another reason for the methane focus, and it makes this strategy more likely to succeed: Stopping methane leaks from the oil and gas industry can largely pay for itself and boost the amount of fuel available.
Capturing methane can pay off
Methane is produced by decaying organic material. Natural sources, such as wetlands, account for roughly 40% of today’s global methane emissions. But the majority comes from human activities, such as farms, landfills and wastewater treatment plants – and fuel production. Oil, gas and coal together make up about a third of global methane emissions.
In all, methane is responsible for almost a third of the 1.2 degrees Celsius (2.2 degrees Fahrenheit) that global temperatures have risen since the industrial era.
Unfortunately, methane emissions are still rising. In 2021, atmospheric levels increased to 1,908 parts per billion, the highest levels in at least 800,000 years. Last year’s increase of 18 parts per billion was the biggest on record.
Among the sources, the oil and gas sector is best equipped to stop emitting because it is already configured to sell any methane it can prevent from leaking.
Methane leaks and “venting” in the oil and gas sector have numerous causes. Unintentional leaks can flow from pneumatic devices, valves, compressors and storage tanks, which often are designed to vent methane when pressures build.
Nearly all of these emissions can be stopped with new components or regulations that prohibit routine flaring.
Making those repairs can pay off. Global oil and gas operations emitted more methane in 2021 than Canada consumed that entire year, according to IEA estimates. If that gas were captured, at current U.S. prices – $4 per million British thermal unit – that wasted methane would fetch around $17 billion. The IEA determined that a one-time investment of $11 billion would eliminate roughly 75% of methane leaks worldwide, along with an even larger amount of gas that is wasted by “flaring” or burning it off at the wellhead.
Motivating U.S. producers to act has been the big hurdle.
The Biden administration is aiming for an 87% reduction in methane emissions below 2005 levels by the end of the decade. To get there, it has reimposed and strengthened U.S. methane rules that were dropped by the Trump administration. These include requiring drillers to find and repair leaks at more than 1 million U.S. well sites.
The U.S. Inflation Reduction Act of 2022 further incentivizes methane mitigation, including by levying an emissions tax on large oil and gas producers starting at $900 per ton in 2024, increasing to $1,500 in 2026. That fee, which can be waived by the Environmental Protection Agency and doesn’t affect small producers or leaks below 0.2% of gas produced, is based on the social cost to society from methane’s contribution to climate damage.
Customers are also putting pressure on the industry. Regulatory indifference by the Trump administration to U.S. methane flaring and venting led to cancellation of some European plans to import U.S. liquefied natural gas.
Reducing methane isn’t always straightforward, though, particularly in the U.S., where thousands of oil companies operate with minimal oversight.
A company’s methane emissions aren’t necessarily proportional to its oil and gas production, either. For example, a 2021 study using data from the EPA found Texas-based Hilcorp Energy reporting nearly 50% more methane emissions than ExxonMobil, despite producing less oil and gas. Hilcorp, which specializes in acquiring “late life” assets, says it is working to reduce emissions. Other little-known producers have also reported large emissions.
Investor pressure has pushed several publicly traded companies to reduce their methane emissions, but in practice this sometimes leads them to sell off “dirty” assets to smaller operators with less oversight.
Unlike carbon dioxide, which lingers in the atmosphere for a century or more, methane only sticks around for about a dozen years. So, if humans stop replenishing methane stocks in the atmosphere, those levels will decline.
A review of methane leaks in the Permian Basin shows the big impact that some regions can have.
Researchers found that gas and oil operations in the Permian, in west Texas and New Mexico, had a leakage rate estimated at 3.7% in 2018 and 2019, before the pandemic. A 2012 study found that leakage rates above 3.2% make climate damage from using natural gas worse than that from burning coal, which is normally considered the biggest climate threat.
Methane leaks used to escape detection because the gas is invisible. Now, the proliferation of satellite-based sensors and infrared cameras makes detection easy.
Companies such as GTI Energy’s Veritas, Project Canary and MiQ have also launched to assist natural gas producers in reducing emissions and then verifying the reductions. At that point, if leaks are less than 0.2%, producers can avoid the federal fee and also market their output as “responsibly sourced” gas.
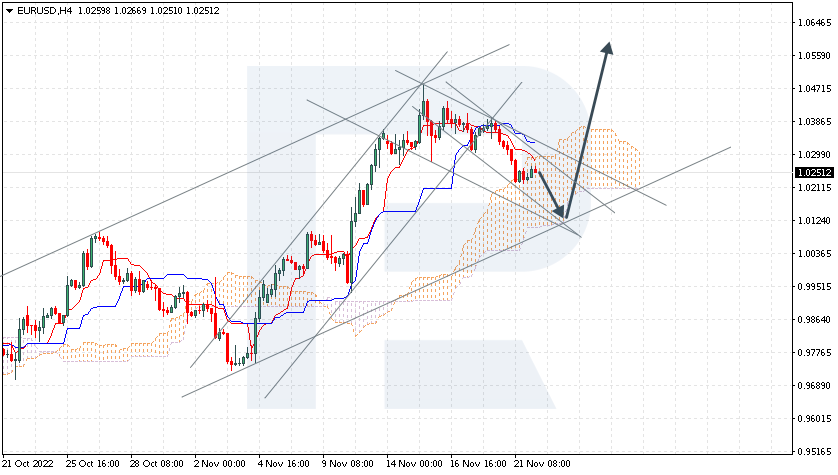
The pair is correcting inside a bullish channel. The instrument is going inside the Ichimoku Cloud, which suggests a flat. A test of the lower border of the Cloud at 1.0125 is expected, followed by growth to 1.0575. An additional signal confirming the growth will be a bounce off the lower border of the bullish channel. The scenario can be cancelled by a breakaway of the lower border of the Cloud and securing under 1.0015, which will mean further falling to 1.0025. The growth will be confirmed by a breakaway of the upper border of the correctional channel and securing above 1.0335.
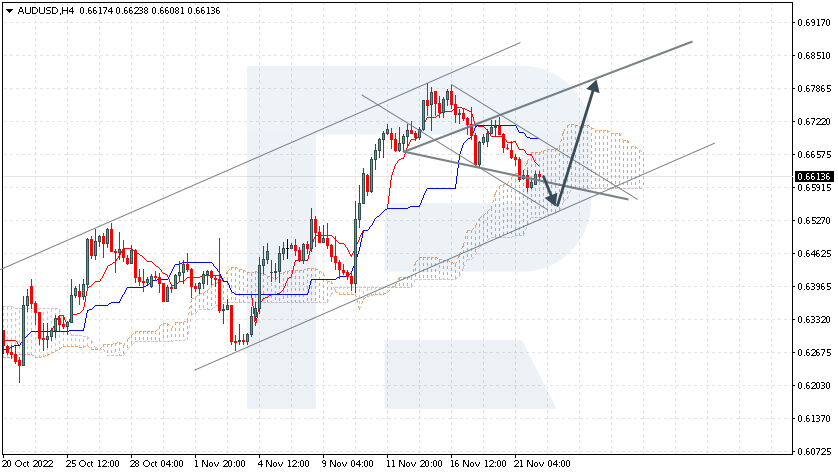
AUDUSD, “Australian Dollar vs US Dollar”
The pair is testing the lower border of a bullish Wolfe Waves pattern. The instrument is going above the Ichimoku Cloud, which suggests an uptrend. A test of the lower border of the Cloud at 0.6545 is expected, followed by growth to 0.6785. An additional signal confirming the growth will be a bounce off the lower border of the bullish channel. The scenario can be cancelled by a breakaway of the lower border of the Cloud and securing under 0.6475, which will mean further falling to 0.6385. The growth will be confirmed by a breakaway of the upper border of the correctional channel and securing above 0.6655.
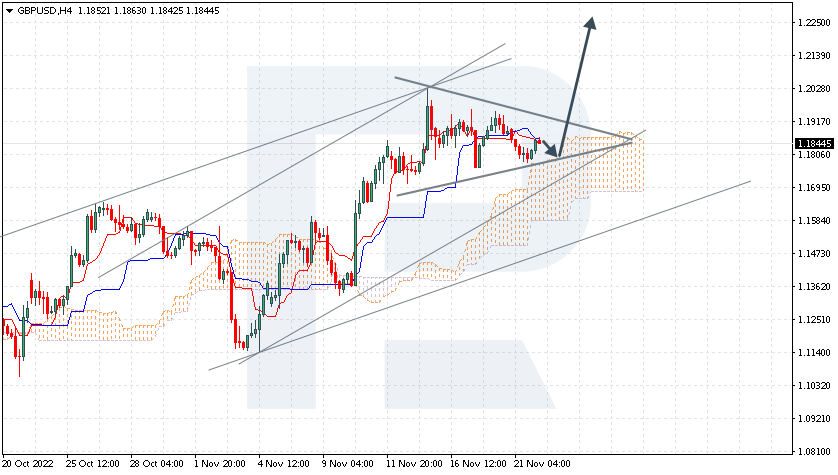
GBPUSD, “Great Britain Pound vs US Dollar”
The pair is squeezed in a Triangle pattern. The instrument is going above the Ichimoku Cloud, which suggests an uptrend. A test of the upper border of the Cloud at 1.1805 is expected, followed by growth to 1.2255. An additional signal confirming the growth will be a bounce off the lower border of the Triangle pattern. The scenario can be cancelled by a breakaway of the lower border of the Cloud and securing under 1.1475, which will mean further falling to 1.1485. The growth will be confirmed by a breakaway of the upper border of the Triangle and securing above 1.1925
Attention! Forecasts presented in this section only reflect the author’s private opinion and should not be considered as guidance for trading. RoboForex LP bears no responsibility for trading results based on trading recommendations described in these analytical reviews.
On Tuesday, the market major hardly moves; the current quote is 1.0250.
Yesterday the news background for currencies was still, because main expectations were concentrated on commodities. The macroeconomic calendar is also empty, and the quotes have accounted for any expectations of the actions of the US Fed. Today important statistics will also be scarce.
On Tuesday afternoon, the Euro zone will publish the CCI for November, and the US – the PMI in Richmond production. Both reports are unlikely to impress investors.
And while market players are saving power, contemplating the background, the European gas market is worth taking a look at. Warm weather allowed for saving fuel, which eases inflation stress at least temporarily. Moreover, Europe has started to take care of making reserves of energy carriers for the future and is negotiating with alternative suppliers. If things go smooth, the EUR might get some support.
Attention! Forecasts presented in this section only reflect the author’s private opinion and should not be considered as guidance for trading. RoboForex LP bears no responsibility for trading results based on trading recommendations described in these analytical reviews.
ECB representative Centeno indicated yesterday that the ECB is considering a rate hike of less than 75bs. But his colleague Holzmann, head of the Austrian National Bank, believes that if current inflation does not start to decline, he will vote for a 0.75% rate hike. As a result, the main report influencing the ECB’s next move is the next inflation report.
Trading recommendations
Support levels: 1.0193, 1.0092, 1.0043, 0.9968
Resistance levels: 1.0384, 1.0504
From the technical point of view, the trend on the EUR/USD currency pair on the hourly time frame is bullish. But the price is trading below the moving averages, the MACD indicator is in the negative zone, and there is a slight sellers’ pressure. For buy deals, it is best to wait for the completion of the corrective movement to the support levels of 1.0193, but with additional confirmation. Sell deals can be considered from the resistance level of 1.0384 intraday, but it is also better with confirmation since the level has already been tested.
Alternative scenario: if the price breaks down through the support level of 0.9993 and fixes below it, the downtrend will likely resume.
News feed for 2022.11.22:
– FOMC Member Mester Speaks (m/m) at 18:00 (GMT+3);
– FOMC Member George Speaks (m/m) at 21:15 (GMT+3);
– FOMC Member Bullard Speaks (m/m) at 21:45 (GMT+3).
The GBP/USD currency pair
Technical indicators of the currency pair:
Prev Open: 1.1896
Prev Close: 1.1822
% chg. over the last day: -0.63 %
The dollar index found additional support yesterday after Mary Daly, president of the Federal Reserve Bank of San Francisco, said Monday that the US central bank may raise its overnight target rate above 5% if inflation does not cool down. A rise in the dollar index provokes a decline in the British currency, though it should be noted that the pound sterling is now trading more confidently than a month ago and is resisting the decline more than the euro.
Trading recommendations
Support levels: 1.1684, 1.1476, 1.1418, 1.1172, 1.1093, 1.0915, 1.0817
Resistance levels: 1.1921
From the technical point of view, the trend on the GBP/USD currency pair on the hourly time frame is bullish. But the price is trading at the level of the moving averages. The MACD indicator has become inactive, and a flat structure is forming. Under such market conditions, it is better to look for buy deals from the support level of 1.1684. Sell deals are best sought on intraday time frames from the resistance level of 1.1921, but better with confirmation since the level has already been tested.
Alternative scenario: if the price breaks down of the 1.1418 support level and fixes below it, the downtrend will likely resume.
News feed for 2022.11.22:
There is no news feed for today.
The USD/JPY currency pair
Technical indicators of the currency pair:
Prev Open: 140.31
Prev Close: 142.11
% chg. over the last day: +1.28 %
Sayuri Shirai, a candidate for vice governor, believes the Bank of Japan needs to move toward a more flexible interest rate policy. According to Shirai, who has a degree, the Bank of Japan should be more flexible in adjusting interest rates in response to cyclical economic fluctuations. But because the Japanese economy lacks momentum, the Bank of Japan may have to keep interest rates ultra-low even after Governor Haruhiko Kuroda’s term ends in April 2023. The best option for Shirai is to move to a neutral rate that will neither stimulate economic growth nor restrict it.
From the technical point of view, the medium-term trend on the currency pair USD/JPY is bearish. But the price is approaching the priority change level. The MACD indicator is positive again, and the buyers’ pressure is increasing. Under such market conditions, traders can look for buy trades on the intraday time frames from the support level of 140.75 or 139.44, but only with confirmation. Sell deals can be searched from the resistance level of 143.17, under the condition of a reverse reaction or a false breakdown.
Alternative scenario: If the price fixes above 145.84, the uptrend will likely resume.
There is no news feed for today.
The USD/CAD currency pair
Technical indicators of the currency pair:
Prev Open: 1.3373
Prev Close: 1.3451
% chg. over the last day: +0.58 %
The Canadian dollar is a commodity currency, so it depends not only on the monetary policy of the Bank of Canada but also on indicators such as the dollar index and oil prices. Since the central banks of Canada and the United States are keeping their rates at about the same level and have similar monetary policies, the main imbalance in the USD/CAD quotes right now is oil. Crude oil markets rose sharply yesterday near the end of Monday’s trading session after Saudi Arabia, the OPEC leader, said reports suggesting the cartel was planning to increase supply in December were false. Stronger oil is positive for the Canadian currency but negative for inflation indicators.
From the point of view of technical analysis, the trend on the USD/CAD currency pair is bearish. But inside the day, there is a predominance of buying. The MACD indicator is positive again, and the price is trading above the levels of moving averages. The best way to sell is to consider the resistance level of 1.3508, but with confirmation. Buy trades should be considered on the lower time frames from the support level of 1.3351 or 1.3281, but with additional confirmation in the form of a reverse initiative.
Alternative scenario: if the price breaks out and consolidates above the resistance level of 1.3508, the uptrend will likely resume.
This article reflects a personal opinion and should not be interpreted as an investment advice, and/or offer, and/or a persistent request for carrying out financial transactions, and/or a guarantee, and/or a forecast of future events.
On Monday, US indices closed slightly lower on weakness in energy and consumer stocks amid reports that China has reverted to disruptive restrictions related to the coronavirus. As the stock market closed, the Dow Jones Index (US30) decreased by 0.13%, and the S&P 500 Index (US500) lost 0.13%. The NASDAQ Technology Index (US100) was down by 1.09% yesterday.
Over the weekend, Atlanta Fed President Raphael Bostic supported further rate hikes, although he said he would consider slowing the rate hike from 75 basis points to 50. San Francisco Federal Reserve President Mary Daly said Monday that the real impact of the US central bank’s interest rate hike is probably greater than its short-term target rate suggests. Compared to the Fed’s current short-term target rate, which is in the 3.75% to 4.00% range, financial markets are acting as if the rate is around 6%, Daly said. About 85% of analysts expect the Fed to raise by 50 basis points in December.
Stock markets in Europe were mostly down Monday. German DAX (DE30) decreased by 0.36%, French CAC 40 (FR40) was 0.15% lower, Spanish IBEX 35 (ES35) gained 0.75%, and British FTSE 100 (UK100) closed 0.12% lower.
According to the Federal Statistics Office (Destatis), the producer price index, which measures inflation between factories, slowed. Compared to September 2022, producer prices decreased by 4.2%. This is a good sign, as slowing producer inflation will eventually lead to slower consumer inflation.
UK Prime Minister Rishi Sunak said yesterday that the UK would no longer maintain any relationship with Europe that is based on compliance with EU laws. Britain’s withdrawal from the EU has caused serious economic damage to the region’s economy, so now the new prime minister has to face the consequences of Brexit.
According to Nomura Holdings Inc. Czech Republic, Romania and Hungary will face the risk of exchange rate crises over the next year as fiscal and external problems escalate. The warning is based on an analysis of eight indicators, including import coverage by foreign-exchange reserves, real short-term interest rates, and fiscal and current-account measures.
Crude oil markets rose sharply late in the trading session yesterday after Saudi Arabia, OPEC’s leader, said reports suggesting the cartel planned to increase supply in December were false.
Asian markets were mostly down yesterday. Japan’s Nikkei 225 (JP225) gained 0.16% on Monday, Hong Kong’s Hang Seng (HK50) decreased by 1.87%, and Australia’s S&P/ASX 200 (AU200) ended the day down by 0.17%.
New Zealand’s Central Bank is preparing to raise interest rates by 75 basis points, accelerating monetary tightening to bring inflation under control. According to analysts, tomorrow, the Reserve Bank will raise the official interest rate to 4.25% from 3.5%. This will be the biggest increase since the RBNZ introduced the OCR in 1999. Stronger-than-expected inflation and a near-record-low unemployment rate are forcing the RBNZ to accelerate policy tightening.
Most Asian central banks have also begun raising rates this year to keep up with the US Federal Reserve and are signaling further rate hikes to counter rising inflation.
A record rise in daily infections in China has led to the reintroduction of curbs in major cities, including Beijing and Shanghai. Markets fear tighter curbs could again stifle the country’s economic growth and cause new global supply chain problems.
S&P 500 (F) (US500) 3,949.99 −15.35 (−0.39%)
Dow Jones (US30) 33,700.67 −45.02 (−0.13%)
DAX (DE40) 14,379.93 −51.93 (−0.36%)
FTSE 100 (UK100) 7,376.85 −8.67 (−0.12%)
USD Index 107.77 +0.84 (+0.79%)
Important events for today:
– Australia RBA Governor Lowe Speaks at 09:00 (GMT+3);
– Canada Retail Sales (m/m) at 15:30 (GMT+3);
– FOMC Member Mester Speaks (m/m) at 18:00 (GMT+3);
– FOMC Member George Speaks (m/m) at 21:15 (GMT+3);
– FOMC Member Bullard Speaks (m/m) at 21:45 (GMT+3).
This article reflects a personal opinion and should not be interpreted as an investment advice, and/or offer, and/or a persistent request for carrying out financial transactions, and/or a guarantee, and/or a forecast of future events.
The planet is heating up as greenhouse gas emissions rise, contributing to extreme heat waves and once-unimaginableflooding. Yet despite the risks, countries’ policies are not ontrack to keep global warming in check.
The problem isn’t a lack of technology. The International Energy Agency recently released a detailed analysis of the clean energy technology needed to lower greenhouse gas emissions to net zero globally by 2050. What’s needed, the IEA says, is significant government support to boost solar and wind power, electric vehicles, heat pumps and a variety of other technologies for a rapid energy transition.
One politically popular tool for providing that government support is the subsidy. The U.S. government’s new Inflation Reduction Act is a multibillion-dollar example, packed with financial incentives to encourage people to buy electric vehicles, solar panels and more.
But just how big do governments’ clean energy subsidies need to be to meet their goals, and how long are they needed?
Our research points to three important answers for any government considering clean energy subsidies – and for citizens keeping an eye on their progress.
Why subsidize at all?
An obvious first question is: Why should governments subsidize clean energy at all?
Reducing emissions helps to lower both public health costs and damage from climate change, which justifies government spending. Reports have estimated that the U.S. spends US$820 billion a year just on health costs associated with air pollution and climate change. Globally, the World Health Organization estimated that the costs reached $5.1 trillion in 2018. Taxing and regulating polluting industries can also cut emissions, but carrots are often more politically popular than sticks.
Subsidies helped launch the solar industry. Buyers today can get a 30% tax credit for home solar installations. Joe DelNero/NREL
A less obvious reason for subsidies is that government support can help a new and initially expensive technology become competitive in the market.
Governments have been central to the development of many technologies that are pervasive today, including microchips, the internet, solar panels and GPS. Microchips were fantastically expensive when first developed in the 1950s. Demand from the U.S. military and NASA, which could pay the high price, fueled the growth of the industry, and costs eventually dropped enough that they’re now found in everything from cars to toasters.
Government support has also helped to bring down the cost of solar power. Rooftop solar system costs fell 64% from 2010 to 2020 in the U.S. because cells became more efficient and higher volumes drove prices down.
How much money?
So, subsidies can work, but what’s the right amount?
Too low, and a subsidy has no effect. Giving everyone a coupon for $1 off an electric car won’t change anyone’s buying plans. But subsidies can also be set too high.
The government doesn’t need to spend money persuading consumers who already plan to buy an electric car and can afford one, yet studies show clean energy subsidies disproportionately go to richer people. When people who would have purchased the item anyway receive subsidies, they’re known as “free riders.”
The ideal subsidy attracts new buyers while avoiding free riders and overspending on people who are already convinced. The subsidy can only work when it convinces a previously uninterested consumer to buy a product.
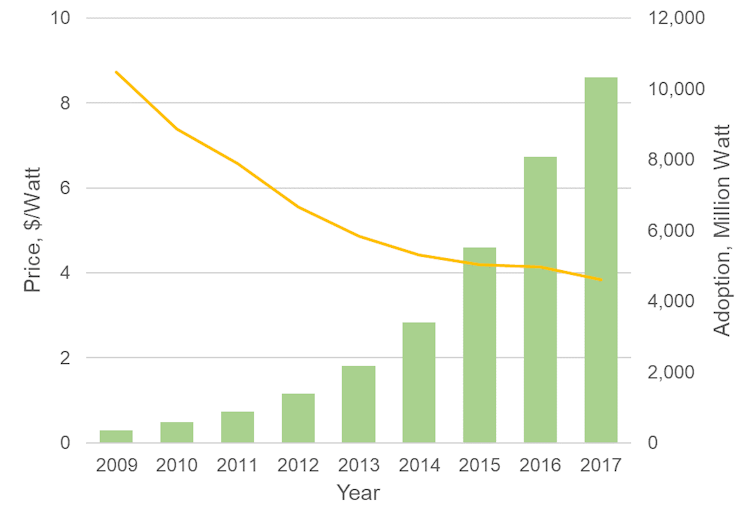
Between 2009 and 2017, solar prices fell 50% and solar purchases increased tenfold with the help of subsidies. Lower cost makes a technology more attractive, while a growing solar industry is able to produce panels at lower cost. Barbose et al., 2021; Solar Market Insight Report/SEIA
How long should subsidies last?
Timing is also important when thinking about the size of subsidies. When a promising technology is new and expensive, free riders are less of an issue. A large subsidy may be needed to attract even a few buyers, build out the emerging market and support the industry’s growth.
Solar power is a good example: In 2005, solar was several times more expensive than traditional electricity sources. Subsidies, like the 30% Investment Tax Credit established that year, helped lower the cost, and today’s solar is about one-tenth the price and cost-competitive with other electricity sources.
Once a clean technology is competitive, subsidies can still play an important role in speeding up the energy transition, but at a lower level than in the past.
In our research on residential solar panels, we estimate that the ideal subsidy for rooftop solar should have been initially higher than the actual federal tax credit but fall more quickly, declining to zero after 14 years from its start date.
By starting the subsidy about 20% higher, our models found that it would have boosted production faster, which would cut costs faster and reduce the need for high future subsidies.
Should subsidies eventually disappear?
It makes sense for subsidies to disappear altogether once a technology is sufficiently cost-competitive. However, even if a technology is competitive, it might be worth further subsidy if the speed of adoption is important.
The argument for continuing a subsidy depends on whether the additional adoption it stimulates is cost-effective in reducing emissions. Wind power is cheaper than fossil fuel power in many parts of the country. Even so, we found that continuing subsidies for wind power would lead to valuable emission benefits.
That said, sometimes subsidies stick around when they shouldn’t.
Fossil fuels have been heavily subsidized for decades, despite their harm to human health, the environment and the climate, all of which raise public costs. Governments globally spent almost $700 billion on fossil fuel subsidies in 2021. The U.S. government, in recent years, has spent more on renewable energy tax credits than fossil fuels, which is a promising transition of government support.
Global impact
While the U.S. was the focus of our solar subsidy research, this way of thinking – balancing the costs and benefits of subsidies – can be applied in other nations to design better subsidies for clean energy technologies.
The subsidy is just one policy tool, but it is an important one for both stimulating early-stage technologies and accelerating deployment of more competitive options. As the world attempts the fastest energy transition in history, today’s energy subsidy decisions will affect its ability to succeed.